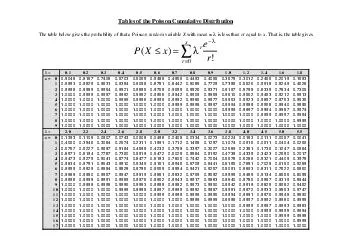
That is the table gives Xx 01 02 03 04 05 06 07 08 09 10 12 14 16 18 x 09048 08187 07408 06703 06065 05488 04966 04493 04066 03679 03012 02466 02019 01653 09953 09825 09631 09384 09098 08781 08442 08088 07725 07358 06626 05918 05249 04628 09998 09 ID: 26501 Download Pdf
satellite to track carbon dioxide in the . Earth. ’s atmosphere failed to reach its orbit during launching Tuesday morning, scuttling the $278 million mission.. . Andrew Lee/U.S. Air Force, via Associated Press.
Introduction to Biostatistics and Bioinformatics. Distributions. This Lecture. By Judy Zhong. Assistant Professor. Division of Biostatistics. Department of Population Health. Judy.zhong@nyumc.org. Introduction.
The Poisson random variable was first introduced by the French mathematician Simeon-Denis Poisson (1781-1840). He discovered it as a limit to the binomial distribution as the number of trials . n. approaches infinity..
1. 3. Discrete Random Variables and Probability Distributions. 3-1 Discrete Random Variables. 3-2 Probability Distributions and Probability Mass Functions. 3-3 Cumulative Distribution Functions. 3-4 Mean and Variance of a Discrete Random Variable.
Quantitative Analysis for Business Decisions. 2. 4.6 Standard Discrete Distributions continued. Further Examples on Use. Example 5. : . The probability of a . good. component in inspecting assembly line output is known to be 0.8 ; probability of a .
St. . Edward’s. University. .. .. .. .. .. .. .. .. .. .. .. Chapter 5. Discrete Probability Distributions. .10. .20. .30. .40. 0 . . 1 . . 2 3 4. Random Variables.
Sections 4.7, 4.8: Poisson and . Hypergeometric. Distributions. Jiaping. Wang. Department of Mathematical Science . 03/04/2013, Monday. Outline. Poisson: Probability Function. . Poisson: Mean and Variance.
1. http://www.landers.co.uk/statistics-cartoons/. 5.1-5.2: Random Variables - Goals. Be able to define what a random variable is.. Be able to differentiate between discrete and continuous random variables..
Named After Siméon-Denis Poisson. What’s The Big Deal?. Binomial and Geometric distributions only work when we have Bernoulli trials.. There are three conditions for those.. They happen often enough, to be sure, but a good many situations do not fit those models..
The Geometric and Poisson Distributions Geometric Distribution – A geometric distribution shows the number of trials needed until a success is achieved. Example: When shooting baskets, what is the probability that the first time you make the basket will be the fourth time you shoot the ball?
Published bystefany-barnette
That is the table gives Xx 01 02 03 04 05 06 07 08 09 10 12 14 16 18 x 09048 08187 07408 06703 06065 05488 04966 04493 04066 03679 03012 02466 02019 01653 09953 09825 09631 09384 09098 08781 08442 08088 07725 07358 06626 05918 05249 04628 09998 09
Download Pdf - The PPT/PDF document "Tables of the Poisson Cumulative Distrib..." is the property of its rightful owner. Permission is granted to download and print the materials on this web site for personal, non-commercial use only, and to display it on your personal computer provided you do not modify the materials and that you retain all copyright notices contained in the materials. By downloading content from our website, you accept the terms of this agreement.
© 2021 docslides.com Inc.
All rights reserved.