/
Using “Big Data” to Track Consumer Spending in Real Time Using “Big Data” to Track Consumer Spending in Real Time

Using “Big Data” to Track Consumer Spending in Real Time - PowerPoint Presentation

stefany-barnette
stefany-barnette . @stefany-barnette
Follow
344 views
Uploaded On 2019-12-14

Using “Big Data” to Track Consumer Spending in Real Time - PPT Presentation

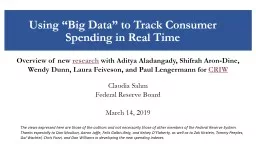
Using Big Data to Track Consumer Spending in Real Time Claudia Sahm Federal Reserve Board March 14 2019 The views expressed here are those of the authors and not necessarily those of other ID: 770355

data spending census slide spending data slide census retail economic statistics official national big daily hurricanes irma transactions 2016

Share:

Link:

Embed:

Download Presentation from below link

Download Presentation The PPT/PDF document "Using “Big Data” to Track Consumer S..." is the property of its rightful owner. Permission is granted to download and print the materials on this web site for personal, non-commercial use only, and to display it on your personal computer provided you do not modify the materials and that you retain all copyright notices contained in the materials. By downloading content from our website, you accept the terms of this agreement.


Presentation Transcript

Using “Big Data” to Track Consumer Spending in Real Time Claudia Sahm Federal Reserve BoardMarch 14, 2019 The views expressed here are those of the authors and not necessarily those of other members of the Federal Reserve System. Thanks especially to Dan Moulton, Aaron Jaffe, Felix Galbis-Reig, and Kelsey O’Flaherty, as well as to Zak Kirstein, Tommy Peeples, Gal Wachtel, Chris Pozzi, and Dan Williams in developing the new spending indexes. Overview of new research with Aditya Aladangady, Shifrah Aron-Dine , Wendy Dunn, Laura Feiveson , and Paul Lengermann for CRIW

Can “Big Data” improve macro policy making? Slide 2 of 10 H uge amount of detailed data already created in business operations A ddress gaps in official statistics: geographic, high frequency, timely Not constructed with same statistical rigor and theory as official statistics Short time series, often not comparable to prior economic events Promise Challenge

“Big Data” is a big TEAM effort Slide 3 of 10 Important public good when private companies share data created in doing business and support economic statistics Partnering here with First Data, a global payment technology company, that processes $2 trillion in card transactions annuallyNew anonymized indexes: a multi-disciplinary effort: economists at the Fed working with engineers and programmers at Palantir Confidence in new indexes required comparisons to official statistics from Census Bureau and Bureau of Economic Analysis

Filter and combine card transactions on retail activity Slide 4 of 1012-month percent change, spending at retail s tores and restaurants Census First Data 300 First Data BEFORE Before: changes in business operations swamp changes in economy-wide spending, not useful for macro policy AFTER Census 200 100 0 2014 2015 2016 2017 2018 2012 2014 2016 2018 10 5 0

Filter and combine transactions on retail activity Slide 5 of 1012-month percent change, spending at retail s tores and restaurants Census First Data 300 First Data BEFORE After: changes in new index in national monthly sales similar to Census Bureau, transactions do capture economic activity AFTER Census 2 00 100 0 2014 2015 2016 2017 2018 2012 2014 2016 2018 10 5 0 Correlation 0.9

Tracking Hurricanes Harvey and Irma in real t ime Tracked and reported on spending disruption within three daysSlide 6 of 10

Sharp decline in spending with hurricanes Within week spending back to normal, no rapid make up spendingSlide 7 of 10 Source : First Data Merchant Services, Board estimates. Effect on national, daily spending at retail s tores and restaurants

Spending in d irect path of hurricanes nearly halted Geographic detail shows spending in metro areas in direct path declined by 75 to 100 percent with Irma, similar with Harvey Slide 8 of 10Effect of Irma on local, daily spending at retail stores and restaurantsFort Myers Miami Jacksonville Pensacola

Translating daily disruptions to quarterly GDP Effect of hurricane or other severe weather on national GDP depends on severity of weather event and population affected Geographic, daily data allows us to isolate economic effects of short-lived, localized weather events with more confidence than is possible with national, monthly data Our tracking of local daily spending at retailers and restaurant suggest almost ½ percentage point less GDP growth in third quarter of 2017 from Hurricanes Irma and Harvey Slide 9 of 10

At early stages of harnessing “Big Data” for macro policy analysis, requires new techniques and scrutinizing data quality New spending indexes used to study high-frequency, localized events in real time (other examples: delay in EITC, state sales tax holidays ) can fill gaps from official national statistics New, independent data sources when combined with existing official statistics can also improve real-time assessments of economic conditions, important for supporting policy decisions Concluding remarks Slide 10 of 10