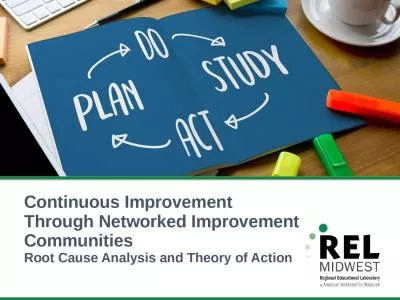
/
School Improvement Planning School Improvement Planning

School Improvement Planning - PowerPoint Presentation

tatiana-dople
tatiana-dople . @tatiana-dople
Follow
348 views
Uploaded On 2018-11-05

School Improvement Planning - PPT Presentation

So That Each Scholar HAS A Voice A Dream A Bright Future Nautilus K8 Team Members Stacy Lucas Principal Andre Koch Assistant Principal Deana Mosby Instructional Coach ID: 715175

students level moved grade level students grade moved 2016 levels student goal percentage standard scholar sba math 2015 staff

Share:

Link:

Embed:

Download Presentation from below link

Download Presentation The PPT/PDF document "School Improvement Planning" is the property of its rightful owner. Permission is granted to download and print the materials on this web site for personal, non-commercial use only, and to display it on your personal computer provided you do not modify the materials and that you retain all copyright notices contained in the materials. By downloading content from our website, you accept the terms of this agreement.


Presentation Transcript

Slide1

School Improvement PlanningSo That…Each Scholar, HASA Voice. A Dream. A Bright FutureSlide2

Nautilus K~8Team Members Stacy Lucas, Principal Andre Koch, Assistant Principal Deana Mosby, Instructional CoachSlide3

Goal Two ~ Whole Child: Thriving, Confident, Responsible IndividualsEvery student scholar will be empowered and prepared to develop personal responsibility in order to be positive, productive members of society.All scholars will increase their participation in at least 95% of classroom instructional time from 55% attending more than 95% in 15-16 to 62% attending more than 95% in 16-17.

Rationale: Only 55% of our student scholars attended class more than 95% of the time. That means that 45% of our student scholars missed more than 8 days a year. We need to create classrooms where student scholars WANT to be at school, and we need to help create a habit in ALL of our student scholars that positive attendance connects to personal responsibility throughout their lives.Slide4
Slide5

Goal Two ~ Whole Child: Thriving, Confident, Responsible IndividualsEvery student scholar will be empowered and prepared to develop personal responsibility in order to be positive, productive members of society.Students and families will increase the percentage participating in student-led conferences at Nautilus from 87% in Spring 16 to 90% attending in Fall 2016 and Spring 2017.

Rationale: In some cases, this is the only time we see families. We want parent/guardian input and we want them to feel like they have a voice in their student scholar’s education. Our student scholars develop presentation skills which will help them be positive, productive members of society.Slide6
Slide7

Goal Two ~ Whole Child: Thriving, Confident, Responsible IndividualsEvery student scholar will be empowered and prepared to develop personal responsibility in order to be positive, productive members of society.95% of scholars will feel Nautilus is safe and welcoming as measured by perception surveys.Rationale: It is important that student scholars feel safe at school. I

mplementing PBIS and providing professional development to staff members around topics such as ACES, empathy, and cultural competency, will help create the welcoming, safe environment that students need.Slide8
Slide9

Goal Four ~ Content-Area Competence: Mastery of all SubjectsEvery student scholar will receive equitable opportunity for success, and will meet or exceed standards of performance in all subjects by the end of each grade.All students in grades 3-8 will increase the percentage of students at standard in Reading, Math and Science by decreasing the percentage of students not at standard by 15% based on the 2016 ELA SBA, Math SBA, and Science MSP baseline score.

Reading:

3rd

: From 55% to 62%

4th

: From 49% to 57

% 5th

: From 57% to 64%

6th

: From 47% to 55

% 7th

: From 56% to

63% 8th

: From 69% to 74%

Math:

3rd

: From 63% to 69%

4th

: From 36% to 46

% 5th

: From 31% to 41%

6th

: From 26% to 37%

7th

: From 44% to 52

% 8th

: From 19% to 31%

Science:

5th

: From 64% to 69%

8th

: From 81% to 84%

Rationale: (Consistency Lens) Our focus needs to be on strong instructional strategies while implementing a guaranteed and viable curriculum.Slide10

Goal Four ~ Content-Area Competence: Mastery of all SubjectsEvery student scholar will receive equitable opportunity for success, and will meet or exceed standards of performance in all subjects by the end of each grade.Students in grades K-3 will increase the percentage of students at standard in Reading and Math by decreasing the percentage of students not at standard by 15% as based on the ELA district assessments (F & P and IRLA) and Math district assessment (STAR

).

Reading:

Kindergarten

2015-2016 from 83% to

First

Grade 2016-2017 86%

(

First Grade November 2016 47% at standard)

First Grade 2015-2016 from 74% to

Second

Grade 2016-2017 78%

(Second

Grade November 2016 36% at standard)

Second Grade 2015-2016 from 86% to

Third

Grade 2016-2017 88

% (

Third Grade November 2016 28% at standard

)

Rationale: (Growth Lens) Our focus needs to be on strong instructional strategies while implementing a guaranteed and viable curriculum.

Math:

First Grade 2015-2016 from 73% to

Second

Grade 2016-2017 77% (Second Grade Fall 2016 46% at standard)

Second Grade 2015-2016 from 56% to

Third

Grade 2016-2017 63% (Third Grade Fall 2016 51% at standard)Slide11

Goal Four ~ Content-Area Competence: Mastery of all SubjectsEvery student scholar will receive equitable opportunity for success, and will meet or exceed standards of performance in all subjects by the end of each grade.Hispanic students in grades 3-8 will increase the percentage of students at standard in Reading and Math by decreasing the percentage of students not at standard by 15% based on the ELA and Math SBA

baseline

scores.

Reading:

3rd

from 43% to

52% 4th

from 30% to

41% 5th

from 33% to

43% 6th

from 50% to

58% 7th

from 25% to

36% 8th

from 67% to 72

%

Math:

3rd

from 54% to 61% 4th from 25% to 36% 5th from 17% to 30% 6th from 17% to 30% 7th from 0% to 15% 8th from 33% to 43%Rationale: (Equity Lens) Our focus needs to be on strong instructional strategies while implementing a guaranteed and viable curriculum.Slide12
Slide13

Current State – From Eye on the GoalSlide14

Current State – From Eye on the GoalSlide15

Goal Two ~ Whole Child: Thriving, Confident, Responsible IndividualsEvery student scholar will be empowered and prepared to develop personal responsibility in order to be positive, productive members of society.

Attendance


Not Chronic

Chronic

Total Students

% Chronic

Nautilus

407

106

513

21%

Asian

42

2

44

5%

Black

39

8

47

17%

Hispanic

115

34

149

23%

Multiple

49

20

69

29%

Nat Am055100%Pacific Is18102836%White1442717116%Slide16

Goal Two ~ Whole Child: Thriving, Confident, Responsible IndividualsEvery student scholar will be empowered and prepared to develop personal responsibility in order to be positive, productive members of society.

Student Led Conferences AttendanceSlide17

Goal Two ~ Whole Child: Thriving, Confident, Responsible IndividualsEvery student scholar will be empowered and prepared to develop personal responsibility in order to be positive, productive members of society.

K-5 Learning Attributes from Report Cards in 2015-2016 School Year

Actively Participates In Learning


1

2

3

4

Hispanic

5%

19%

59%

17%

Nat Am

20%

40%

40%

0%

Asian

2%

12%

54%

32%

Black

0%

27%

58%

15%

Pacific Is

3%

13%

68%

16%White0%16%49%35%Multiple3%11%58%28%All Students2%17%

55%

25%

Completes Work


1

2

3

4

Hispanic

7%

21%

54%

18%

Nat Am

0%

60%

40%

0%

Asian

2%

7%

47%

44%

Black

14%

17%

47%

22%

Pacific Is

6%

23%

45%

26%

White

3%

11%

50%

36%

Multiple

1%

27%

41%

32%

All Students

5%

17%

49%

29%Slide18

Goal Two ~ Whole Child: Thriving, Confident, Responsible IndividualsEvery student scholar will be empowered and prepared to develop personal responsibility in order to be positive, productive members of society.

K-5 Learning Attributes from Report Cards in 2015-2016 School Year

Respects Others


1

2

3

4

Hispanic

1%

11%

51%

37%

Nat Am

0%

0%

100%

0%

Asian

0%

12%

42%

46%

Black

3%

22%

61%

14%

Pacific Is

0%

6%

55%

39%White1%9%50%40%Multiple0%10%51%39%All Students1%11%

51%

37%

Uses Good Organizational Skills


1

2

3

4

Hispanic

2%

23%

63%

11%

Nat Am

0%

60%

40%

0%

Asian

0%

4%

65%

32%

Black

3%

31%

51%

15%

Pacific Is

3%

16%

65%

16%

White

2%

13%

64%

21%

Multiple

0%

29%

56%

15%

All Students

2%

19%

61%

17%Slide19

Goal Two ~ Whole Child: Thriving, Confident, Responsible IndividualsEvery student scholar will be empowered and prepared to develop personal responsibility in order to be positive, productive members of society.

Discipline Dispositions During 2015-2016 School Year


In School Suspension

Short Term Suspension

Solution Room

Hispanic

1

2

33

Nat Am

1

1

0

Asian

2

3

3

Black

2

3

31

Pacific IS

0

0

5

White

0

7

24

Multiple

0

211 In School SuspensionShort Term SuspensionFRE617ELL24SPED

0

7

HCP

0

1Slide20

Goal Four ~ Content-Area Competence: Mastery of all SubjectsEvery student scholar will receive equitable opportunity for success, and will meet or exceed standards of performance in all subjects by the end of each grade.Consistency LensAll students in grades 3-8 will increase the percentage of students at standard in Reading by decreasing the percentage of students not at standard by 15% based on the 2016 ELA SBA baseline score.

SBA ELA Percentage Passing


Spring 2016 Baseline

Target

3rd Grade

55%

62%

4th Grade

49%

57%

5th Grade

57%

64%

6th Grade

47%

55%

7th Grade

56%

63%

8th Grade

69%

74%Slide21

Goal Four ~ Content-Area Competence: Mastery of all SubjectsEvery student scholar will receive equitable opportunity for success, and will meet or exceed standards of performance in all subjects by the end of each grade.Consistency LensAll students in grades 3-8 will increase the percentage of students at standard in Math by decreasing the percentage not at standard by 15% based on the 2016 Math SBA baseline score.

SBA Math Percentage Passing


Spring 2016 Baseline

Target

3rd Grade

63%

69%

4th Grade

36%

46%

5th Grade

31%

41%

6th Grade

26%

37%

7th Grade

44%

52%

8th Grade

19%

31%Slide22

Goal Four ~ Content-Area Competence: Mastery of all SubjectsEvery student scholar will receive equitable opportunity for success, and will meet or exceed standards of performance in all subjects by the end of each grade.Consistency LensAll students in grades 5 and 8 will increase the percentage of students at standard in Science by decreasing the percentage of students not at standard by 15% based on the 2016 Science MSP baseline score.

MSP Science Percentage Passing


Spring 2016 Baseline

Target

5th Grade

64%

69%

8th Grade

81%

84%Slide23

Goal Four ~ Content-Area Competence: Mastery of all SubjectsEvery student scholar will receive equitable opportunity for success, and will meet or exceed standards of performance in all subjects by the end of each grade.Growth LensReading: Students in grades K-3 will increase the percentage of students at standard in Reading by decreasing the percentage of students not at standard by 15% as based on the ELA district assessments (F & P and IRLA).


Spring

2016

Baseline (F&P)

Target (IRLA)

Current State November 2016

Kindergarten to First Grade

83%

86%

47%

First Grade to Second Grade

74%

78%

36%

Second Grade to Third Grade

86%

88%

28%Slide24

Goal Four ~ Content-Area Competence: Mastery of all SubjectsEvery student scholar will receive equitable opportunity for success, and will meet or exceed standards of performance in all subjects by the end of each grade.Growth LensMath: Students in grades K-3 will increase the percentage of students at standard in Math by decreasing the percentage of students not at standard by 15% as based on the Math district assessment (STAR).


Spring 2016 Baseline (STAR)

Target (STAR)

Current State November 2016

First Grade to Second Grade

73%

77%

46%

Second Grade to Third Grade

56%

63%

51%Slide25

Goal Four ~ Content-Area Competence: Mastery of all SubjectsEvery student scholar will receive equitable opportunity for success, and will meet or exceed standards of performance in all subjects by the end of each grade.Equity LensReading: Hispanic students in grades 3-8 will increase the percentage of students at standard in Reading by decreasing the percentage of students not at standard by 15% based on the ELA SBA baseline score.

SBA ELA Percentage Passing Hispanic Students


Spring 2016 Baseline

Target

3rd Grade

43%

52%

4th Grade

30%

41%

5th Grade

33%

43%

6th Grade

50%

58%

7th Grade

25%

36%

8th Grade

67%

72%

Fall 2016 IRLA Scores Hispanic Students

Grade

Not Met

Met

Total

Percent Met

KG

8

8

1650%11331619%224

2

26

8%

3

29

2

31

6%

4

22

1

23

4%

5

20


20

0%

6

8


8

0%

7

7


7

0%

8

3


3

0%

Total

134

16

150

11%Slide26

Goal Four ~ Content-Area Competence: Mastery of all SubjectsEvery student scholar will receive equitable opportunity for success, and will meet or exceed standards of performance in all subjects by the end of each grade.Equity LensMath: Hispanic students in grades 3-8 will increase the percentage of students at standard in Math by decreasing the percentage of students not at standard by 15% based on the Math SBA baseline score.

SBA Math Percentage Passing Hispanic Students


Spring 2016 Baseline

Target

3rd Grade

54%

61%

4th Grade

25%

36%

5th Grade

17%

30%

6th Grade

17%

30%

7th Grade

0%

15%

8th Grade

33%

43%Slide27

Third to Fourth Grade SBA DataELA Moved up 3 levels ~ 0%Moved up 2 levels ~ 0%

Moved up 1 level ~ 12 students 19.4%

No change ~ 36 students 58.1%

Moved down 1 level ~ 13 students 21.0%

Moved down 2 levels ~ 1 student 1.6%

Moved down 3 levels ~ 0%

Net Gain -4.8%


2016 Level

2015 Level

Level 1

Level 2

Level 3

Level 4

Level 1

9

1


Level 2

3

12

7


Level 3


3

5

4

Level 4


1

710Slide28

Third to Fourth Grade SBA DataMathMoved up 3 levels ~ 0%Moved up 2 levels ~ 0%

Moved up 1 level ~ 3 students 4.8%

No change ~ 21 students 33.9%

Moved down 1 level ~ 36 students 58.1%

Moved down 2 levels ~ 2 students 3.2%

Moved down 3 levels ~ 0%

Net Gain -59.7%


2016 Level

2015 Level

Level 1

Level 2

Level 3

Level 4

Level 1

2

2


Level 2

9

3


Level 3

1

19

7

1

Level 4


1

89Slide29

Fourth to Fifth Grade SBA DataELAMoved up 3 levels ~ 0%Moved up 2 levels ~ 6 students 10.7%

Moved up 1 level ~ 22 students 39.3%

No change ~ 25 students 44.6%

Moved down 1 level ~ 3 students 5.4%

Moved down 2 levels ~ 0%

Moved down 3 levels ~ 0%

Net Gain +55.4%


2016 Level

2015 Level

Level 1

Level 2

Level 3

Level 4

Level 1

8

9

5


Level 2

1

4

8

1

Level 3


5

5

Level 4


28Slide30

Fourth to Fifth Grade SBA DataMathMoved up 3 levels ~ 0%Moved up 2 levels ~ 0%

Moved up 1 level ~ 5 students 8.9%

No change ~ 36 students 64.3%

Moved down 1 level ~ 15 students 26.8%

Moved down 2 levels ~ 0%

Moved down 3 levels ~ 0%

Net Gain -17.9%


2016 Level

2015 Level

Level 1

Level 2

Level 3

Level 4

Level 1

11

1


Level 2

10

13

1


Level 3


3

8

3

Level 4


24Slide31

Fifth to Sixth Grade SBA DataELAMoved up 3 levels ~ 0%Moved up 2 levels ~ 0%

Moved up 1 level ~ 5 students 27.8%

No change ~ 10 students 55.6%

Moved down 1 level ~ 3 students 16.7%

Moved down 2 levels ~ 0%

Moved down 3 levels ~ 0%

Net Gain +11.1%


2016 Level

2015 Level

Level 1

Level 2

Level 3

Level 4

Level 1

1

2


Level 2


4

1


Level 3


2

5

2

Level 4


1 Slide32

Fifth to Sixth Grade SBA DataMathMoved up 3 levels ~ 0%Moved up 2 levels ~ 0%

Moved up 1 level ~ 2 students 11.1%

No change ~ 13 students 72.2%

Moved down 1 level ~ 3 students 16.7%

Moved down 2 levels ~ 0%

Moved down 3 levels ~ 0%

Net Gain -5.6%


2016 Level

2015 Level

Level 1

Level 2

Level 3

Level 4

Level 1

4

1


Level 2

3

5

1


Level 3


2


Level 4


 2Slide33

Sixth to Seventh Grade SBA DataELAMoved up 3 levels ~ 0%Moved up 2 levels ~ 0%

Moved up 1 level ~ 5 students 31.3%

No change ~ 10 students 62.5%

Moved down 1 level ~ 1 student 6.3%

Moved down 2 levels ~ 0%

Moved down 3 levels ~ 0%

Net Gain +25.0%


2016 Level

2015 Level

Level 1

Level 2

Level 3

Level 4

Level 1

2

1


Level 2


3

2


Level 3


1

3

2

Level 4


 2Slide34

Sixth to Seventh Grade SBA DataMathMoved up 3 levels ~ 0%Moved up 2 levels ~ 0%

Moved up 1 level ~ 3 students 18.8%

No change ~ 11 students 68.8%

Moved down 1 level ~ 2 students 12.5%

Moved down 2 levels ~ 0%

Moved down 3 levels ~ 0%

Net Gain +6.3%


2016 Level

2015 Level

Level 1

Level 2

Level 3

Level 4

Level 1

2

1


Level 2

1

4


Level 3


1

3

2

Level 4


 2Slide35

Seventh to Eighth Grade SBA DataELAMoved up 3 levels ~ 0%Moved up 2 levels ~ 0%

Moved up 1 level ~ 4 students 23.5%

No change ~ 12 students 70.6%

Moved down 1 level ~ 1 student 5.9%

Moved down 2 levels ~ 0%

Moved down 3 levels ~ 0%

Net Gain +17.6%


2016 Level

2015 Level

Level 1

Level 2

Level 3

Level 4

Level 1

1

1


Level 2

1

3

3


Level 3


6


Level 4


 2Slide36

Seventh to Eighth Grade SBA DataMathMoved up 3 levels ~ 0%Moved up 2 levels ~ 0%

Moved up 1 level ~ 1 student 5.9%

No change ~ 8 students 47.1%

Moved down 1 level ~ 6 students 35.3%

Moved down 2 levels ~ 2 students 11.8%

Moved down 3 levels ~ 0%

Net Gain -52.9%


2016 Level

2015 Level

Level 1

Level 2

Level 3

Level 4

Level 1

5


Level 2

3

1


Level 3

2

3

2

1

Level 4


  Slide37

Goal Two ~ Whole Child: Thriving, Confident, Responsible IndividualsEvery student scholar will be empowered and prepared to develop personal responsibility in order to be positive, productive members of society.Signature Strategies: Ensure opportunities for student-scholar ownership and choice in projects that share students' cultures and personalizes their learning.

Establish partnerships with parents valuing their input, contribution, culture and knowledge through listening and learning sessions.

Increase every student-scholar's social-emotional efficacy through teaching, modeling, and practice social-emotional skills in support of a safe climate.Slide38

Goal Four ~ Content-Area Competence: Mastery of all SubjectsEvery student scholar will receive equitable opportunity for success, and will meet or exceed standards of performance in all subjects by the end of each grade.Signature Strategies:Develop a Multi-Tiered System of Support to ascertain and respond to academic and social-emotional needs of students toward mastery of core subjects.

Utilize classroom-based and district progress monitoring through formative, interim and assumptive assessments to inform and adjust instruction in real time.

Create and implement culturally responsive (

i.e

GLAD/SIOP strategies), standards-aligned, real-world relevant STEM/STEAM and project/problem-based learning opportunities for students to prepare scholars for future careers in STEAM. Slide39

Signature Strategies – From Eye on the GoalSlide40

Professional Development ~ Goal 2Staff will be participate in a book study on equity. Poor Students, Rich Teaching. Mindset for Change by Eric Jensen.Staff will implement strategies from the book into their classrooms, which will be observed through observations and walk-throughs.

Staff will be trained on MTSS for Behavior and Academics with a focus on PBIS

.

Nautilus will move on the implementation matrix to the next level.

Staff

will participate in a book study around empathy and class engagement.

Kids Deserve It!

by Todd

Nesloney

and Adam

Welcome.

Staff will implement strategies from the book into their classrooms, which will be observed through observations and walk-throughs

.

Staff will discuss the importance of student and guardian attendance at SLCs and will become aware of the

efforts

the school is doing to ensure attendance

.

SLC attendance will increase to at least 90% of families attending.Slide41

Professional Development ~ Goal 4Our PBL Leadership team will be trained in Project Based Learning as provided by the Buck Institute and turn key it back to staff. Staff will incorporate at least one PBL experience with their students.Staff will participate in a book study titled

The Book Whisperer- Awakening the Inner Reader in Every Child

by

Donalyn

Miller

.

Staff will gain an understanding of the importance of encouraging reading at students’ independent level. Strategies will be implemented into their classrooms and observed through observations and walk-throughs.

Staff will be trained in how to implement the Independent Reading Level

Assessment.

Staff will be able to use IRLA to assess students, be able to confer with students 1:1, and be able to monitor student growth through School Pace.

Staff will be trained in Number Talks, helping children build mental math and computation strategies

.

Staff will use number talks for students to have a voice during math instruction and to build conceptual understanding.Slide42

Tasks & Milestones – From Eye on the GoalSlide43

Progress Monitoring of PlanGoal 2Monitoring will take place through our administration Monday meetings and through the monthly Lead Team meetings. Data from SLCs, Discipline, Attendance, and Perception Surveys will be used. The data will be analyzed and next steps will be created, if needed.Goal 4

Monitoring will take place through PLCs. Data from IRLA, STAR, Benchmark Assessments, etc. will be used. Staff will use the PLC protocols to analyze the data and create next steps.Slide44

Early Release Days - PlansProfessional Learning CommunitiesData Drives – Be transparent about the dataUpdates from the District Office – Clear CommunicationBenchmark Assessments – Team ScoringCharacteristics of Successful Learners – Common Rubrics

IRLA Support – Guaranteed Viable CurriculumSlide45

Supports from the Central OfficeTraining on Project Based Learning and STEAMTwo portables for the 2017-2018 school year (need more space for classes)Encouragement when things seem hardSlide46

Nautilus K~8Prepare * Inspire * EducateOur vision is to be a high performing school community with a focus on Science, Technology,

E

ngineering,

A

rts, and

M

athematics that prepares all students to compete, lead, and exceed in an ever changing world.


Who We Are


Administrators who provide a safe, supportive, and positive K-8 learning environment. 

Teachers and support staff who dedicate time for professional learning, collaboration, and the development of culturally responsive integrated curriculum. 

Student-scholars who take ownership in their growth through project-based, collaborative learning opportunities. 

Families who are active partners in the shared responsibility of ensuring student success. 

Community partnerships that support student engagement inside and outside the classroom.