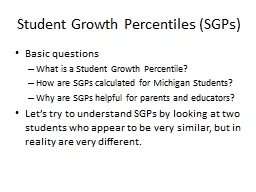
Introduction to Student Growth Percentiles SGPs Basic questions What is a Student Growth Percentile How are SGPs calculated for Michigan Students Why are SGPs helpful for parents and educators ID: 581349
Download Presentation The PPT/PDF document "Student Growth Percentiles" is the property of its rightful owner. Permission is granted to download and print the materials on this web site for personal, non-commercial use only, and to display it on your personal computer provided you do not modify the materials and that you retain all copyright notices contained in the materials. By downloading content from our website, you accept the terms of this agreement.
Slide1
Student Growth Percentiles
Introduction toSlide2
Student Growth Percentiles (SGPs)
Basic questions
What is a Student Growth Percentile?
How are SGPs calculated for Michigan Students?
Why are SGPs helpful for parents and educators?
Let’s try to understand SGPs by looking at two students who appear to be very similar, but in reality are very different.Slide3
Jane
Took the most recent grade 4 reading test
Received a scaled score of 434, which happened to be the state average
I
n the “Proficient” performance level.
How do we interpret this score?
Well, it depends. . .Slide4
John
Also took the most recent grade 4reading test
Also received a scaled score of 434, which (the state average)
Also in the “Proficient” performance level.
How do we interpret this score?
Well, it depends. . .Slide5
MichiganSlide6
One way to better understand
Jane’s score would be to examine
s
tudents who scored the same as
Jane on last year’s reading test.
MichiganSlide7
One way to better understand
Jane’s score would be to examine
s
tudents who scored the same as
Jane on last year’s reading test.
MichiganSlide8
In reality, there are many students
in Michigan who scored the same on
last year’s 3
rd
grade reading test,
but let’s imagine that there were
only 10.
Michigan
MichiganSlide9
301
301
301
301
301
301
301
301
301
301
301
Each of these students scored a 301
on last year’s 3
rd
grade reading test and
now have taken this year’s 4
th
grade
reading test as well.
Michigan
Michigan
MichiganSlide10
375
382
376
390
395
408
430
421
432
448
Let’s order these students by their score on this year’s
reading test.
Michigan
Michigan
Michigan
MichiganSlide11
All these students had the same 3
rd
grade reading score (301).
375
382
376
390
395
408
430
421
432
434
448
But each of them scored differently on the 4
th
grade reading test.
Michigan
Michigan
MichiganSlide12
3
rd
Grade Reading Scale Score = 301
375
382
376
390
395
408
430
421
432
434
448
A
S
tudent
G
rowth Percentile (SGP) of 90 indicates that Jane
scored better on the 4
th
grade reading test than 90% of her
academic peers.
Michigan
Michigan
MichiganSlide13
Let’s go through that same process
for John by identifying the students
in the state who scored the same
as John on last year’s reading test.
MichiganSlide14
Once again, let’s imagine that there
were 10 students with the same
3
rd
grade score.
MichiganSlide15
Each of these students scored a
364
on last year’s 3
rd
grade reading test and
now
have taken this year’s 4
th
grade
reading test as well.
364
364
364
364
364
364
364
364
364
364
364
Michigan
MichiganSlide16
Once again, Let’s order these students by their score on this year’s
reading test.
428
462
448
469
478
484
499
490
501
502
Michigan
Michigan
MichiganSlide17
Last year’s reading score was 364 for all these students.
428
462
448
469
478
484
499
490
501
434
502
But each of them scored differently on the 4
th
grade reading test.
Michigan
Michigan
Michigan
Michigan
MichiganSlide18
Last year’s reading score was 364 for all these students
428
462
448
469
478
484
499
490
501
434
502
A
S
tudent
G
rowth Percentile (SGP) of 10 indicates that John scored better on the 4
th
grade reading test than only 10% of academic peers.
But each of them scored differently on the 4
th
grade reading test.
MichiganSlide19
Even though Jane and John received the exact same score on the 4
th
grade reading test, looking at their SGPs reveals a much more complete picture.
Jane’s SGP of 90 provides evidence that she has gained academic ground compared to peers to get to her reading level.
John’s SGP of 10 tells a different story. John is actually losing ground compared to his academic peers. Slide20
Back to our original questions
What is a Student Growth Percentile?
How are SGPs calculated for Michigan Students?
Why are SGPs helpful for parents and educators?Slide21
What is a Student Growth Percentile?
Student
Growth
P
ercentiles (SGPs) describe a student’s growth compared to other students with similar prior test scores.An SGP of 50 shows average growth, with higher SGPs showing higher than average growth and lower SGPs showing lower than average growth.SGPs are a very useful and powerful way to understand student progress from year to year.Slide22
How are SGPs calculated for Michigan Students?
C
omparing students who began at the same level based on last year’s test
Arranging this year’s scores in order from lowest to highest
Assigning percentile values ranging from 0-99 to each student scoreSlide23
Why are SGPs helpful for parents and educators?
SGPs tell us how a student is progressing relative to other similar students.
This is important to know if the student is learning as much as we expect based on our understanding of similar students.
This gives parents and educators more information and a more complete picture than simply looking at a performance score.