/
Review of USDOT Studies on Specific Cities that Deregulated in the late 70s early 80s Review of USDOT Studies on Specific Cities that Deregulated in the late 70s early 80s

Review of USDOT Studies on Specific Cities that Deregulated in the late 70s early 80s - PowerPoint Presentation

telempsyc
telempsyc . @telempsyc
Follow
342 views
Uploaded On 2020-06-30

Review of USDOT Studies on Specific Cities that Deregulated in the late 70s early 80s - PPT Presentation

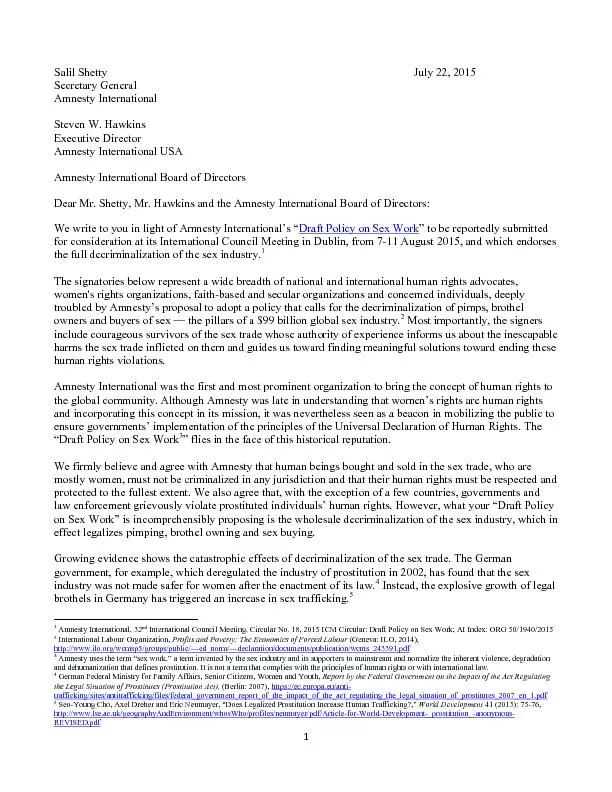
detailed Indianapolis first round of taxicab deregulation happened in the late 1970s After the first winter the independent operators found they had no money to maintain or repair their vehicles Insurance cancellation notices received by the City Controllers office incr ID: 790137

service taxi deregulation taxicab taxi service taxicab deregulation increased city 1979 department report published effort transportation 1981 trips industry

Share:

Link:

Embed:

Download Presentation from below link

Download The PPT/PDF document "Review of USDOT Studies on Specific Citi..." is the property of its rightful owner. Permission is granted to download and print the materials on this web site for personal, non-commercial use only, and to display it on your personal computer provided you do not modify the materials and that you retain all copyright notices contained in the materials. By downloading content from our website, you accept the terms of this agreement.


Presentation Transcript

Slide1

Review of USDOT Studies on Specific Cities that Deregulated in the late 70s early 80s

(detailed)

Slide2

Indianapolis’ first round of taxicab deregulation happened in the late 1970s

“After the first winter the independent operators found they had no money to maintain or repair their vehicles. Insurance cancellation notices received by the City Controller’s office increased from one to two per month to about one hundred fifty per month. Complaints to the City about cab service tripled. . . the cab driver often could not be found . . . service complaints were particularly high in relation to airport taxi business. From the City’s standpoint, enforcement became a major problem . . . added to these difficulties was a reported rise in the amount of crime committed by taxi drivers and operators. In 1977 it was discovered that one firm of 18 cabs was operating a drug ring which was the largest such drug operation ever uncovered in the City. At least one prostitution ring run by a taxicab operator was also uncovered. The reported rapes and robberies committee by taxi drivers also increased.”

This report was published by the U.S. Department of Transportation

in September of 1980

Slide3

Seattle’s taxicab industry was deregulated in 1979

“Average fares for a five mile taxi trip in Seattle rose some 72% . . . through April 1982 . . . the primary innovations have been in the form of discounts offered to repeat, advance reservation and long-haul customers, and higher rates for nighttime service or short trips . . . veteran operations predicted that the new single-cab companies would “skim the cream” off the traditional taxi business, garnering a disproportionate share of long-haul trips to the exclusion of a balanced city wide service delivery. This result has been documented . . . there were 51% more vehicles in May 1981 but each vehicle was only providing about 76% as much service . . . The three large service companies refused 10% of their calls, while independent fleet operators turned down 37% . . . The median vehicle age was four years in mid 1979 and had increased to six years by the close of 1981 . . . suggests that total passenger trips declined by 25% between 1979 and 1981.”

This report was published by the U.S. Department of Transportation

in May of 1983

Slide4

San Diego’s effort with taxicab deregulation in 1979 was probably the most well thought out and documented effort because the USDOT provided a multiyear technical assistance and results documentation grant to help the effort

.

Even so, the results were the same

“The average fare for exclusive ride taxi service in San Diego has risen over 60% . . . for a 5 mile trip [from] July 1979...[to] December 1981 . . . there were 30% more vehicles but each vehicle was providing only 85% as much service per day . . . the primary changes in taxi user profiles observed over three years of Taxicab Passenger Profile Surveys (PPS) include a higher incidence of more affluent, visitor and less frequent taxi trip-makers, a reduction in low-income, resident and young riders and in military personnel . . . City documentation of regulatory costs, still incomplete, suggests that annual regulatory costs have increased by 158%.”

This report was published by the U.S. Department of Transportation in May of 1983

Slide5

Phoenix’s taxicab industry was deregulated at the state level in 1982

“After deregulation, Yellow/Checker increased its fares . . . This represents an increase of 33% for the average four mile trip . . . the lowest [increase in fares] in Phoenix . . . there has been essentially no service innovation . . . taxi patronage has declined since deregulation, in spite of the substantial increase in the number of cabs . . . The number of passenger trips per active taxicab per day had declined by about 33% for the entire industry . . . Consequently, deregulation has had virtually no effect on automobile users and transit dependent travelers.”

This report was published by the U.S. Department of Transportation in April of 1984

Slide6

Conclusion

The mid-1980s saw the end of the USDOT funded reports to study taxicab deregulation. After several diverse attempts at deregulation failed, those individuals promoting this effort turned their attention to other industries. The search for favorable deregulation results had failed in the taxicab industry.

The End