
A Deep Dive Calculating Biodiversity How do we use



Description: A Deep Dive Calculating Biodiversity How do we use data to describe communities? Three main ways: Species richness: The number of species present Evenness: Uniformity of an ecosystem Diversity: Number and relative abundance of species The
Related Topics
Download Presentation
"A Deep Dive Calculating Biodiversity How do we use" is the property of its rightful owner. Permission is granted to download and print the materials on this website for personal, non-commercial use only, and to display it on your personal computer provided you do not modify the materials and that you retain all copyright notices contained in the materials. By downloading content from our website, you accept the terms of this agreement.
Presentation Transcript
slide1. A Deep Dive
Calculating Biodiversity<br>
slide2. How do we use data to describe communities? Three main ways:
Species richness: The number of species present
Evenness: Uniformity of an ecosystem
Diversity: Number and relative abundance of species<br>
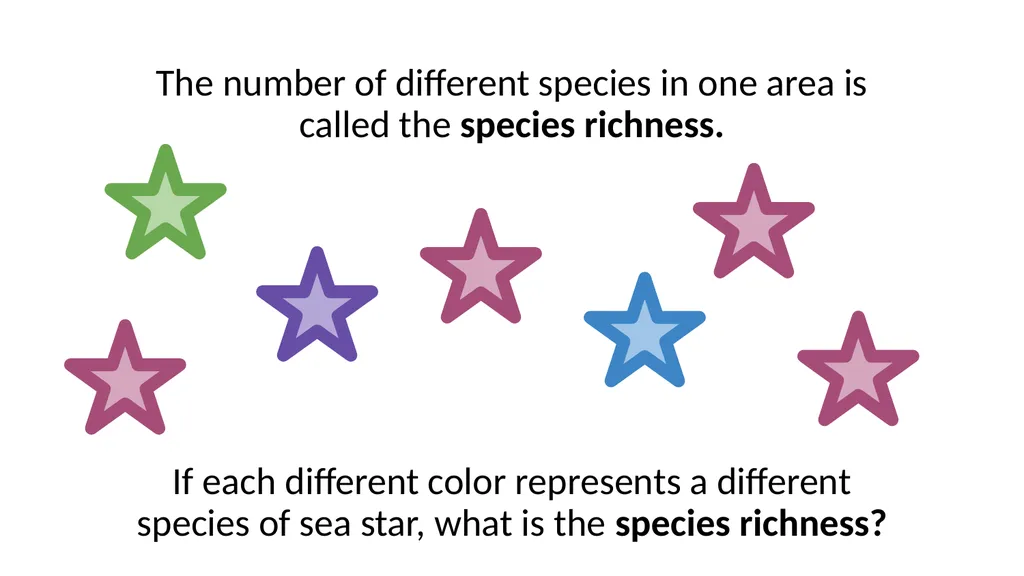
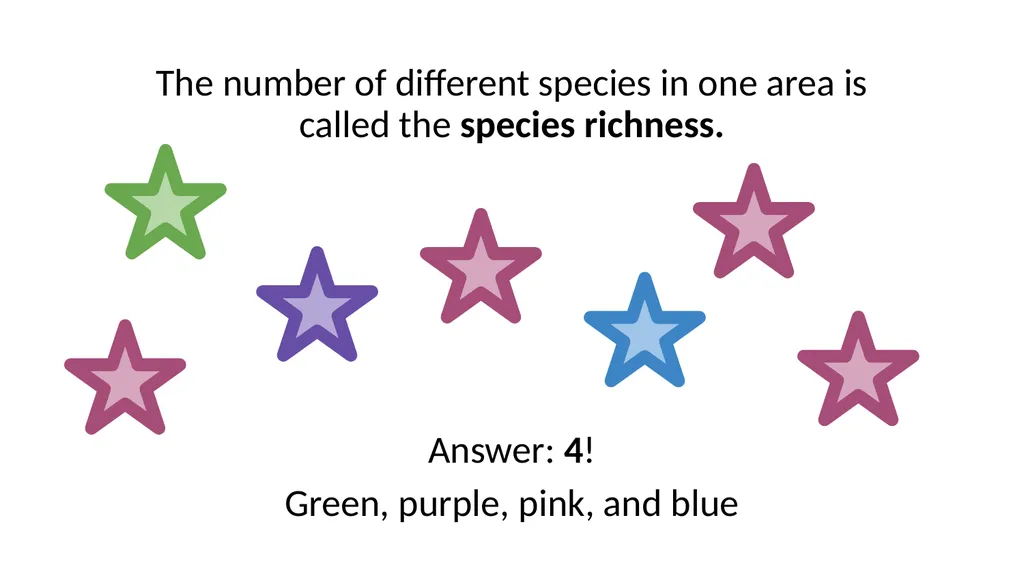
slide3. The number of different species in one area is called the species richness. If each different color represents a different species of sea star, what is the species richness?<br>
slide4. The number of different species in one area is called the species richness. Answer: 4!
Green, purple, pink, and blue<br>
slide5. Species evenness tells you about the relative abundance of different species. If all species are equally abundant, evenness is high. 2 2 2<br>
slide6. Species evenness tells you about the relative abundance of different species. If some species are very abundant and others are rare, evenness is low. 2 8<br>
slide7. Species evenness tells you about the relative abundance of different species. Would you say the evenness is high, medium, or low?<br>
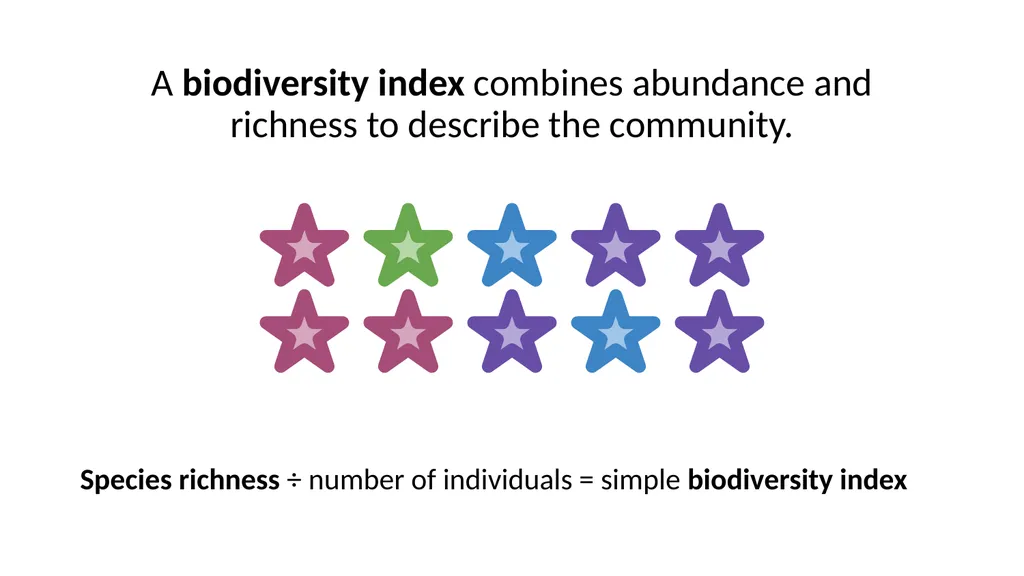
slide8. A biodiversity index combines abundance and richness to describe the community. Species richness ÷ number of individuals = simple biodiversity index<br>
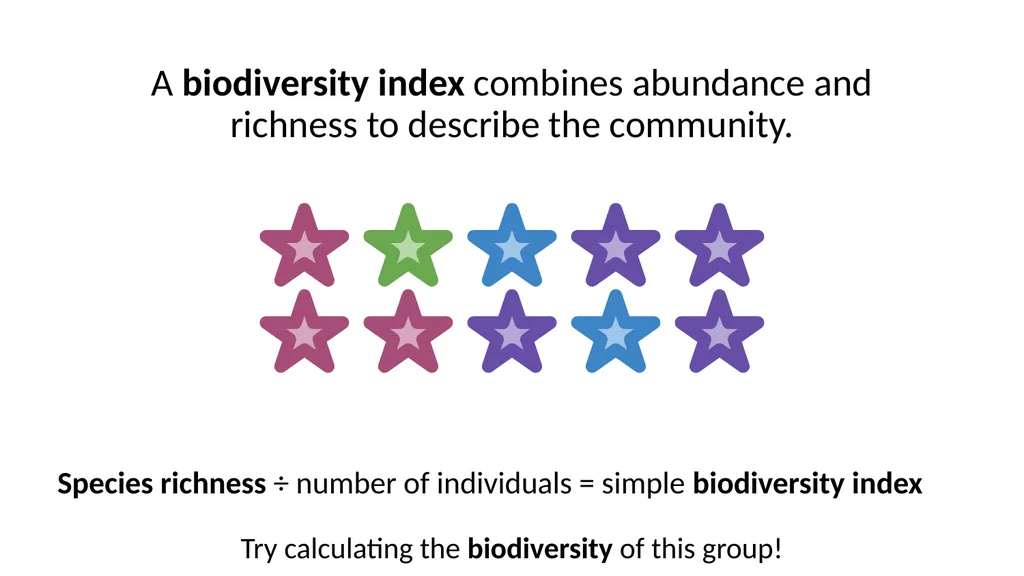
slide9. A biodiversity index combines abundance and richness to describe the community. Species richness ÷ number of individuals = simple biodiversity index
Try calculating the biodiversity of this group!<br>
slide10. A biodiversity index combines abundance and richness to describe the community. Species richness ÷ number of individuals = simple biodiversity index
Answer: 4 ÷ 10 = 0.4 10 individuals 4 species<br>
Calculating Biodiversity<br>
slide2. How do we use data to describe communities? Three main ways:
Species richness: The number of species present
Evenness: Uniformity of an ecosystem
Diversity: Number and relative abundance of species<br>
slide3. The number of different species in one area is called the species richness. If each different color represents a different species of sea star, what is the species richness?<br>
slide4. The number of different species in one area is called the species richness. Answer: 4!
Green, purple, pink, and blue<br>
slide5. Species evenness tells you about the relative abundance of different species. If all species are equally abundant, evenness is high. 2 2 2<br>
slide6. Species evenness tells you about the relative abundance of different species. If some species are very abundant and others are rare, evenness is low. 2 8<br>
slide7. Species evenness tells you about the relative abundance of different species. Would you say the evenness is high, medium, or low?<br>
slide8. A biodiversity index combines abundance and richness to describe the community. Species richness ÷ number of individuals = simple biodiversity index<br>
slide9. A biodiversity index combines abundance and richness to describe the community. Species richness ÷ number of individuals = simple biodiversity index
Try calculating the biodiversity of this group!<br>
slide10. A biodiversity index combines abundance and richness to describe the community. Species richness ÷ number of individuals = simple biodiversity index
Answer: 4 ÷ 10 = 0.4 10 individuals 4 species<br>