
Adapting innovation to our needs a practical
Description: Adapting innovation to our needs a practical approach Raphael Bar-El Innovation as an Instrument for the Promotion of Non-technological Firms Fortaleza, UFC, July 19-20, 2023 Innovation? Wide variety of definitions and of measures (patents,
Related Topics
Download Presentation
"Adapting innovation to our needs a practical" is the property of its rightful owner. Permission is granted to download and print the materials on this website for personal, non-commercial use only, and to display it on your personal computer provided you do not modify the materials and that you retain all copyright notices contained in the materials. By downloading content from our website, you accept the terms of this agreement.
Presentation Transcript
slide1. Adapting innovation to our needs
a practical approach Raphael Bar-El
Innovation as an Instrument for the Promotion of Non-technological Firms
Fortaleza, UFC, July 19-20, 2023<br>
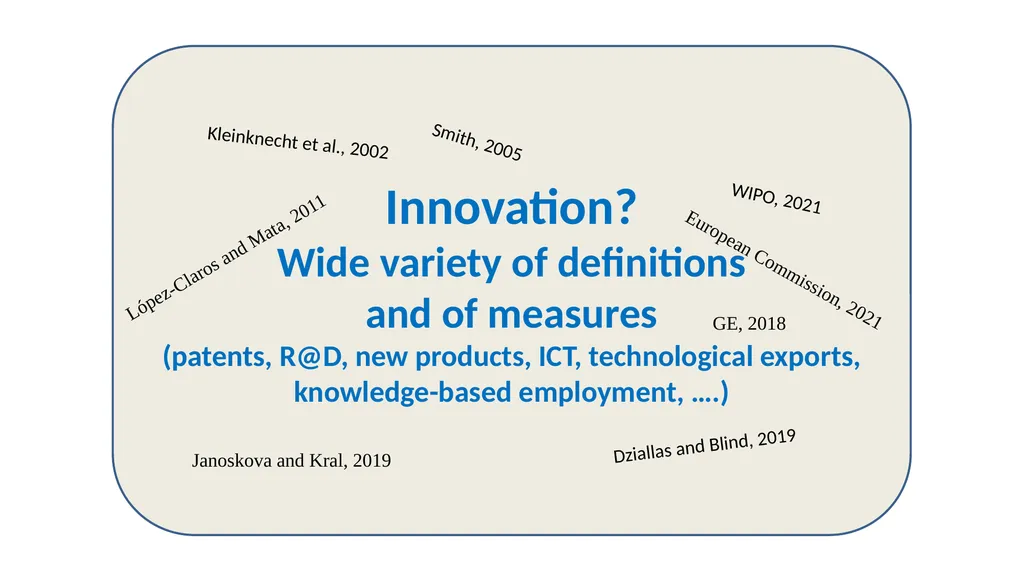
slide2. Innovation?
Wide variety of definitions
and of measures
(patents, R@D, new products, ICT, technological exports, knowledge-based employment, ….) Dziallas and Blind, 2019 Smith, 2005 Kleinknecht et al., 2002 WIPO, 2021 European Commission, 2021 GE, 2018 López-Claros and Mata, 2011 Janoskova and Kral, 2019<br>
slide3. Wrong definition Wrong policy<br>
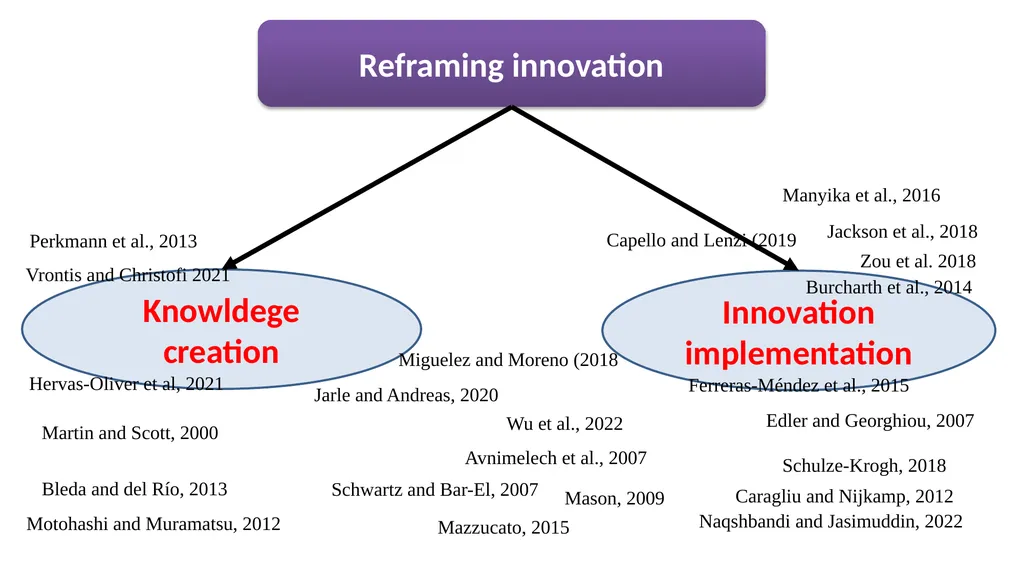
slide4. Reframing innovation Knowldege creation Innovation implementation Mazzucato, 2015 Martin and Scott, 2000 Bleda and del Río, 2013 Schwartz and Bar-El, 2007 Mason, 2009 Avnimelech et al., 2007 Wu et al., 2022 Edler and Georghiou, 2007 Perkmann et al., 2013 Jackson et al., 2018 Motohashi and Muramatsu, 2012 Jarle and Andreas, 2020 Hervas-Oliver et al, 2021 Zou et al. 2018 Schulze-Krogh, 2018 Naqshbandi and Jasimuddin, 2022 Manyika et al., 2016 Caragliu and Nijkamp, 2012 Ferreras-Méndez et al., 2015 Burcharth et al., 2014 Miguelez and Moreno (2018 Vrontis and Christofi 2021 Capello and Lenzi (2019<br>
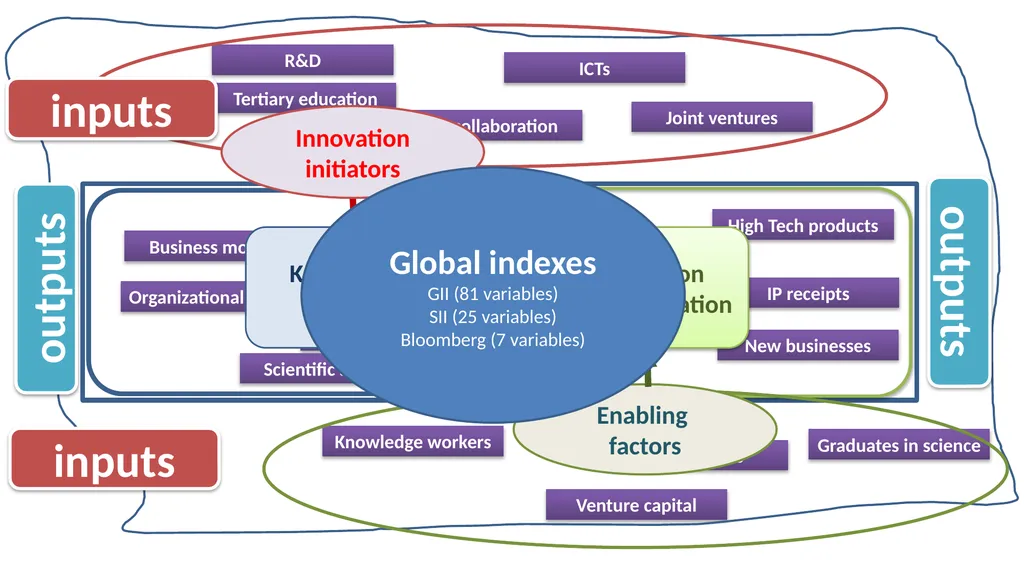
slide5. H-T exports PCTs patents IP receipts Scientific articles ICTs New businesses productivity High Tech products R&D U-I collaboration Knowledge workers Venture capital Graduates in science Business models Organizational models Tertiary education Joint ventures H-T imports outputs outputs Knowledge creation Innovation implementation Innovation initiators inputs inputs Enabling factors Global indexes
GII (81 variables)
SII (25 variables)
Bloomberg (7 variables)<br>
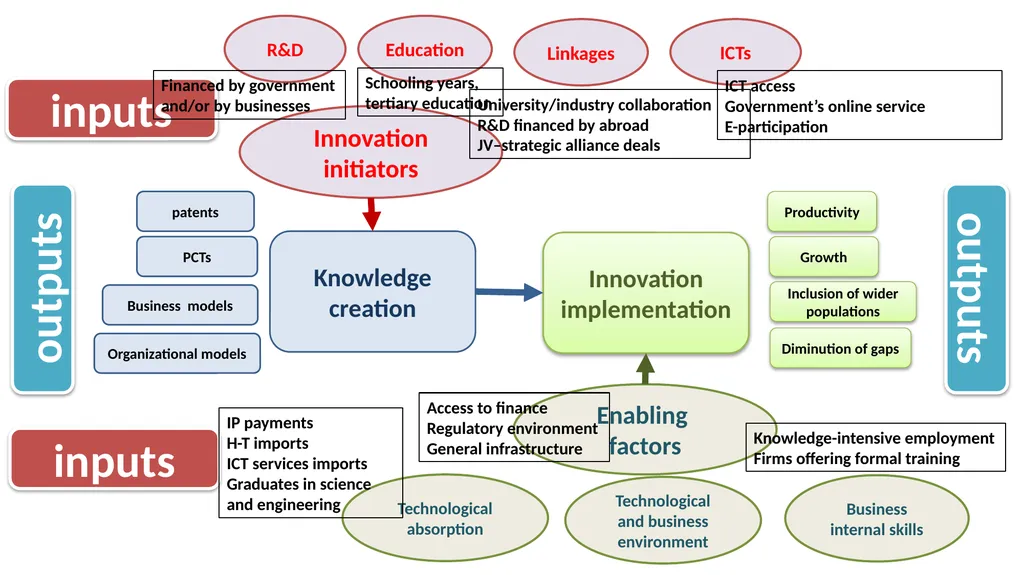
slide6. Knowledge creation Innovation initiators Innovation implementation Enabling factors R&D Education ICTs Linkages Technological absorption Business internal skills Technological and business environment outputs outputs inputs inputs University/industry collaboration
R&D financed by abroad
JV–strategic alliance deals ICT access
Government’s online service
E-participation IP payments
H-T imports
ICT services imports
Graduates in science and engineering Knowledge-intensive employment
Firms offering formal training Access to finance
Regulatory environment
General infrastructure Financed by government and/or by businesses Schooling years, tertiary education Productivity Growth Inclusion of wider populations patents PCTs Business models Organizational models Diminution of gaps<br>
slide7. Table 2: Organizational models creation, as a function of innovation initiators variables: standardized coefficients beta Table 1: Local patents and PCTs, as a function of innovation initiators variables: standardized coefficients beta Technological knowledge creation Non-technological knowledge creation The influence of innovation initiators variables upon: *: p<.05, **: p<.01 *: p<.05, **: p<.01<br>
slide8. The influence of knowledge creation and enabling factors upon local and global innovation implementation Patents have no significant impact upon the local production or exports, they are sold on the global market Non-technological knowledge creation (business model creation) influences the creation of innovative products Major importance of technological absorption capacity of external knowledge for promoting both local and global innovation implementation. A large market facilitates High Tech manufacturing Knowledge services contribute to increasing business activity and to diversified exports<br>
slide9. Knowledge creation Innovation creation Enabling factors Productivity Density H.T. output IP receipts H.T. exports Technological absorption capacity Business internal skills Technological and business environment outputs inputs patents PCTs Business and organizational models Productivity Density H.T. output IP receipts H.T. exports LOCAL GLOBAL<br>
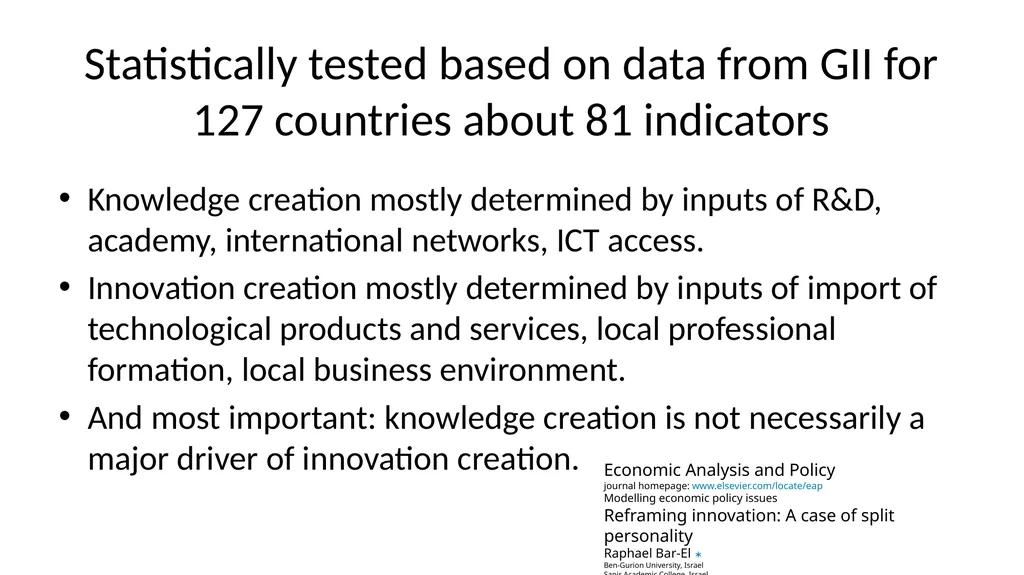
slide10. Statistically tested based on data from GII for 127 countries about 81 indicators Knowledge creation mostly determined by inputs of R&D, academy, international networks, ICT access.
Innovation creation mostly determined by inputs of import of technological products and services, local professional formation, local business environment.
And most important: knowledge creation is not necessarily a major driver of innovation creation. Economic Analysis and Policy
journal homepage: www.elsevier.com/locate/eap
Modelling economic policy issues
Reframing innovation: A case of split personality
Raphael Bar-El ∗
Ben-Gurion University, Israel
Sapir Academic College, Israel<br>
slide11. Therefore: Don’t say innovation, say knowledge creation or innovation implementation.
Knowledge technological innovation leads to global impacts, not necessarily to local business activity.
Technological absorption capacity nurtures local growth as well as technological integration.<br>
slide12. Policy measures to be considered Countries/regions at lower development levels should promote more innovation implementation policies than knowledge creation.
Adoption and adaptation (not only creation) of knowledge is an efficient instrument to be sustained.<br>
slide13. Still to be done: Inclusion of additional variables.
Separate analysis for higher income and lower income regions.
Case studies for specific groups of countries.
In-depth statistical testing (non-linear relationships).<br>
slide14. Appendices<br>
slide16. 6 Knowledge & technology outputs
6.1 Knowledge creation
6.1.1 Patents by origin/bn PPP$ GDP
6.1.2 PCT international patent app./bn PPP$ GDP
6.1.3 Utility model by origin/bn PPP$ GDP
6.1.4 Scientific & technical articles/bn PPP$ GDP
6.1.5 Citable documents H index
6.2 Knowledge impact
6.2.1 Growth rate of PPP$ GDP/worker, %
6.2.2 New businesses/th pop. 15–64
6.2.3 Computer software spending, % GDP
6.2.4 ISO 9001 quality certificates/bn PPP$ GDP
6.2.5 High- & medium-high-tech manufactures, %
6.3 Knowledge diffusion
6.3.1 Intellectual property receipts, % total trade
6.3.2 High-tech exports less re-exports, % total trade
6.3.3 ICT services exports, % total trade
6.3.4 FDI net outflows, % GDP 7 Creative outputs
7.1 Intangible assets
7.1.1 Trademarks by origin/bn PPP$ GDP
7.1.2 Industrial designs by origin/bn PPP$ GDP
7.1.3 ICTs & business model creation†
7.1.4 ICTs & organizational model creation†
7.2 Creative goods & services
7.2.1 Cultural & creative services exports, % total trade
7.2.2 National feature films/mn pop. 15–69
7.2.3 Global ent. & media market/th pop. 15–69
7.2.4 Printing & publishing manufactures, %
7.2.5 Creative goods exports, % total trade
7.3 Online creativity
7.3.1 Generic top-level domains (TLDs)/th pop. 15–69
7.3.2 Country-code TLDs/th pop. 15–69
7.3.3 Wikipedia edits/pop. 15–69
7.3.4 Video uploads on YouTube/pop. 15–69 outputs 16 GII classification<br>
slide17. 1 Institutions
1.1 Political environment
1.1.1 Political stability and safety*.
1.1.2 Government effectiveness*
1.2 Regulatory environment
1.2.1 Regulatory quality*
1.2.2 Rule of law*
1.2.3 Cost of redundancy dismissal, salary weeks
1.3 Business environment
1.3.1 Ease of starting a business*
1.3.2 Ease of resolving insolvency*
1.3.3 Ease of paying taxes*
2 Human capital & research
2.1 Education
2.1.1 Expenditure on education, % GDP
2.1.2 Gov’t expenditure/pupil, secondary, % GDP/cap
2.1.3 School life expectancy, years
2.1.4 PISA scales in reading, maths, & science
2.1.5 Pupil-teacher ratio, secondary 2.2 Tertiary education
2.2.1 Tertiary enrolment, % gross
2.2.2 Graduates in science & engineering, %
2.2.3 Tertiary inbound mobility, %
2.3 Research & development (R&D)..
2.3.1 Researchers, FTE/mn pop.
2.3.2 Gross expenditure on R&D, % GDP
2.3.3 Global R&D companies, avg. expend. Top 3, mn $US
2.3.4 QS university ranking, average score top 3*
3 Infrastructure
3.1 Information & communication technologies (ICTs)
3.1.1 ICT access*
3.1.2 ICT use*
3.1.3 Government’s online service*
3.1.4 E-participation*....
3.2 General infrastructure
3.2.1 Electricity output, kWh/cap
3.2.2 Logistics performance*
3.2.3 Gross capital formation, % GDP
3.3 Ecological sustainability
3.3.1 GDP/unit of energy use
3.3.2 Environmental performance*...
3.3.3 ISO 14001 environmental certificates/bn PPP$ GDP inputs 17 GII classification<br>
slide18. 4 Market sophistication
4.1 Credit
4.1.1 Ease of getting credit*
4.1.2 Domestic credit to private sector, % GDP
4.1.3 Microfinance gross loans, % GDP
4.2 Investment
4.2.1 Ease of protecting investors*
4.2.2 Market capitalization, % GDP
4.2.3 Venture capital deals/bn PPP$ GDP
4.3 Trade, competition and market scale
4.3.1 Applied tariff rate, weighted mean, %
4.3.2 Intensity of local competition
4.3.3 Domestic market scale, bn PPP$ 5 Business sophistication
5.1 Knowledge workers
5.1.1 Knowledge-intensive employment, %
5.1.2 Firms offering formal training, % firms
5.1.3 GERD performed by business, % of GDP
5.1.4 GERD financed by business, %
5.1.5 Females employed w/advanced degrees, % total
5.2 Innovation linkages
5.2.1 University/industry research collaboration†
5.2.2 State of cluster development†
5.2.3 GERD financed by abroad, %
5.2.4 JV–strategic alliance deals/tr PPP$ GDP
5.2.5 Patent families 2+ offices/bn PPP$ GDP
5.3 Knowledge absorption
5.3.1 Intellectual property payments, % total trade
5.3.2 High-tech imports less re-imports, % total trade
5.3.3 ICT services imports, % total trade
5.3.4 FDI net inflows, % GDP
5.3.5 Research talent, % in business enterprises inputs 18 GII classification<br>
slide19. Simple R between inputs and outputs, GII 2017<br>
slide20. Political environment Regulatory environment Business environment Education Tertiary education R&D ICTs Credit Investment Knowledge absorption Innovation linkages Trade & competition Knowledge workers General infrastructure Ecological sustainability Knowledge creation Knowledge impact Intangible assets Online creativity Knowledge diffusion Institutions Business sophistication Market sophistication Infrastructure Human capital and research 20 International patents patents GERD by business Tertiary enrolment U-I collaboration IP payments VC deals M & H tech manufacture GERD Cluster development Graduates in S & E HT exports Global R&D companies Capital formation Ease of getting credit IP receipts Local competition Business model Regulatory quality ICT use organizational model Creative services exports Knowledge intensive employment Pupil-teacher ratio Country code TLDs ICT imports Generic TLDs Creative goods exports Domestic market scale Logistics performance Creative goods and services Regression results<br>
slide21. Insights for Ceara Regional development:
Support “interior”, not metropolis (against WB suggestions)
Agricultural technology
Rural industrialization
Urban regional reorganization (local towns and cities)
Integration into the innovation process
Strengthening the ecosystem (industry-academy-government collaboration)
Support to technological advance in SMEs
Promoting local ecosystems in the interior (periphery)<br>
slide22. Insights for Israeli periphery Startups: only specific types and under specific conditions
Methodology: Optimizing occupation levels
Adaptation of the local population, but not sufficient adaptation of the local economy.
Implications on commuting and internal migration<br>
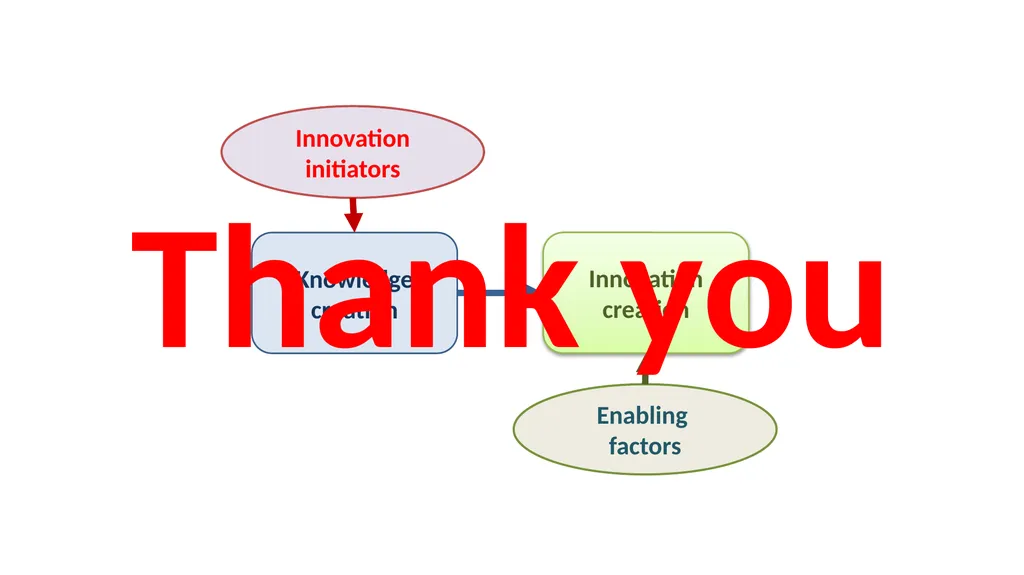
slide23. Thank you<br>
Innovation as an Instrument for the Promotion of Non-technological Firms
Fortaleza, UFC, July 19-20, 2023<br>
slide2. Innovation?
Wide variety of definitions
and of measures
(patents, R@D, new products, ICT, technological exports, knowledge-based employment, ….) Dziallas and Blind, 2019 Smith, 2005 Kleinknecht et al., 2002 WIPO, 2021 European Commission, 2021 GE, 2018 López-Claros and Mata, 2011 Janoskova and Kral, 2019<br>
slide3. Wrong definition Wrong policy<br>
slide4. Reframing innovation Knowldege creation Innovation implementation Mazzucato, 2015 Martin and Scott, 2000 Bleda and del Río, 2013 Schwartz and Bar-El, 2007 Mason, 2009 Avnimelech et al., 2007 Wu et al., 2022 Edler and Georghiou, 2007 Perkmann et al., 2013 Jackson et al., 2018 Motohashi and Muramatsu, 2012 Jarle and Andreas, 2020 Hervas-Oliver et al, 2021 Zou et al. 2018 Schulze-Krogh, 2018 Naqshbandi and Jasimuddin, 2022 Manyika et al., 2016 Caragliu and Nijkamp, 2012 Ferreras-Méndez et al., 2015 Burcharth et al., 2014 Miguelez and Moreno (2018 Vrontis and Christofi 2021 Capello and Lenzi (2019<br>
slide5. H-T exports PCTs patents IP receipts Scientific articles ICTs New businesses productivity High Tech products R&D U-I collaboration Knowledge workers Venture capital Graduates in science Business models Organizational models Tertiary education Joint ventures H-T imports outputs outputs Knowledge creation Innovation implementation Innovation initiators inputs inputs Enabling factors Global indexes
GII (81 variables)
SII (25 variables)
Bloomberg (7 variables)<br>
slide6. Knowledge creation Innovation initiators Innovation implementation Enabling factors R&D Education ICTs Linkages Technological absorption Business internal skills Technological and business environment outputs outputs inputs inputs University/industry collaboration
R&D financed by abroad
JV–strategic alliance deals ICT access
Government’s online service
E-participation IP payments
H-T imports
ICT services imports
Graduates in science and engineering Knowledge-intensive employment
Firms offering formal training Access to finance
Regulatory environment
General infrastructure Financed by government and/or by businesses Schooling years, tertiary education Productivity Growth Inclusion of wider populations patents PCTs Business models Organizational models Diminution of gaps<br>
slide7. Table 2: Organizational models creation, as a function of innovation initiators variables: standardized coefficients beta Table 1: Local patents and PCTs, as a function of innovation initiators variables: standardized coefficients beta Technological knowledge creation Non-technological knowledge creation The influence of innovation initiators variables upon: *: p<.05, **: p<.01 *: p<.05, **: p<.01<br>
slide8. The influence of knowledge creation and enabling factors upon local and global innovation implementation Patents have no significant impact upon the local production or exports, they are sold on the global market Non-technological knowledge creation (business model creation) influences the creation of innovative products Major importance of technological absorption capacity of external knowledge for promoting both local and global innovation implementation. A large market facilitates High Tech manufacturing Knowledge services contribute to increasing business activity and to diversified exports<br>
slide9. Knowledge creation Innovation creation Enabling factors Productivity Density H.T. output IP receipts H.T. exports Technological absorption capacity Business internal skills Technological and business environment outputs inputs patents PCTs Business and organizational models Productivity Density H.T. output IP receipts H.T. exports LOCAL GLOBAL<br>
slide10. Statistically tested based on data from GII for 127 countries about 81 indicators Knowledge creation mostly determined by inputs of R&D, academy, international networks, ICT access.
Innovation creation mostly determined by inputs of import of technological products and services, local professional formation, local business environment.
And most important: knowledge creation is not necessarily a major driver of innovation creation. Economic Analysis and Policy
journal homepage: www.elsevier.com/locate/eap
Modelling economic policy issues
Reframing innovation: A case of split personality
Raphael Bar-El ∗
Ben-Gurion University, Israel
Sapir Academic College, Israel<br>
slide11. Therefore: Don’t say innovation, say knowledge creation or innovation implementation.
Knowledge technological innovation leads to global impacts, not necessarily to local business activity.
Technological absorption capacity nurtures local growth as well as technological integration.<br>
slide12. Policy measures to be considered Countries/regions at lower development levels should promote more innovation implementation policies than knowledge creation.
Adoption and adaptation (not only creation) of knowledge is an efficient instrument to be sustained.<br>
slide13. Still to be done: Inclusion of additional variables.
Separate analysis for higher income and lower income regions.
Case studies for specific groups of countries.
In-depth statistical testing (non-linear relationships).<br>
slide14. Appendices<br>
slide16. 6 Knowledge & technology outputs
6.1 Knowledge creation
6.1.1 Patents by origin/bn PPP$ GDP
6.1.2 PCT international patent app./bn PPP$ GDP
6.1.3 Utility model by origin/bn PPP$ GDP
6.1.4 Scientific & technical articles/bn PPP$ GDP
6.1.5 Citable documents H index
6.2 Knowledge impact
6.2.1 Growth rate of PPP$ GDP/worker, %
6.2.2 New businesses/th pop. 15–64
6.2.3 Computer software spending, % GDP
6.2.4 ISO 9001 quality certificates/bn PPP$ GDP
6.2.5 High- & medium-high-tech manufactures, %
6.3 Knowledge diffusion
6.3.1 Intellectual property receipts, % total trade
6.3.2 High-tech exports less re-exports, % total trade
6.3.3 ICT services exports, % total trade
6.3.4 FDI net outflows, % GDP 7 Creative outputs
7.1 Intangible assets
7.1.1 Trademarks by origin/bn PPP$ GDP
7.1.2 Industrial designs by origin/bn PPP$ GDP
7.1.3 ICTs & business model creation†
7.1.4 ICTs & organizational model creation†
7.2 Creative goods & services
7.2.1 Cultural & creative services exports, % total trade
7.2.2 National feature films/mn pop. 15–69
7.2.3 Global ent. & media market/th pop. 15–69
7.2.4 Printing & publishing manufactures, %
7.2.5 Creative goods exports, % total trade
7.3 Online creativity
7.3.1 Generic top-level domains (TLDs)/th pop. 15–69
7.3.2 Country-code TLDs/th pop. 15–69
7.3.3 Wikipedia edits/pop. 15–69
7.3.4 Video uploads on YouTube/pop. 15–69 outputs 16 GII classification<br>
slide17. 1 Institutions
1.1 Political environment
1.1.1 Political stability and safety*.
1.1.2 Government effectiveness*
1.2 Regulatory environment
1.2.1 Regulatory quality*
1.2.2 Rule of law*
1.2.3 Cost of redundancy dismissal, salary weeks
1.3 Business environment
1.3.1 Ease of starting a business*
1.3.2 Ease of resolving insolvency*
1.3.3 Ease of paying taxes*
2 Human capital & research
2.1 Education
2.1.1 Expenditure on education, % GDP
2.1.2 Gov’t expenditure/pupil, secondary, % GDP/cap
2.1.3 School life expectancy, years
2.1.4 PISA scales in reading, maths, & science
2.1.5 Pupil-teacher ratio, secondary 2.2 Tertiary education
2.2.1 Tertiary enrolment, % gross
2.2.2 Graduates in science & engineering, %
2.2.3 Tertiary inbound mobility, %
2.3 Research & development (R&D)..
2.3.1 Researchers, FTE/mn pop.
2.3.2 Gross expenditure on R&D, % GDP
2.3.3 Global R&D companies, avg. expend. Top 3, mn $US
2.3.4 QS university ranking, average score top 3*
3 Infrastructure
3.1 Information & communication technologies (ICTs)
3.1.1 ICT access*
3.1.2 ICT use*
3.1.3 Government’s online service*
3.1.4 E-participation*....
3.2 General infrastructure
3.2.1 Electricity output, kWh/cap
3.2.2 Logistics performance*
3.2.3 Gross capital formation, % GDP
3.3 Ecological sustainability
3.3.1 GDP/unit of energy use
3.3.2 Environmental performance*...
3.3.3 ISO 14001 environmental certificates/bn PPP$ GDP inputs 17 GII classification<br>
slide18. 4 Market sophistication
4.1 Credit
4.1.1 Ease of getting credit*
4.1.2 Domestic credit to private sector, % GDP
4.1.3 Microfinance gross loans, % GDP
4.2 Investment
4.2.1 Ease of protecting investors*
4.2.2 Market capitalization, % GDP
4.2.3 Venture capital deals/bn PPP$ GDP
4.3 Trade, competition and market scale
4.3.1 Applied tariff rate, weighted mean, %
4.3.2 Intensity of local competition
4.3.3 Domestic market scale, bn PPP$ 5 Business sophistication
5.1 Knowledge workers
5.1.1 Knowledge-intensive employment, %
5.1.2 Firms offering formal training, % firms
5.1.3 GERD performed by business, % of GDP
5.1.4 GERD financed by business, %
5.1.5 Females employed w/advanced degrees, % total
5.2 Innovation linkages
5.2.1 University/industry research collaboration†
5.2.2 State of cluster development†
5.2.3 GERD financed by abroad, %
5.2.4 JV–strategic alliance deals/tr PPP$ GDP
5.2.5 Patent families 2+ offices/bn PPP$ GDP
5.3 Knowledge absorption
5.3.1 Intellectual property payments, % total trade
5.3.2 High-tech imports less re-imports, % total trade
5.3.3 ICT services imports, % total trade
5.3.4 FDI net inflows, % GDP
5.3.5 Research talent, % in business enterprises inputs 18 GII classification<br>
slide19. Simple R between inputs and outputs, GII 2017<br>
slide20. Political environment Regulatory environment Business environment Education Tertiary education R&D ICTs Credit Investment Knowledge absorption Innovation linkages Trade & competition Knowledge workers General infrastructure Ecological sustainability Knowledge creation Knowledge impact Intangible assets Online creativity Knowledge diffusion Institutions Business sophistication Market sophistication Infrastructure Human capital and research 20 International patents patents GERD by business Tertiary enrolment U-I collaboration IP payments VC deals M & H tech manufacture GERD Cluster development Graduates in S & E HT exports Global R&D companies Capital formation Ease of getting credit IP receipts Local competition Business model Regulatory quality ICT use organizational model Creative services exports Knowledge intensive employment Pupil-teacher ratio Country code TLDs ICT imports Generic TLDs Creative goods exports Domestic market scale Logistics performance Creative goods and services Regression results<br>
slide21. Insights for Ceara Regional development:
Support “interior”, not metropolis (against WB suggestions)
Agricultural technology
Rural industrialization
Urban regional reorganization (local towns and cities)
Integration into the innovation process
Strengthening the ecosystem (industry-academy-government collaboration)
Support to technological advance in SMEs
Promoting local ecosystems in the interior (periphery)<br>
slide22. Insights for Israeli periphery Startups: only specific types and under specific conditions
Methodology: Optimizing occupation levels
Adaptation of the local population, but not sufficient adaptation of the local economy.
Implications on commuting and internal migration<br>
slide23. Thank you<br>