04
Listen to a news video on Joy Milne�CBSN - Smelling Parkinson’s Disease� News clip about Joy Milne Parkinson’s Disease��https://vimeo.com/282592213<br>
05
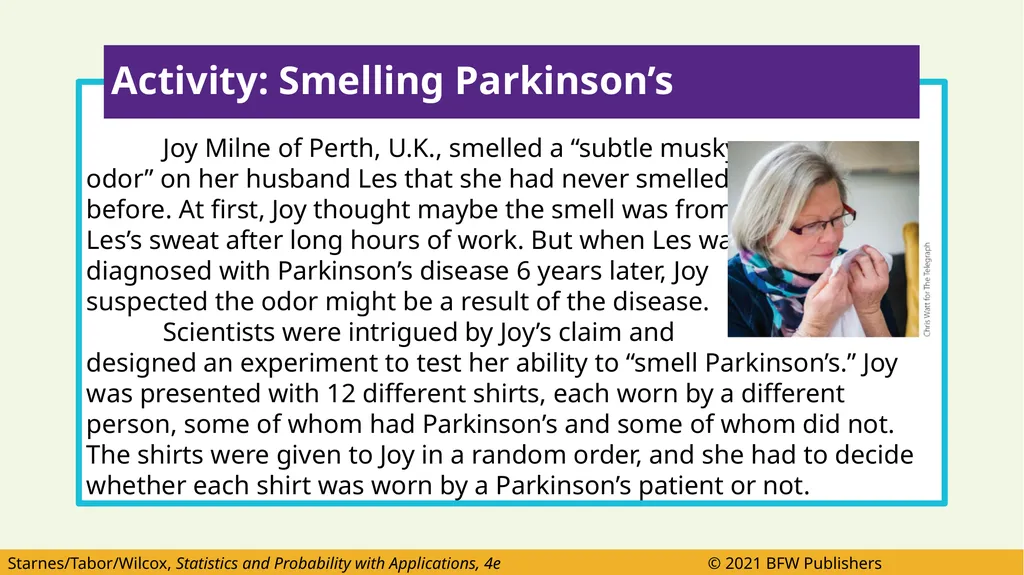
Joy Milne of Perth, U.K., smelled a “subtle musky
odor” on her husband Les that she had never smelled
before. At first, Joy thought maybe the smell was from
Les’s sweat after long hours of work. But when Les was
diagnosed with Parkinson’s disease 6 years later, Joy
suspected the odor might be a result of the disease.
Scientists were intrigued by Joy’s claim and
designed an experiment to test her ability to “smell Parkinson’s.” Joy was presented with 12 different shirts, each worn by a different person, some of whom had Parkinson’s and some of whom did not. The shirts were given to Joy in a random order, and she had to decide whether each shirt was worn by a Parkinson’s patient or not. Activity: Smelling Parkinson’s<br>
06
Although the researchers wanted to believe that Joy could detect Parkinson’s by smell, it is possible that she was just guessing which shirt was which.
Answer Question #1 on the worksheet. Answer in complete sentence.
Take a moment to reflect on what YOU would consider strong evidence to suggest that Joy really can “smell Parkinson’s” if you were a researcher.
How many of the 12 t-shirts would Joy have to correctly identify as being worn by a Parkinson’s patient or not to convince you that she can “smell Parkinson’s?” Write down this value.
Answer Question #2 on the worksheet. Answer in complete sentence. Activity: Smelling Parkinson’s<br>
07
Joy identified 11 of the 12 shirts correctly.
You and your classmates will perform a simulation to determine which explanation is more believable:
Joy is just guessing OR Joy can smell Parkinson’s Activity: Smelling Parkinson’s<br>
08
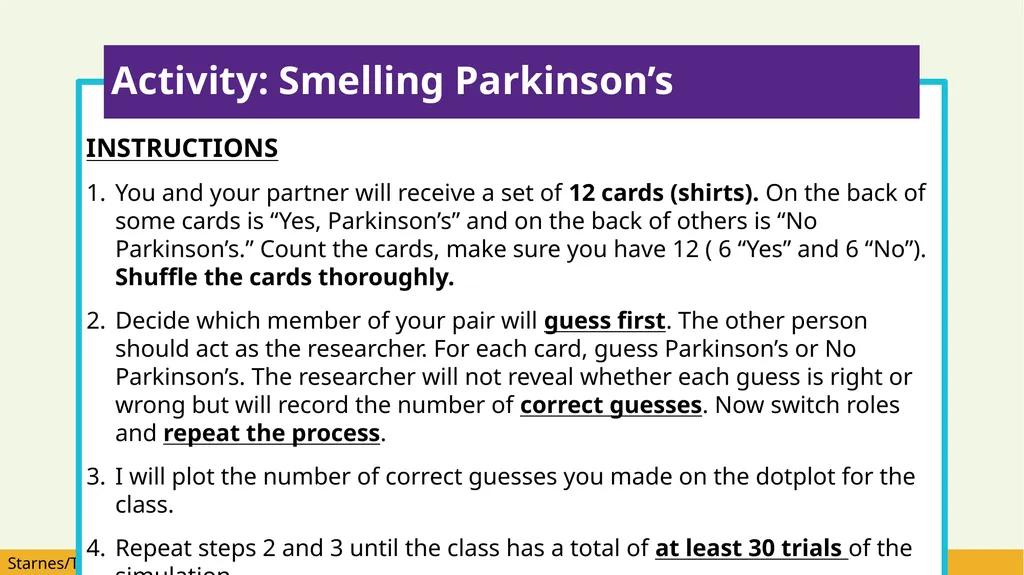
INSTRUCTIONS
You and your partner will receive a set of 12 cards (shirts). On the back of some cards is “Yes, Parkinson’s” and on the back of others is “No Parkinson’s.” Count the cards, make sure you have 12 ( 6 “Yes” and 6 “No”). Shuffle the cards thoroughly.
Decide which member of your pair will guess first. The other person should act as the researcher. For each card, guess Parkinson’s or No Parkinson’s. The researcher will not reveal whether each guess is right or wrong but will record the number of correct guesses. Now switch roles and repeat the process.
I will plot the number of correct guesses you made on the dotplot for the class.
Repeat steps 2 and 3 until the class has a total of at least 30 trials of the simulation. Activity: Smelling Parkinson’s<br>
09
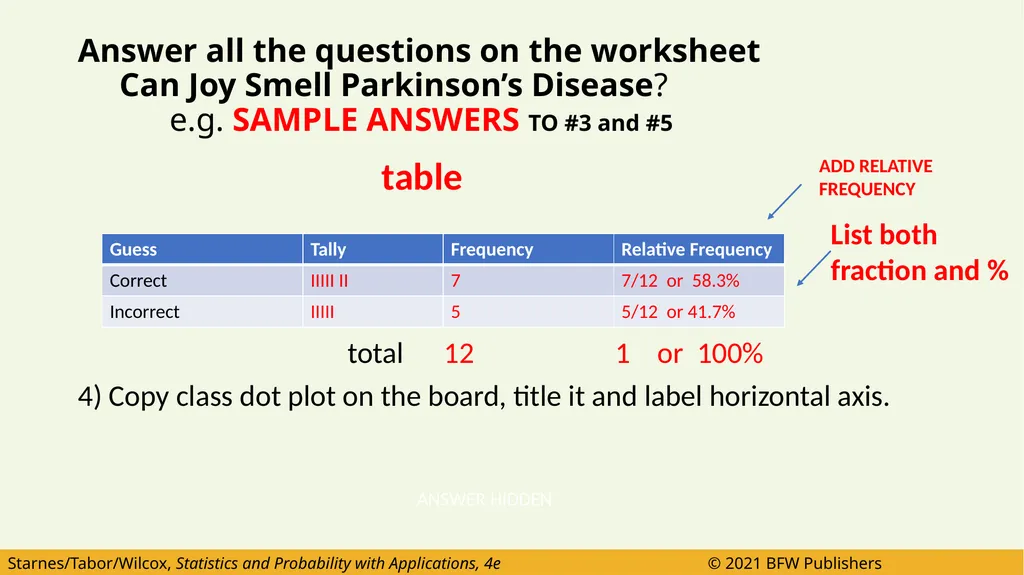
Answer all the questions on the worksheet� Can Joy Smell Parkinson’s Disease? � e.g. SAMPLE ANSWERS TO #3 and #5 List both fraction and % ANSWER HIDDEN table
total 12 1 or 100%
4) Copy class dot plot on the board, title it and label horizontal axis. ADD RELATIVE FREQUENCY<br>
10
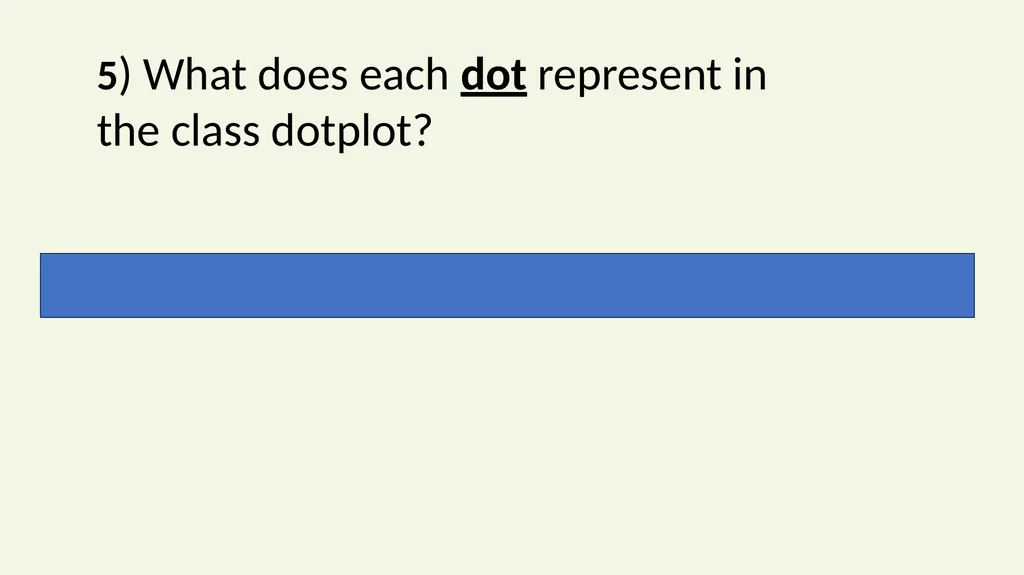
5) What does each dot represent in the class dotplot? The number of correct guesses from one simulation of the experiment<br>
11
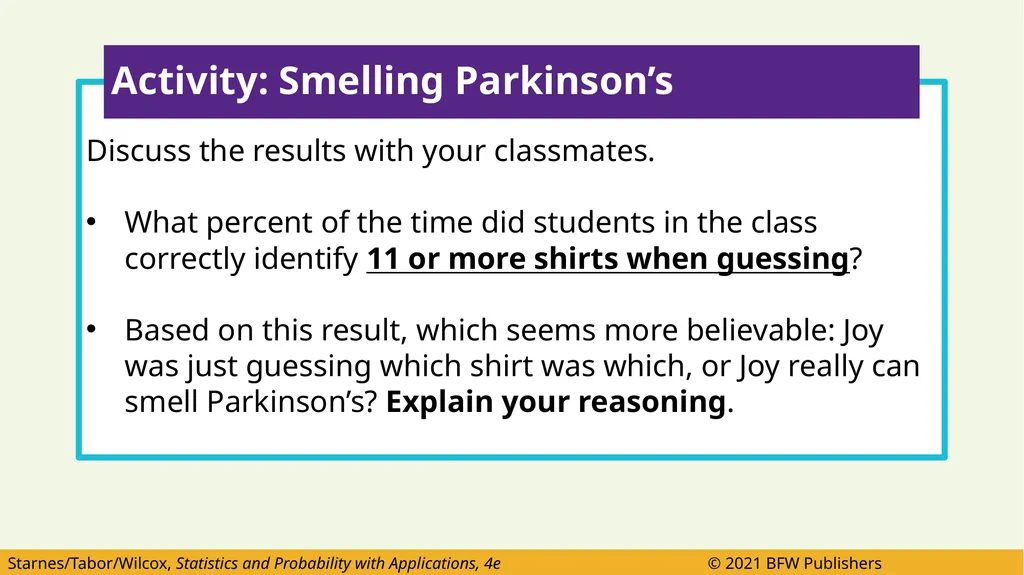
Discuss the results with your classmates.
What percent of the time did students in the class correctly identify 11 or more shirts when guessing?
Based on this result, which seems more believable: Joy was just guessing which shirt was which, or Joy really can smell Parkinson’s? Explain your reasoning. Activity: Smelling Parkinson’s<br>
12
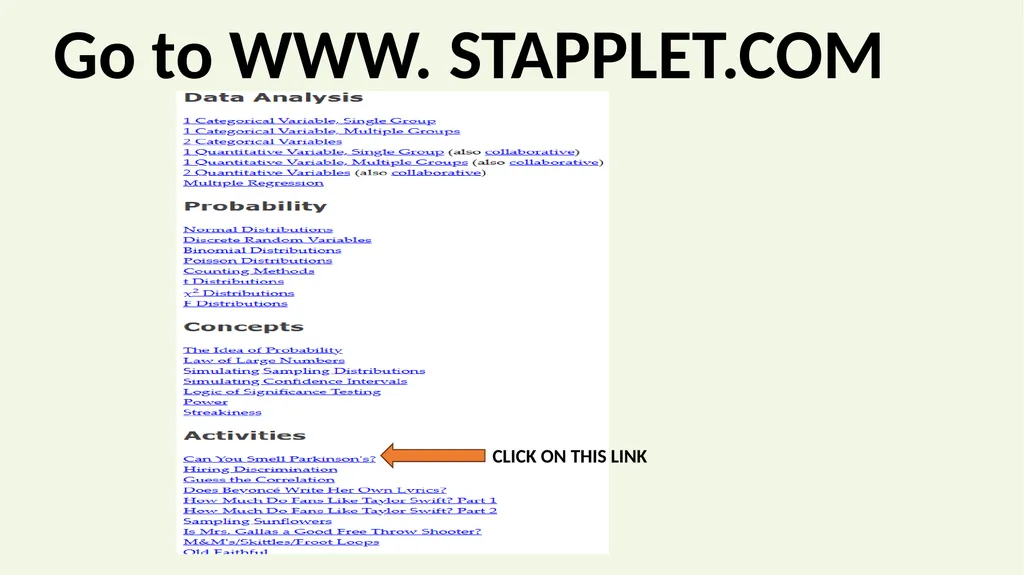
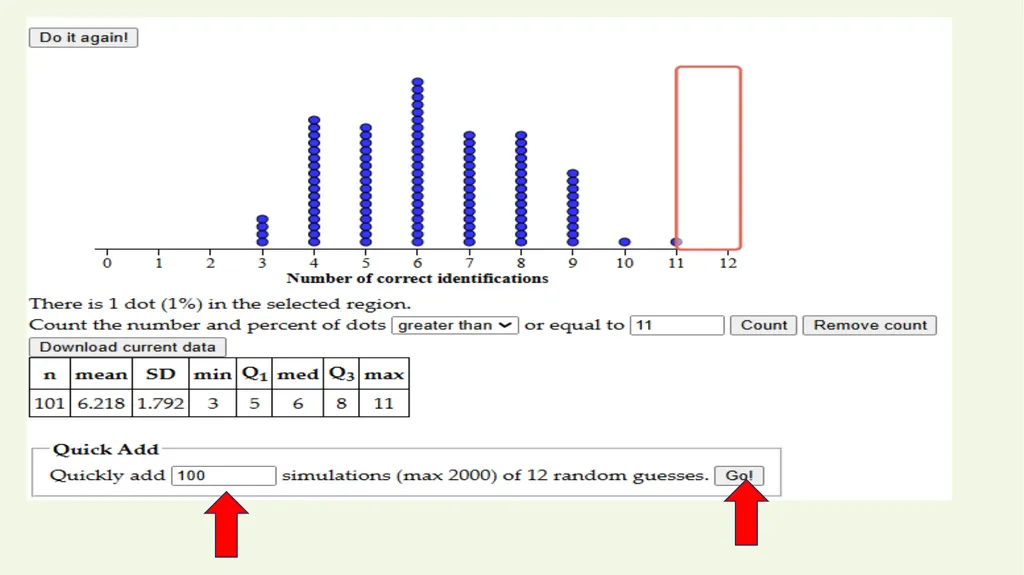
Go to WWW. STAPPLET.COM CLICK ON THIS LINK<br>
13
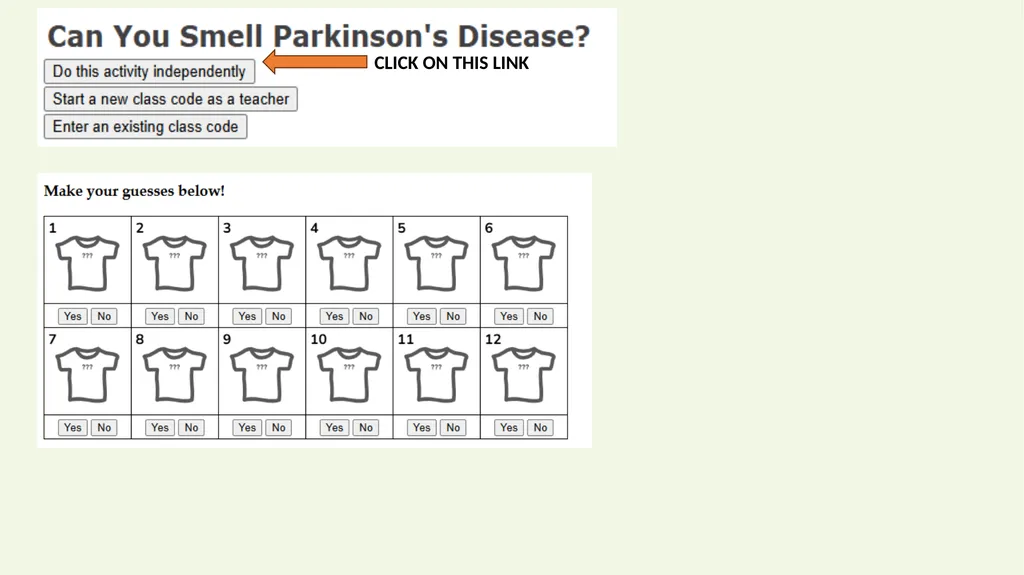
CLICK ON THIS LINK<br>
14
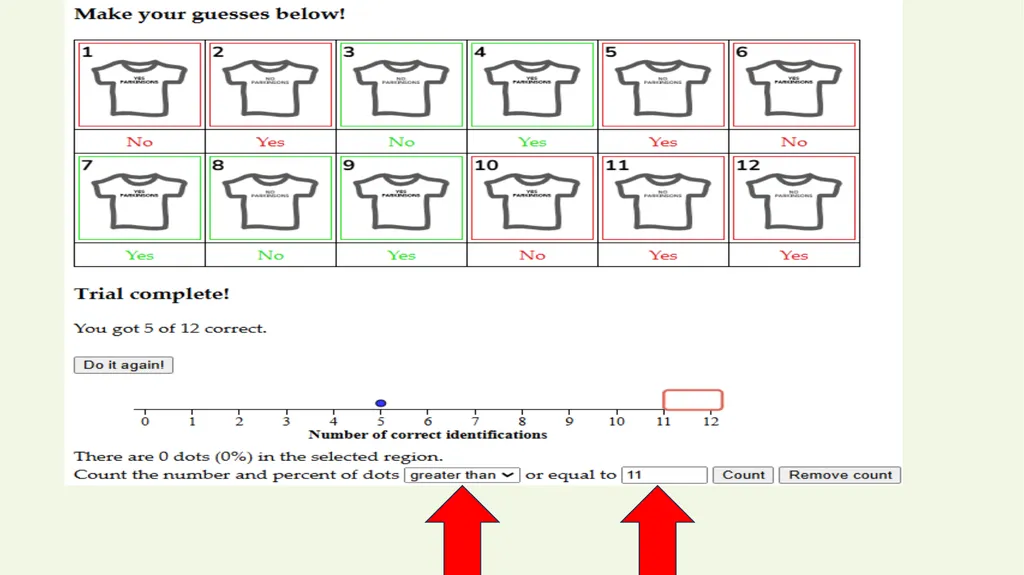
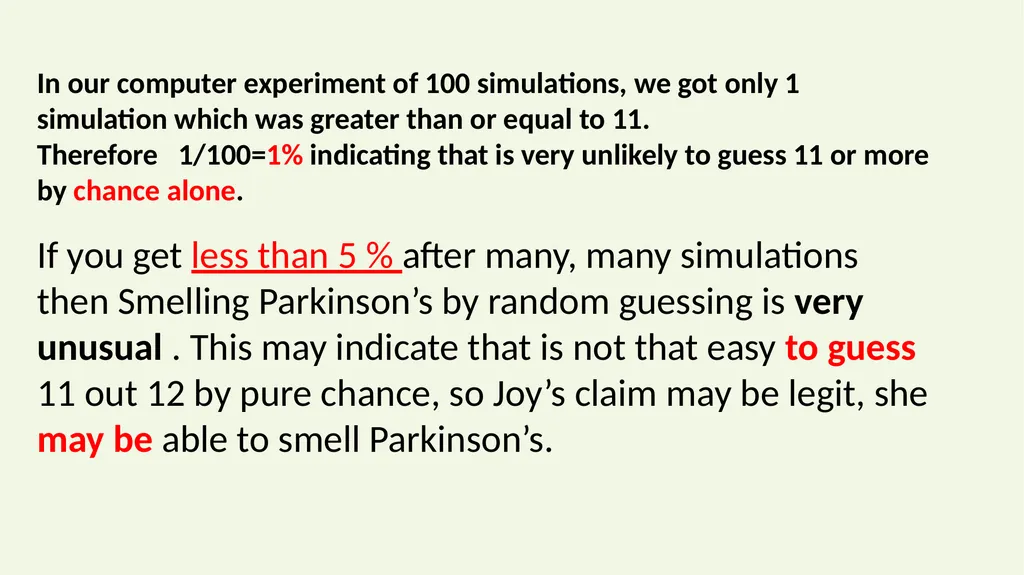
In our computer experiment of 100 simulations, we got only 1 simulation which was greater than or equal to 11.
Therefore 1/100=1% indicating that is very unlikely to guess 11 or more by chance alone.
If you get less than 5 % after many, many simulations then Smelling Parkinson’s by random guessing is very unusual . This may indicate that is not that easy to guess 11 out 12 by pure chance, so Joy’s claim may be legit, she may be able to smell Parkinson’s.<br>
15
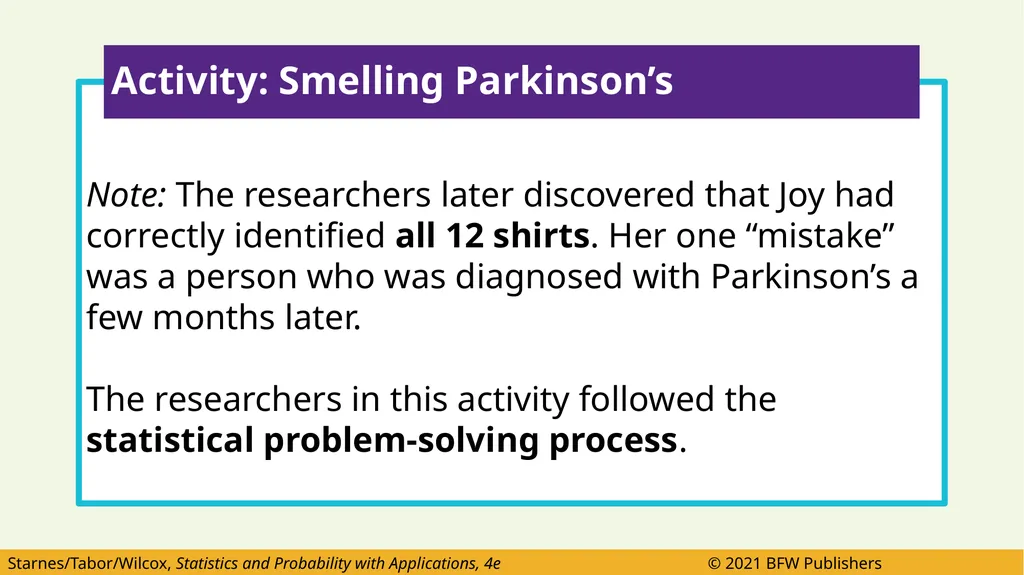
Note: The researchers later discovered that Joy had correctly identified all 12 shirts. Her one “mistake” was a person who was diagnosed with Parkinson’s a few months later.
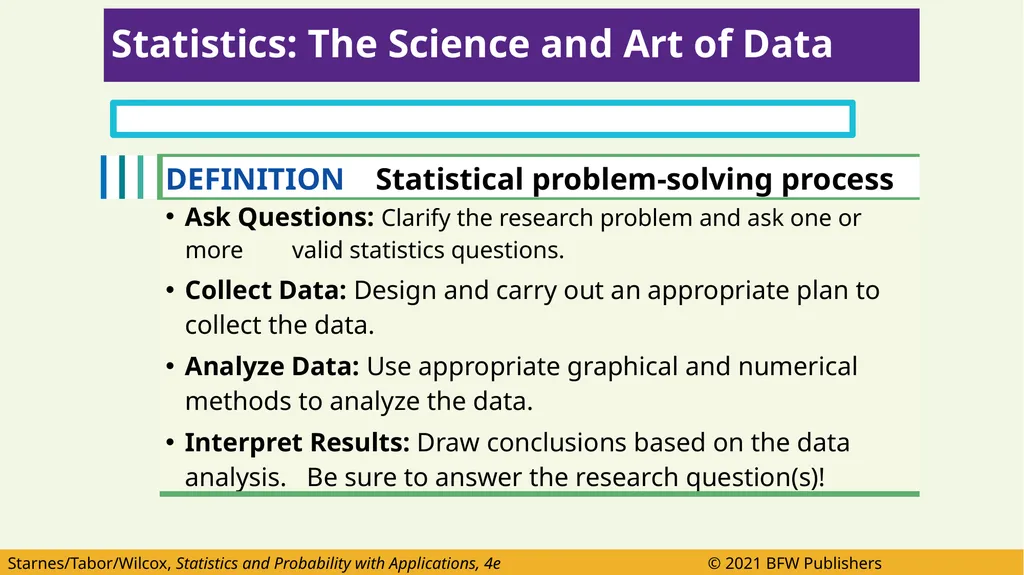
The researchers in this activity followed the statistical problem-solving process. Activity: Smelling Parkinson’s<br>
16
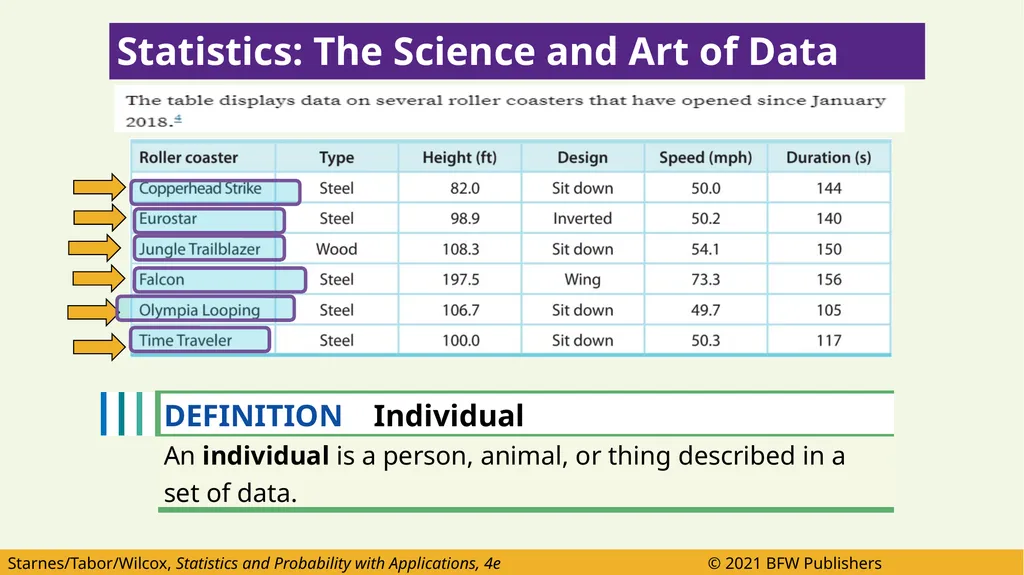
Statistics: The Science and Art of Data<br>
17
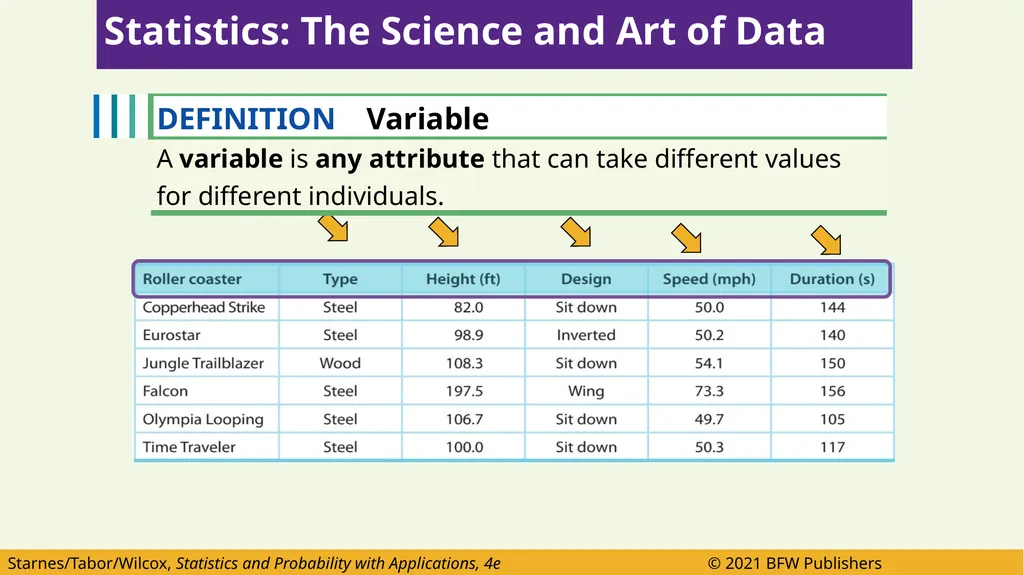
Statistics: The Science and Art of Data<br>
18
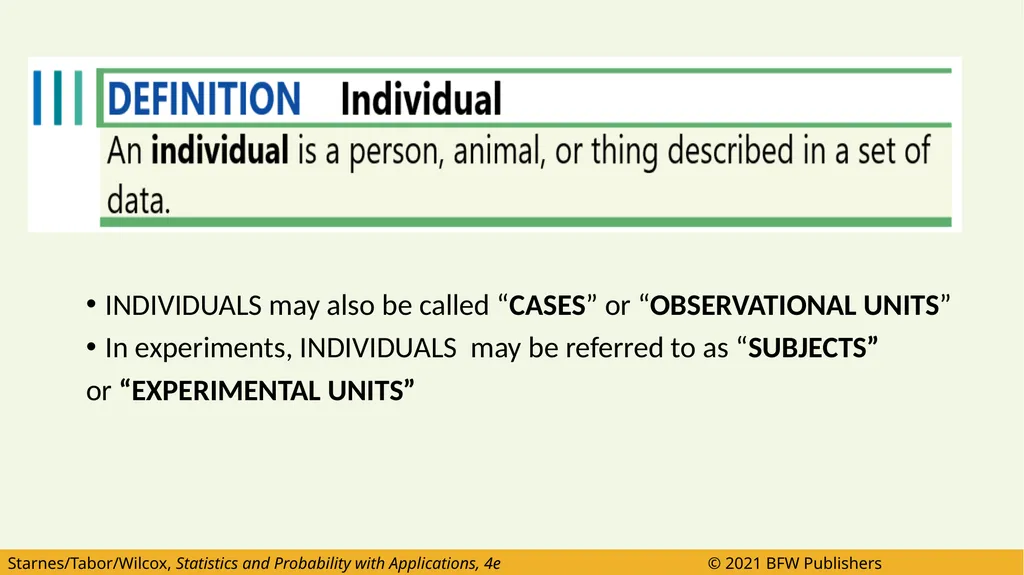
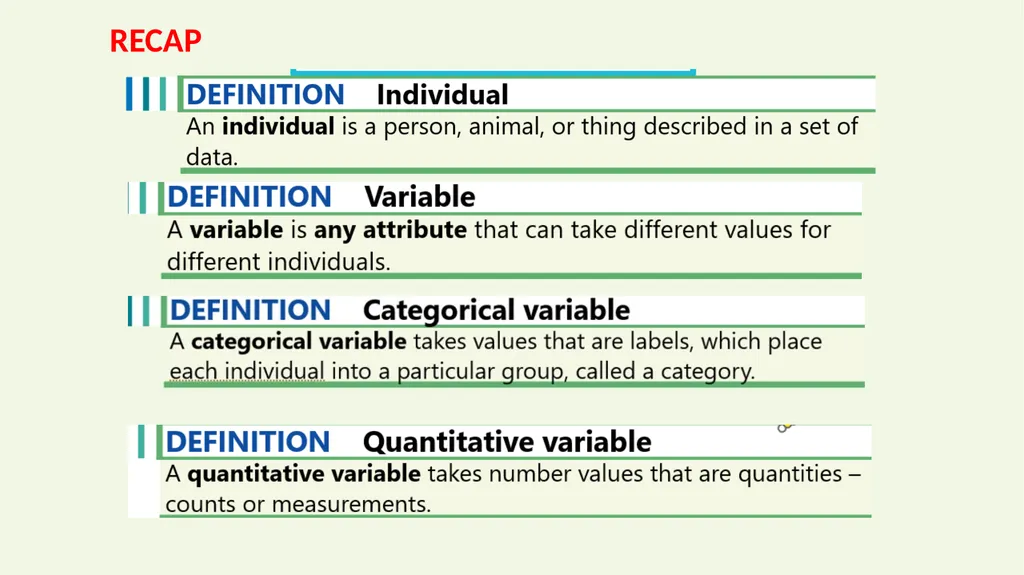
INDIVIDUALS may also be called “CASES” or “OBSERVATIONAL UNITS”
In experiments, INDIVIDUALS may be referred to as “SUBJECTS”
or “EXPERIMENTAL UNITS”<br>
19
Statistics: The Science and Art of Data<br>
20
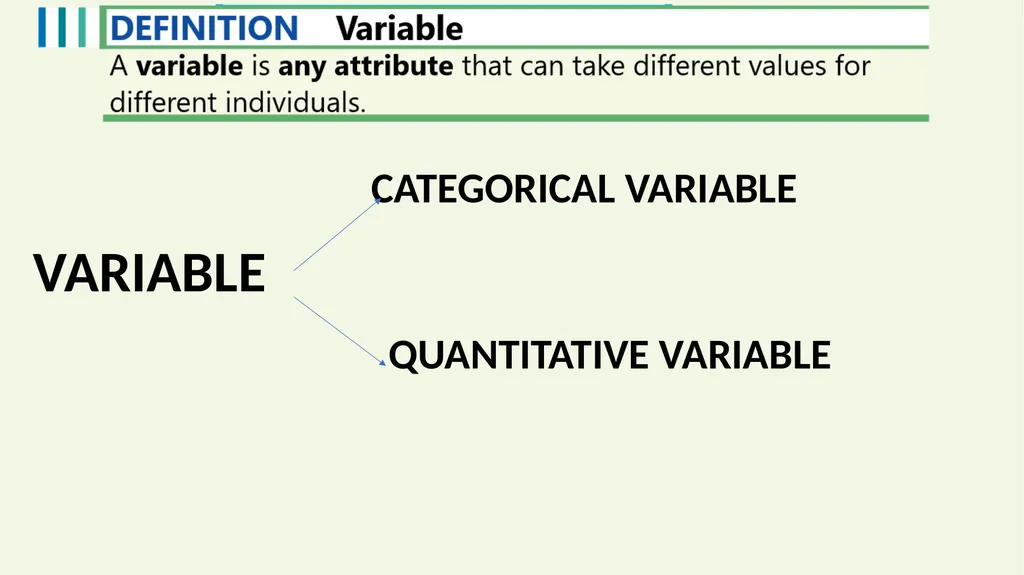
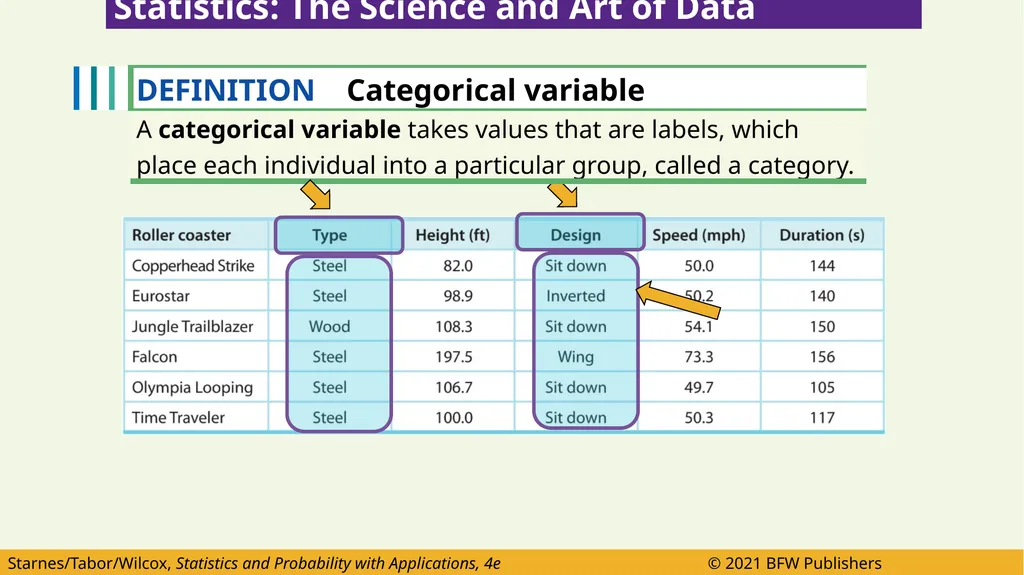
CATEGORICAL VARIABLE
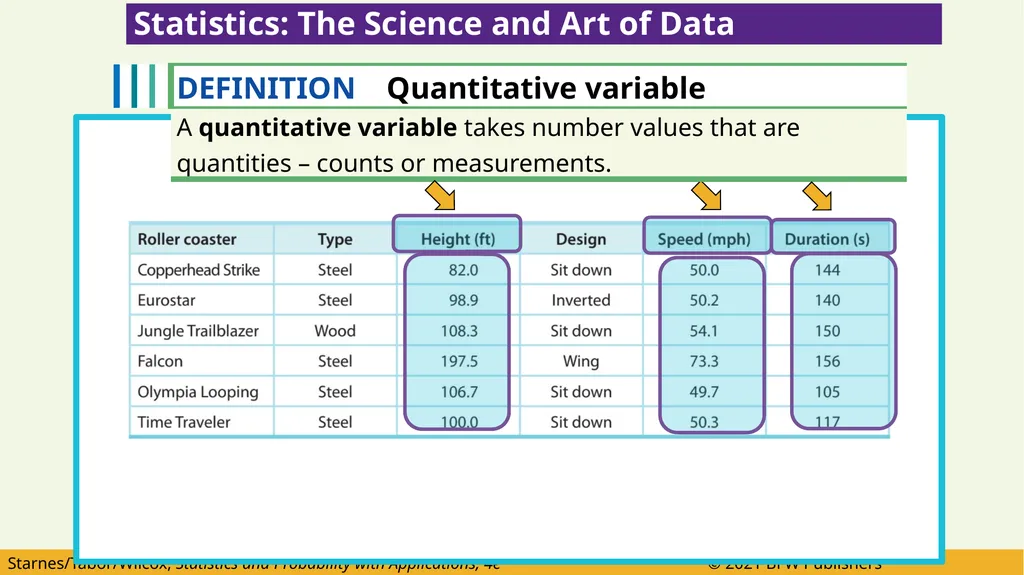
VARIABLE
QUANTITATIVE VARIABLE<br>
21
Statistics: The Science and Art of Data<br>
22
Statistics: The Science and Art of Data<br>
24
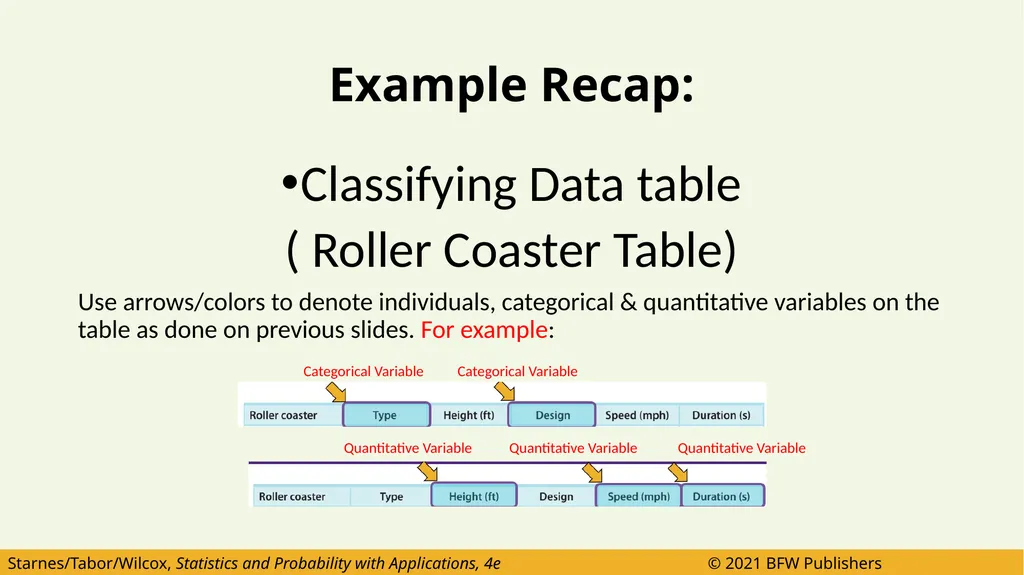
Example Recap: Classifying Data table
( Roller Coaster Table)
Use arrows/colors to denote individuals, categorical & quantitative variables on the table as done on previous slides. For example:
Categorical Variable Categorical Variable
Quantitative Variable Quantitative Variable Quantitative Variable<br>
25
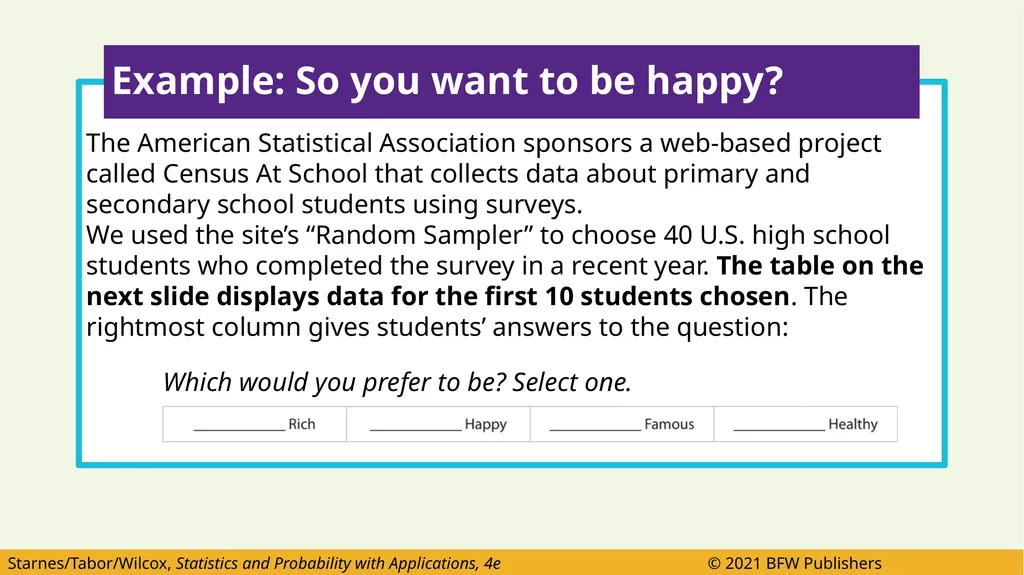
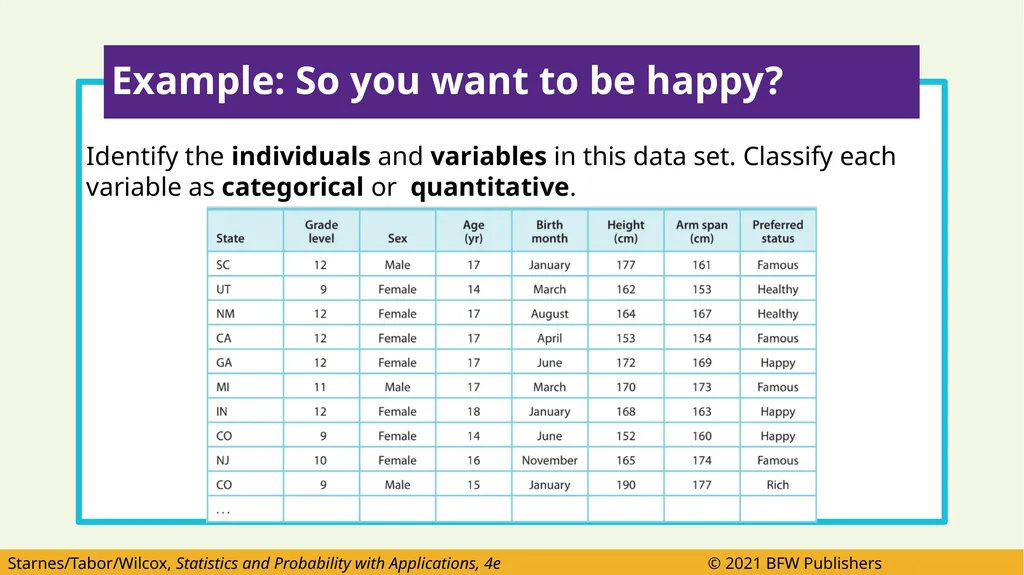
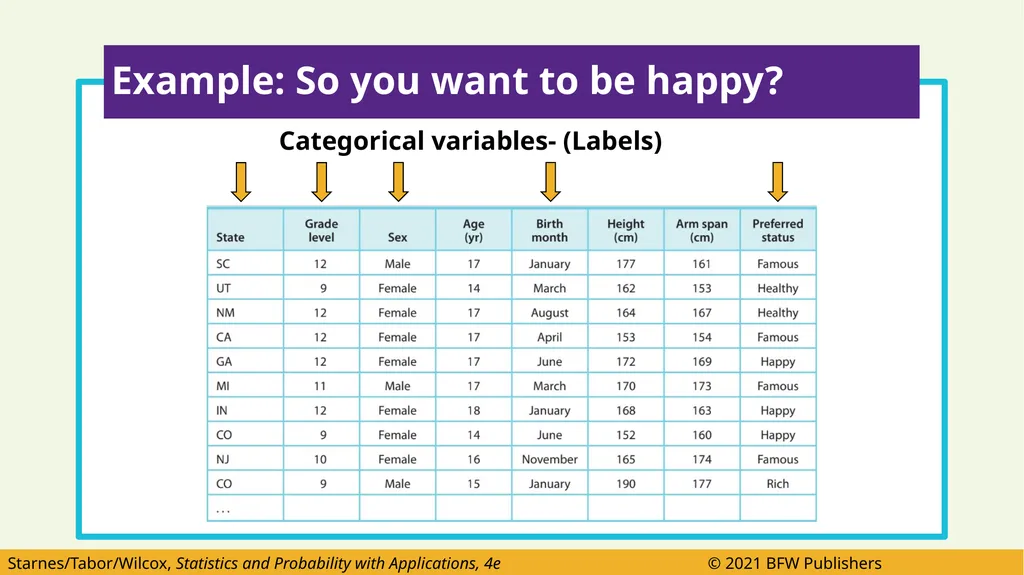
The American Statistical Association sponsors a web-based project called Census At School that collects data about primary and secondary school students using surveys.
We used the site’s “Random Sampler” to choose 40 U.S. high school students who completed the survey in a recent year. The table on the next slide displays data for the first 10 students chosen. The rightmost column gives students’ answers to the question:
Which would you prefer to be? Select one. Example: So you want to be happy?<br>
26
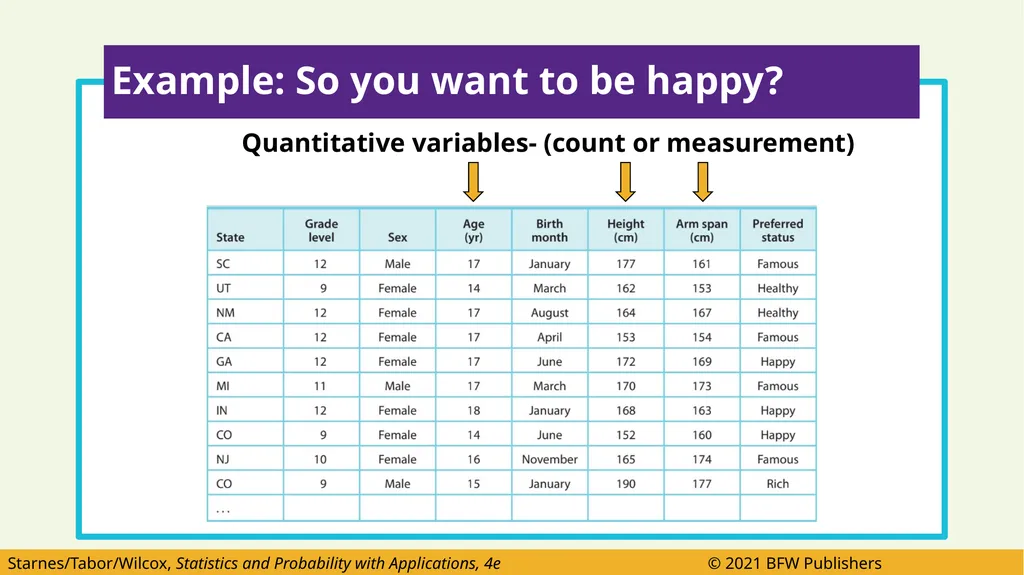
Identify the individuals and variables in this data set. Classify each variable as categorical or quantitative. Example: So you want to be happy?<br>
27
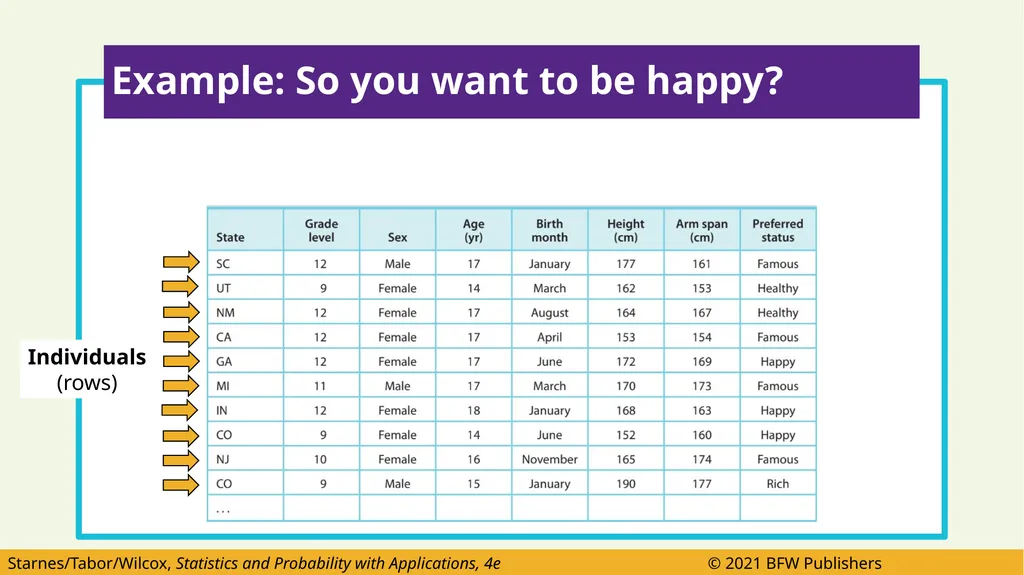
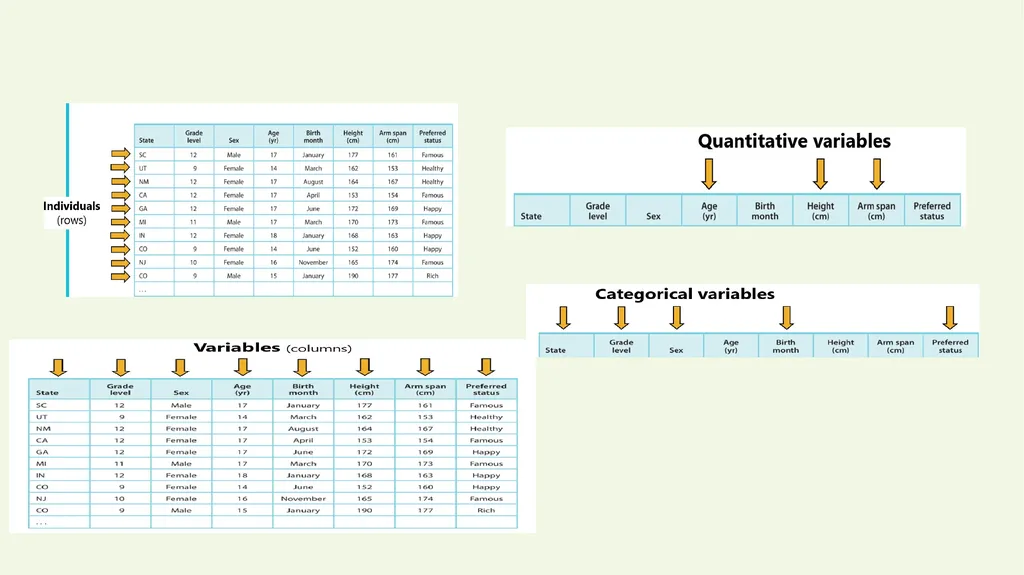
Example: So you want to be happy? Individuals
(rows)<br>
28
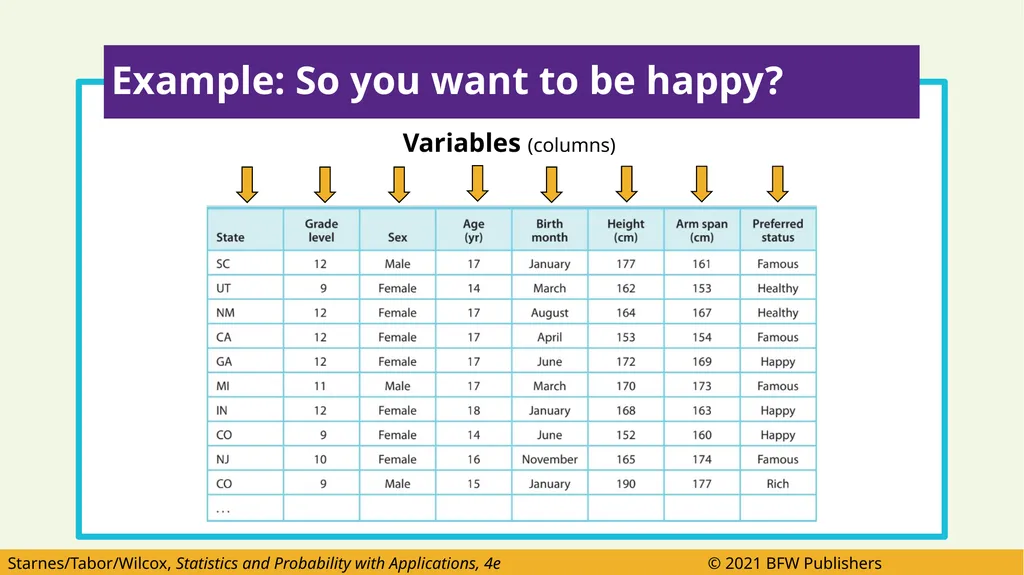
Example: So you want to be happy? Variables (columns)<br>
29
Example: So you want to be happy? Categorical variables- (Labels)<br>
30
Example: So you want to be happy? Quantitative variables- (count or measurement)<br>
31
RECAP. Use arrows to denote�Individuals, categorical & quantitative variables on the table<br>
32
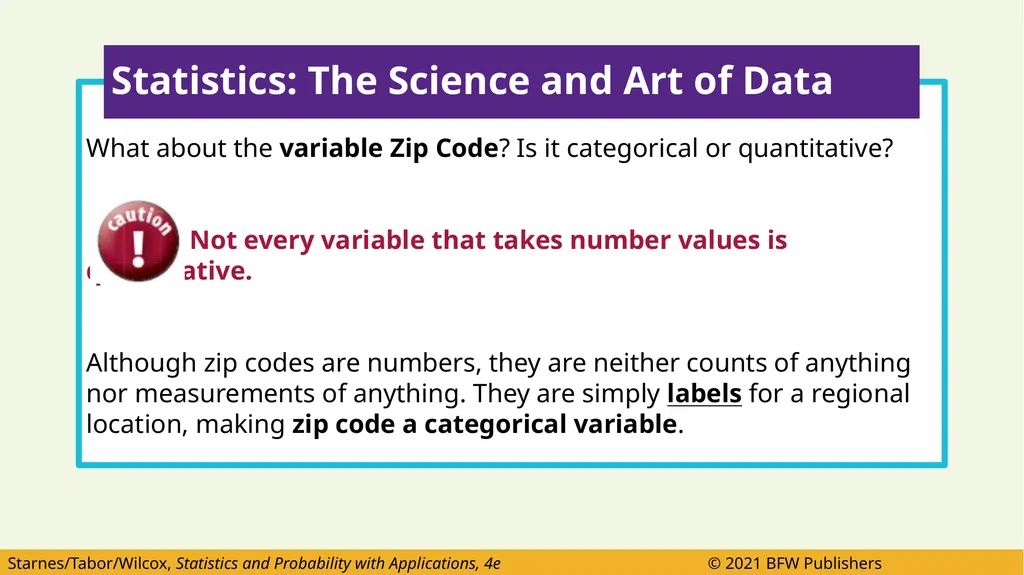
What about the variable Zip Code? Is it categorical or quantitative?
Not every variable that takes number values is quantitative.
Although zip codes are numbers, they are neither counts of anything nor measurements of anything. They are simply labels for a regional location, making zip code a categorical variable. Statistics: The Science and Art of Data<br>
33
categorical variables or quantitative variables?�Are these numbers measuring or counting something?��How about phone numbers? ���Social Security numbers?<br>
34
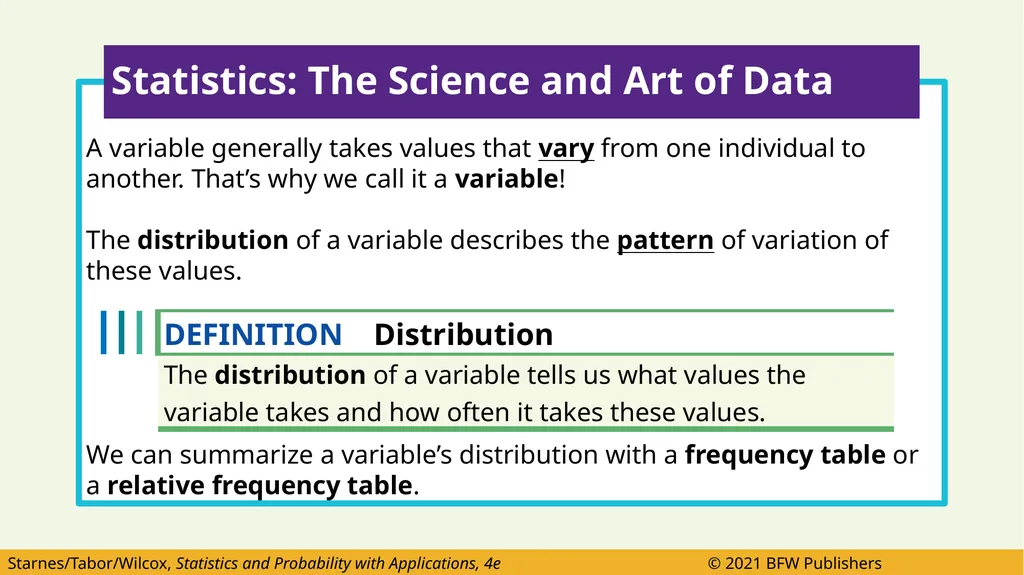
A variable generally takes values that vary from one individual to another. That’s why we call it a variable!
The distribution of a variable describes the pattern of variation of these values.
We can summarize a variable’s distribution with a frequency table or a relative frequency table. Statistics: The Science and Art of Data<br>
35
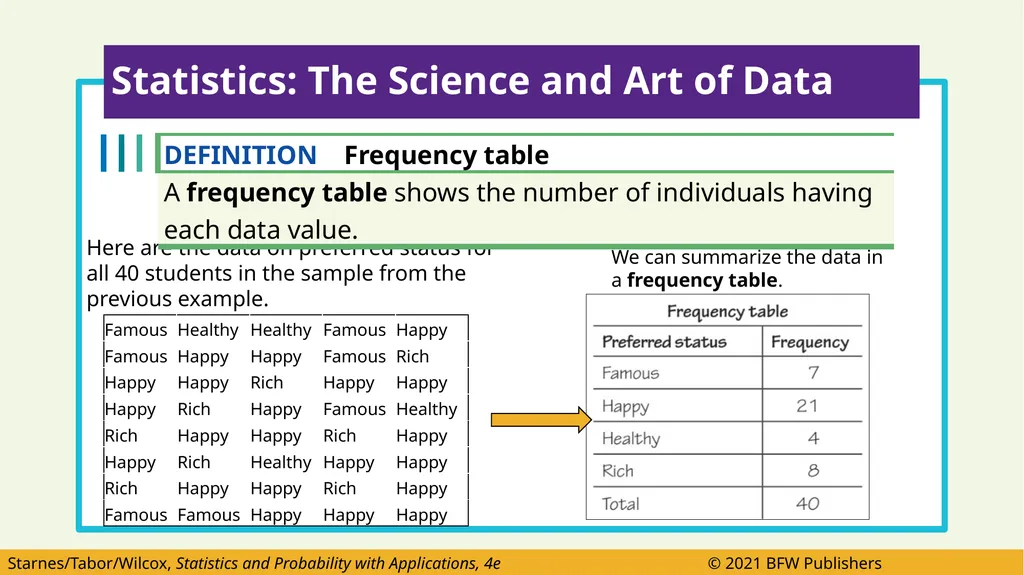
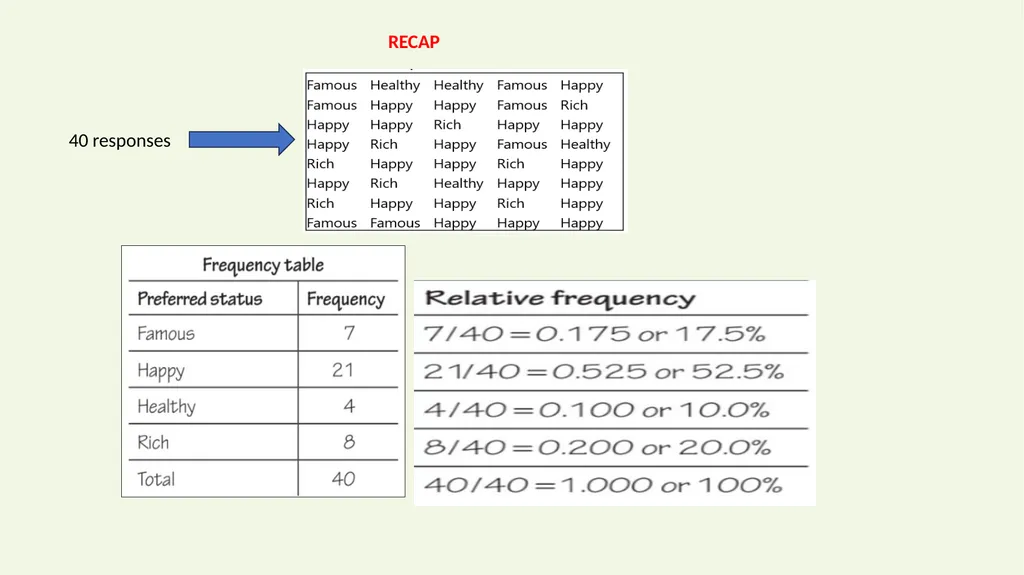
Here are the data on preferred status for
all 40 students in the sample from the
previous example. Statistics: The Science and Art of Data We can summarize the data in a frequency table.<br>
36
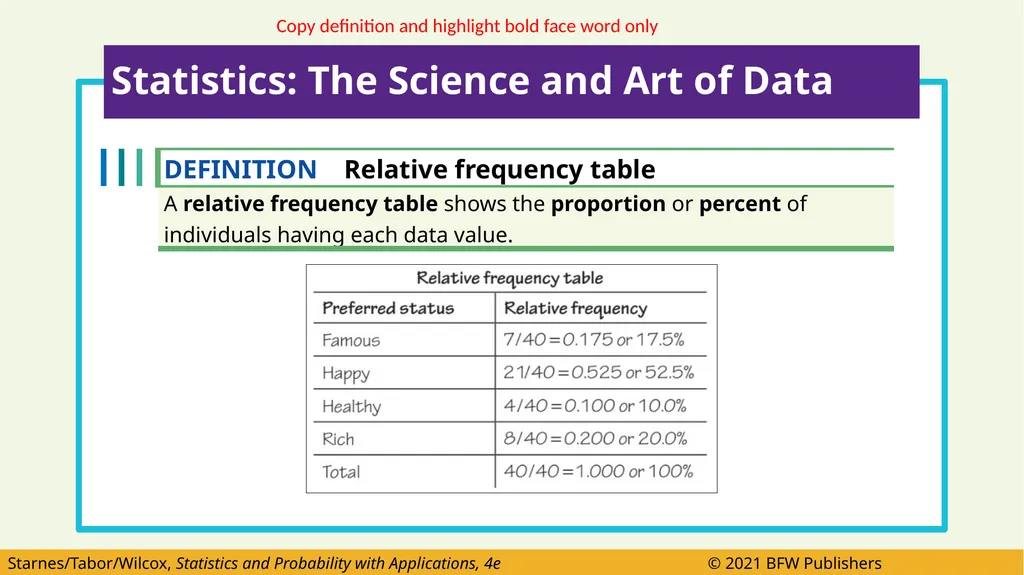
Statistics: The Science and Art of Data Copy definition and highlight bold face word only<br>
37
RECAP 40 responses<br>
38
Watch video on Lesson APP 1.1�Found in your student resources for Chapter 1�� Watch Video on Lesson APP 1<br>
39
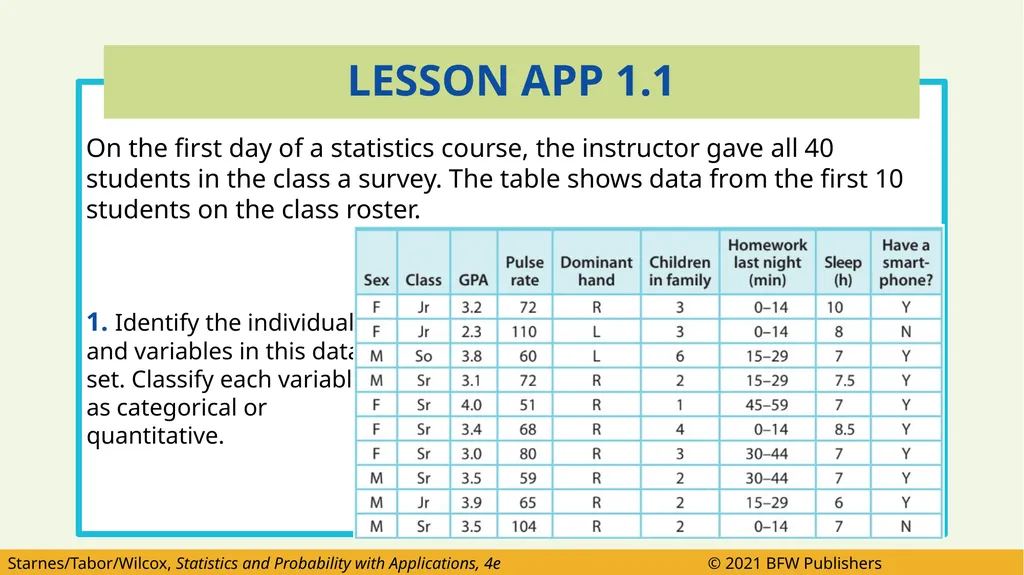
On the first day of a statistics course, the instructor gave all 40 students in the class a survey. The table shows data from the first 10 students on the class roster.
1. Identify the individuals
and variables in this data
set. Classify each variable
as categorical or
quantitative. LESSON APP 1.1<br>
40
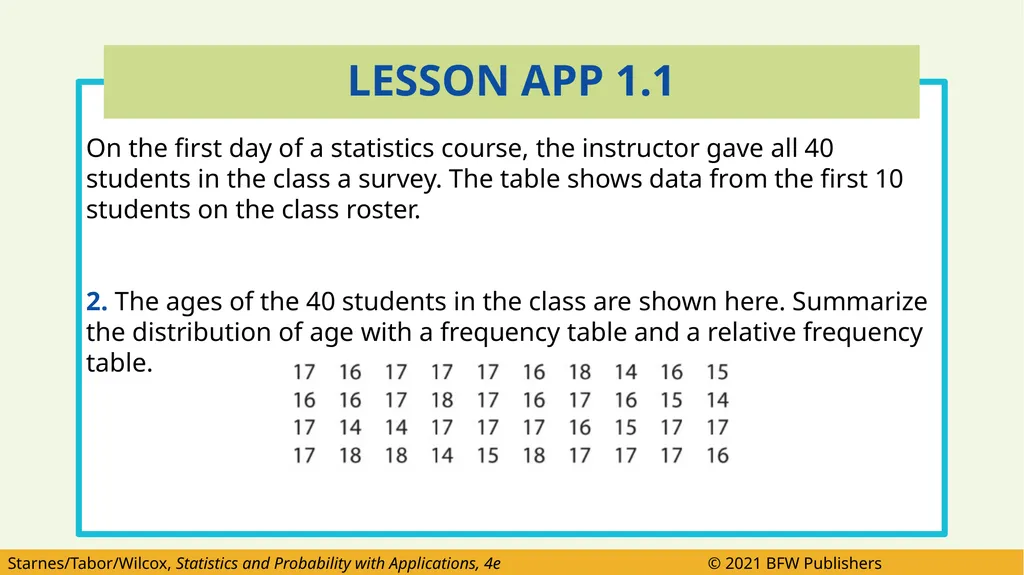
On the first day of a statistics course, the instructor gave all 40 students in the class a survey. The table shows data from the first 10 students on the class roster.
2. The ages of the 40 students in the class are shown here. Summarize the distribution of age with a frequency table and a relative frequency table. LESSON APP 1.1<br>
41
Get the classroom textbook located in your desk basket, go to
the end of LESON 1.1<br>
42
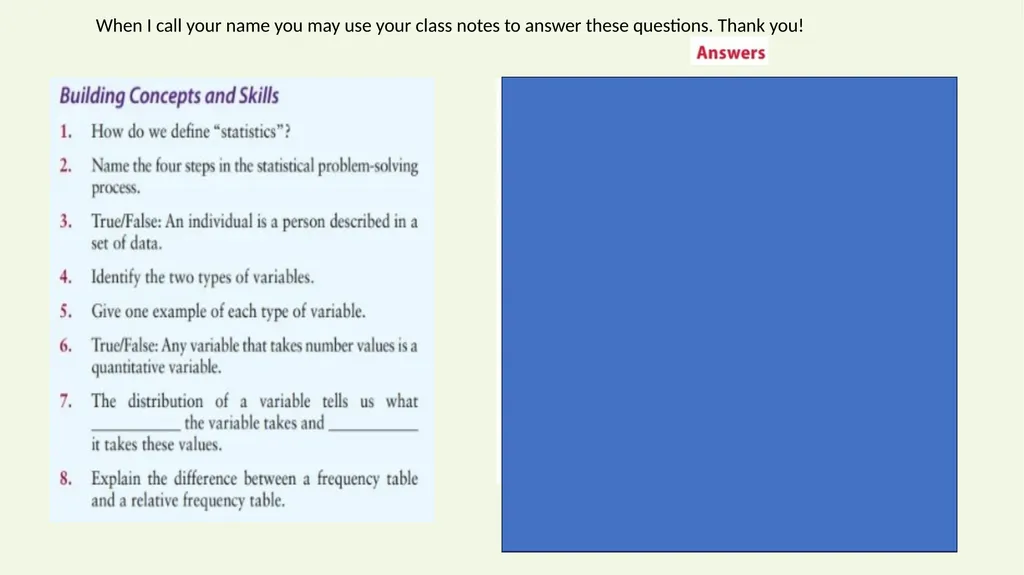
When I call your name you may use your class notes to answer these questions. Thank you!<br>
43
2 Online assignments on Lesson 1.1-
Recommended Assignment & �Other Book- Based Questions,<br>
45
What did you learn?
Identify the individuals and variables in a data set,
then classify the variables as categorical or
quantitative.
Summarize the distribution of a variable with a frequency table or a relative frequency table. Learning Targets<br>