
Children and young people physical activity
OM
Published · 53 slides · 0 views
1 / 1
Description
Children and young people physical activity behaviour Active Lives CYP survey How the data is presented Definitions Measures Sample size School roll Physical activity behaviour At and outside of school By demographic group By year group and
Related Topics
Share
Embed code
Download this presentation From Below
"Children and young people physical activity" is the property of its rightful owner. Permission is granted to download and print the materials on this website for personal, non-commercial use only, and to display it on your personal computer provided you do not modify the materials and that you retain all copyright notices contained in the materials. By downloading content from our website, you accept the terms of this agreement.
Presentation Transcript
01
Children and young people physical activity behaviour<br>
02
Active Lives CYP survey
How the data is presented
Definitions
Measures
Sample size
School roll
Physical activity behaviour
At and outside of school
By demographic group
By year group and demographic group
Activities
Physical literacy
Impact of Covid-19
Summary Contents<br>
How the data is presented
Definitions
Measures
Sample size
School roll
Physical activity behaviour
At and outside of school
By demographic group
By year group and demographic group
Activities
Physical literacy
Impact of Covid-19
Summary Contents<br>
03
The Active Lives Children and Young People Survey is conducted by Ipsos MORI on behalf of Sport England who commissioned the survey to inform both their own strategy and the strategies of the Department for Digital, Culture, Media and Sport (DCMS), the Department for Education (DfE) and the Department of Health and Social Care (DHSC).
The survey collects data to present a comprehensive picture of children and young people’s:
Overall levels of activity both during the school day (‘at school’) and outside school
Activity levels for a range of key demographic groups
The types of activities undertaken by age group
Volunteering levels (supporting sport and physical activity)
Associations between activity levels and measures of mental wellbeing, individual development and social and community development
Attitudes of children and young people towards sport and physical activity
The survey is now in it’s 4th year of data collection. Since the year 1 data was published, there’s been a change to the UK Chief Medical Officer’s physical activity guidelines for children and young people. Instead of at least 60 minutes of activity every day, the new guidelines recommend young people engage in moderate to vigorous intensity activity for an average of at least 60 minutes a day across the week. The data for all years is now presented to reflect this change in guidelines. Active Lives CYP survey<br>
The survey collects data to present a comprehensive picture of children and young people’s:
Overall levels of activity both during the school day (‘at school’) and outside school
Activity levels for a range of key demographic groups
The types of activities undertaken by age group
Volunteering levels (supporting sport and physical activity)
Associations between activity levels and measures of mental wellbeing, individual development and social and community development
Attitudes of children and young people towards sport and physical activity
The survey is now in it’s 4th year of data collection. Since the year 1 data was published, there’s been a change to the UK Chief Medical Officer’s physical activity guidelines for children and young people. Instead of at least 60 minutes of activity every day, the new guidelines recommend young people engage in moderate to vigorous intensity activity for an average of at least 60 minutes a day across the week. The data for all years is now presented to reflect this change in guidelines. Active Lives CYP survey<br>
04
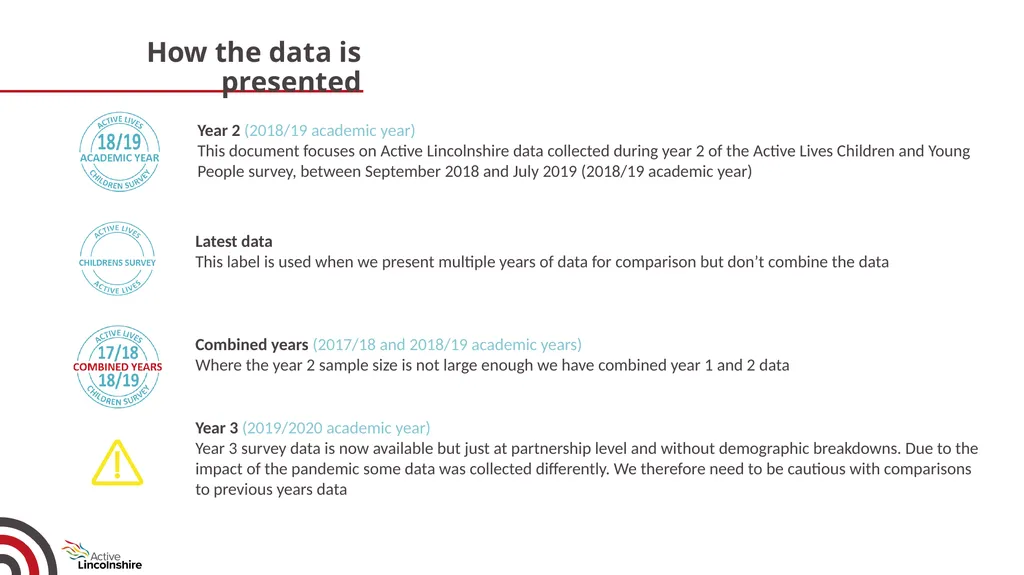
How the data is presented Year 2 (2018/19 academic year)
This document focuses on Active Lincolnshire data collected during year 2 of the Active Lives Children and Young People survey, between September 2018 and July 2019 (2018/19 academic year) Year 3 (2019/2020 academic year)
Year 3 survey data is now available but just at partnership level and without demographic breakdowns. Due to the impact of the pandemic some data was collected differently. We therefore need to be cautious with comparisons to previous years data Combined years (2017/18 and 2018/19 academic years)
Where the year 2 sample size is not large enough we have combined year 1 and 2 data Latest data
This label is used when we present multiple years of data for comparison but don’t combine the data<br>
This document focuses on Active Lincolnshire data collected during year 2 of the Active Lives Children and Young People survey, between September 2018 and July 2019 (2018/19 academic year) Year 3 (2019/2020 academic year)
Year 3 survey data is now available but just at partnership level and without demographic breakdowns. Due to the impact of the pandemic some data was collected differently. We therefore need to be cautious with comparisons to previous years data Combined years (2017/18 and 2018/19 academic years)
Where the year 2 sample size is not large enough we have combined year 1 and 2 data Latest data
This label is used when we present multiple years of data for comparison but don’t combine the data<br>
05
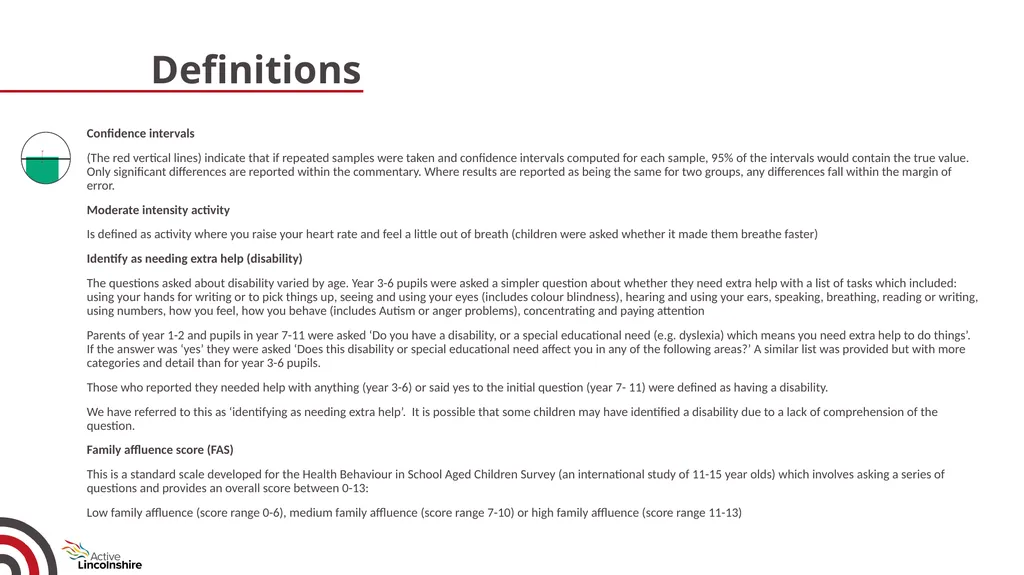
Confidence intervals
(The red vertical lines) indicate that if repeated samples were taken and confidence intervals computed for each sample, 95% of the intervals would contain the true value. Only significant differences are reported within the commentary. Where results are reported as being the same for two groups, any differences fall within the margin of error.
Moderate intensity activity
Is defined as activity where you raise your heart rate and feel a little out of breath (children were asked whether it made them breathe faster)
Identify as needing extra help (disability)
The questions asked about disability varied by age. Year 3-6 pupils were asked a simpler question about whether they need extra help with a list of tasks which included: using your hands for writing or to pick things up, seeing and using your eyes (includes colour blindness), hearing and using your ears, speaking, breathing, reading or writing, using numbers, how you feel, how you behave (includes Autism or anger problems), concentrating and paying attention
Parents of year 1-2 and pupils in year 7-11 were asked ‘Do you have a disability, or a special educational need (e.g. dyslexia) which means you need extra help to do things’. If the answer was ‘yes’ they were asked ‘Does this disability or special educational need affect you in any of the following areas?’ A similar list was provided but with more categories and detail than for year 3-6 pupils.
Those who reported they needed help with anything (year 3-6) or said yes to the initial question (year 7- 11) were defined as having a disability.
We have referred to this as ‘identifying as needing extra help’. It is possible that some children may have identified a disability due to a lack of comprehension of the question.
Family affluence score (FAS)
This is a standard scale developed for the Health Behaviour in School Aged Children Survey (an international study of 11-15 year olds) which involves asking a series of questions and provides an overall score between 0-13:
Low family affluence (score range 0-6), medium family affluence (score range 7-10) or high family affluence (score range 11-13) Definitions<br>
(The red vertical lines) indicate that if repeated samples were taken and confidence intervals computed for each sample, 95% of the intervals would contain the true value. Only significant differences are reported within the commentary. Where results are reported as being the same for two groups, any differences fall within the margin of error.
Moderate intensity activity
Is defined as activity where you raise your heart rate and feel a little out of breath (children were asked whether it made them breathe faster)
Identify as needing extra help (disability)
The questions asked about disability varied by age. Year 3-6 pupils were asked a simpler question about whether they need extra help with a list of tasks which included: using your hands for writing or to pick things up, seeing and using your eyes (includes colour blindness), hearing and using your ears, speaking, breathing, reading or writing, using numbers, how you feel, how you behave (includes Autism or anger problems), concentrating and paying attention
Parents of year 1-2 and pupils in year 7-11 were asked ‘Do you have a disability, or a special educational need (e.g. dyslexia) which means you need extra help to do things’. If the answer was ‘yes’ they were asked ‘Does this disability or special educational need affect you in any of the following areas?’ A similar list was provided but with more categories and detail than for year 3-6 pupils.
Those who reported they needed help with anything (year 3-6) or said yes to the initial question (year 7- 11) were defined as having a disability.
We have referred to this as ‘identifying as needing extra help’. It is possible that some children may have identified a disability due to a lack of comprehension of the question.
Family affluence score (FAS)
This is a standard scale developed for the Health Behaviour in School Aged Children Survey (an international study of 11-15 year olds) which involves asking a series of questions and provides an overall score between 0-13:
Low family affluence (score range 0-6), medium family affluence (score range 7-10) or high family affluence (score range 11-13) Definitions<br>
06
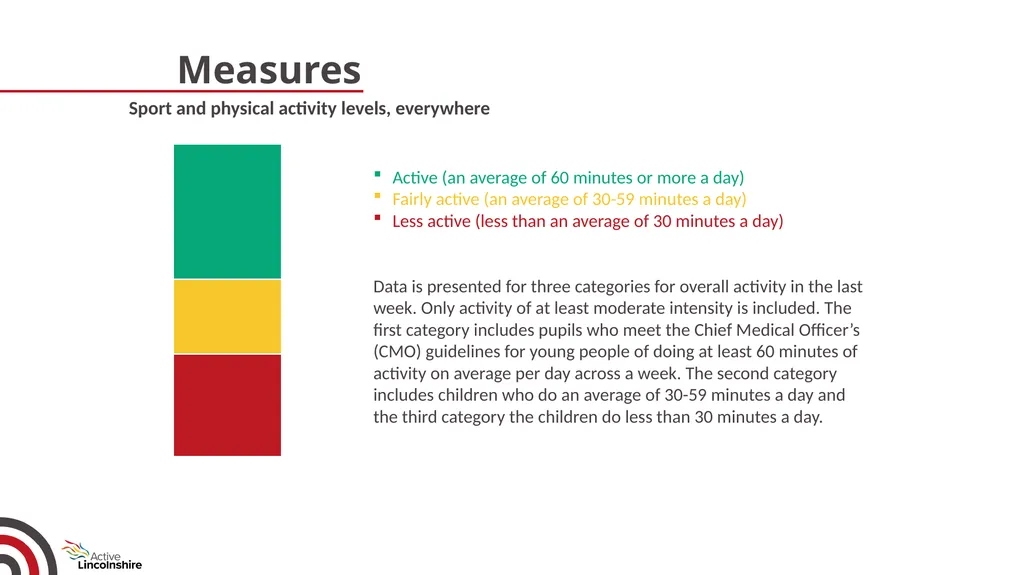
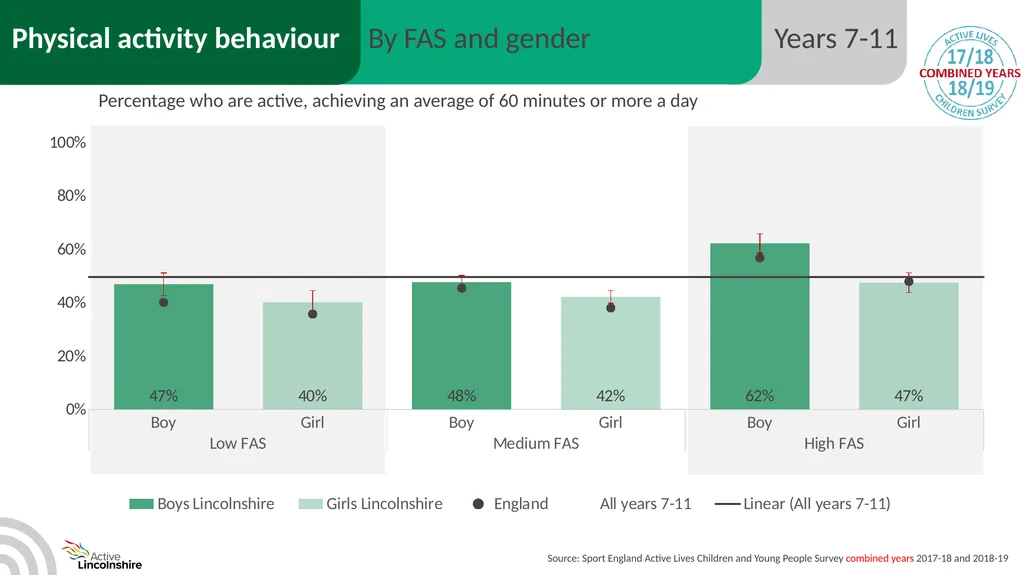
Measures Active (an average of 60 minutes or more a day)
Fairly active (an average of 30-59 minutes a day)
Less active (less than an average of 30 minutes a day)
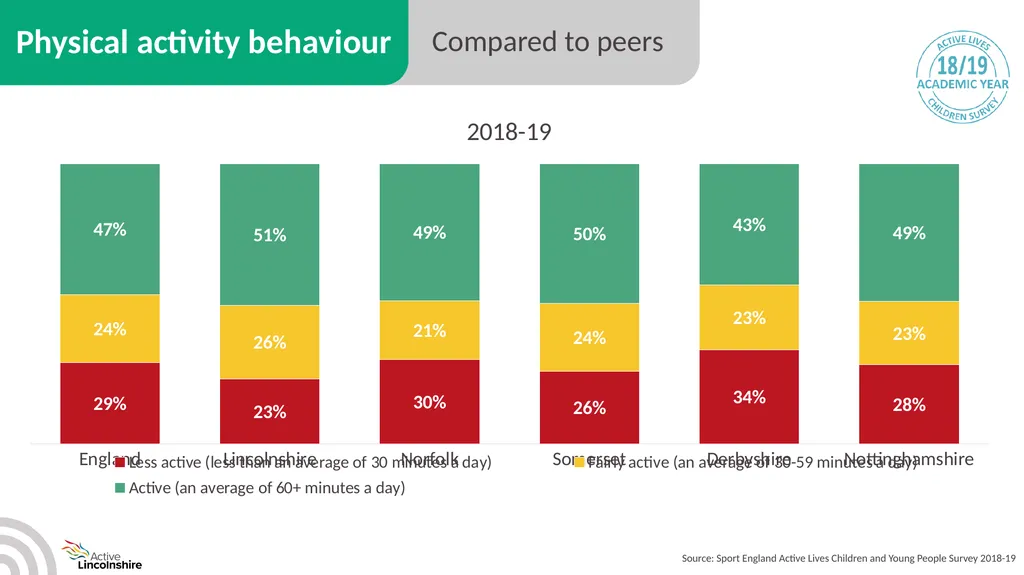
Data is presented for three categories for overall activity in the last week. Only activity of at least moderate intensity is included. The first category includes pupils who meet the Chief Medical Officer’s (CMO) guidelines for young people of doing at least 60 minutes of activity on average per day across a week. The second category includes children who do an average of 30-59 minutes a day and the third category the children do less than 30 minutes a day. Sport and physical activity levels, everywhere<br>
Fairly active (an average of 30-59 minutes a day)
Less active (less than an average of 30 minutes a day)
Data is presented for three categories for overall activity in the last week. Only activity of at least moderate intensity is included. The first category includes pupils who meet the Chief Medical Officer’s (CMO) guidelines for young people of doing at least 60 minutes of activity on average per day across a week. The second category includes children who do an average of 30-59 minutes a day and the third category the children do less than 30 minutes a day. Sport and physical activity levels, everywhere<br>
07
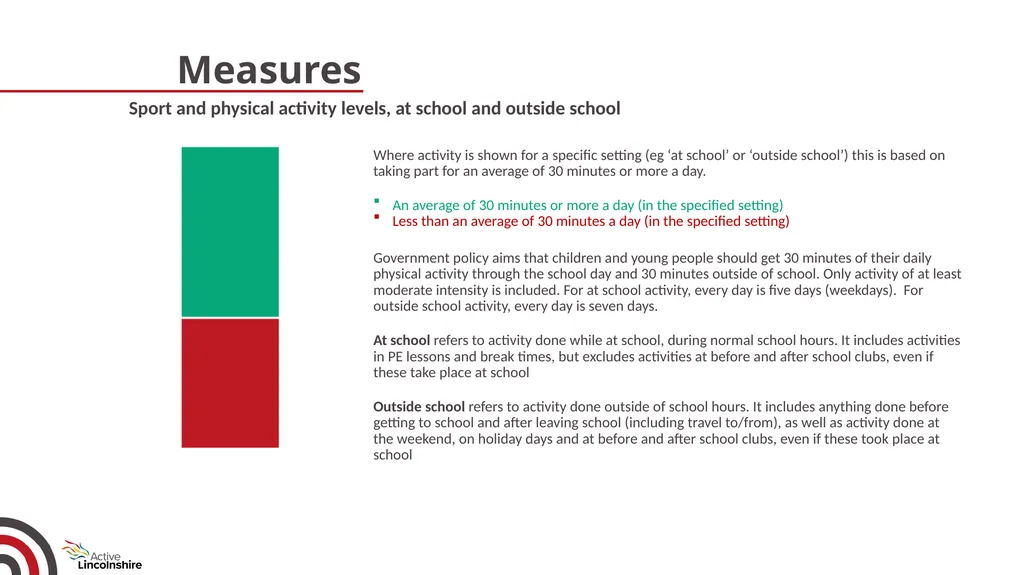
Measures Where activity is shown for a specific setting (eg ‘at school’ or ‘outside school’) this is based on taking part for an average of 30 minutes or more a day.
An average of 30 minutes or more a day (in the specified setting)
Less than an average of 30 minutes a day (in the specified setting)
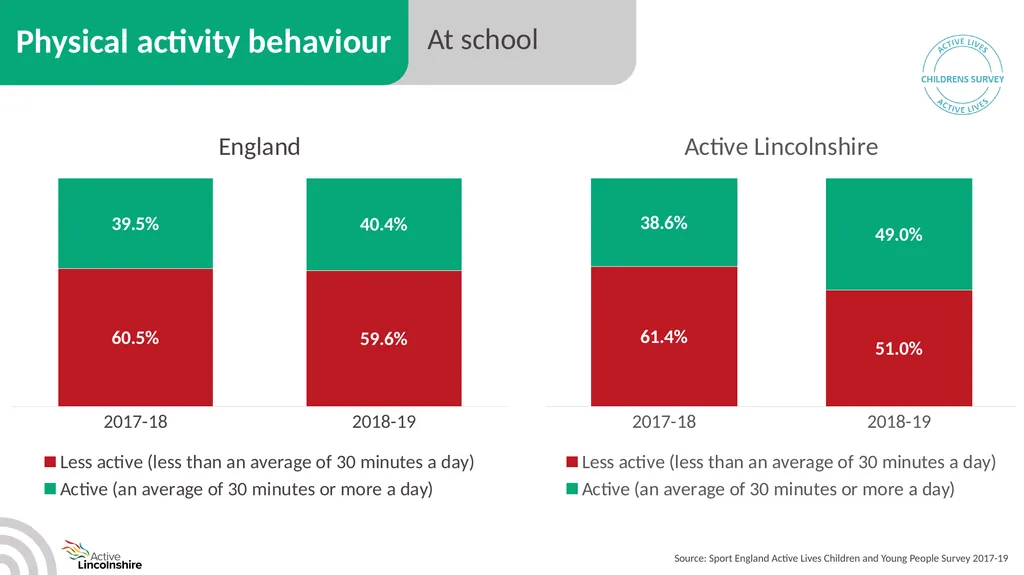
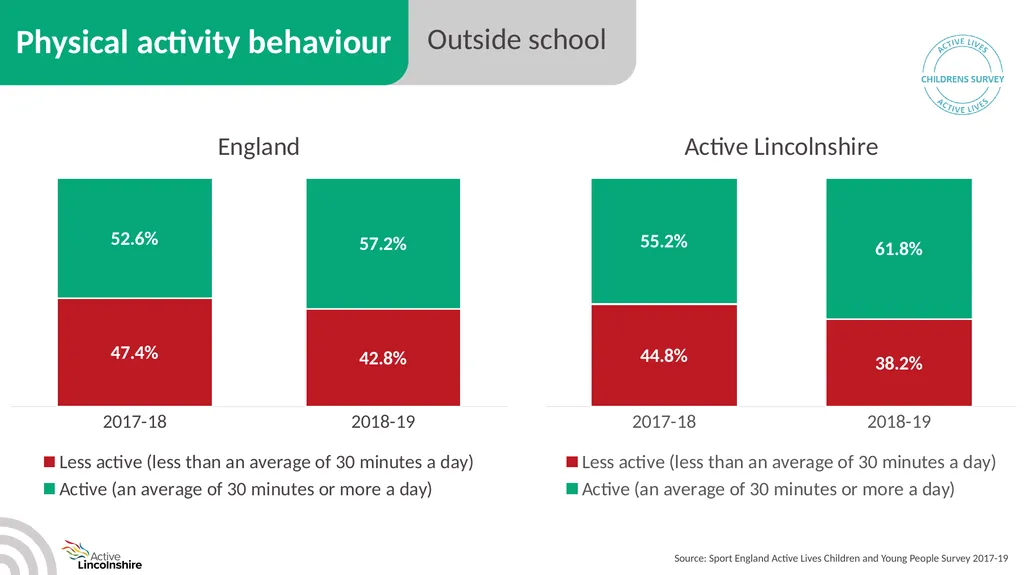
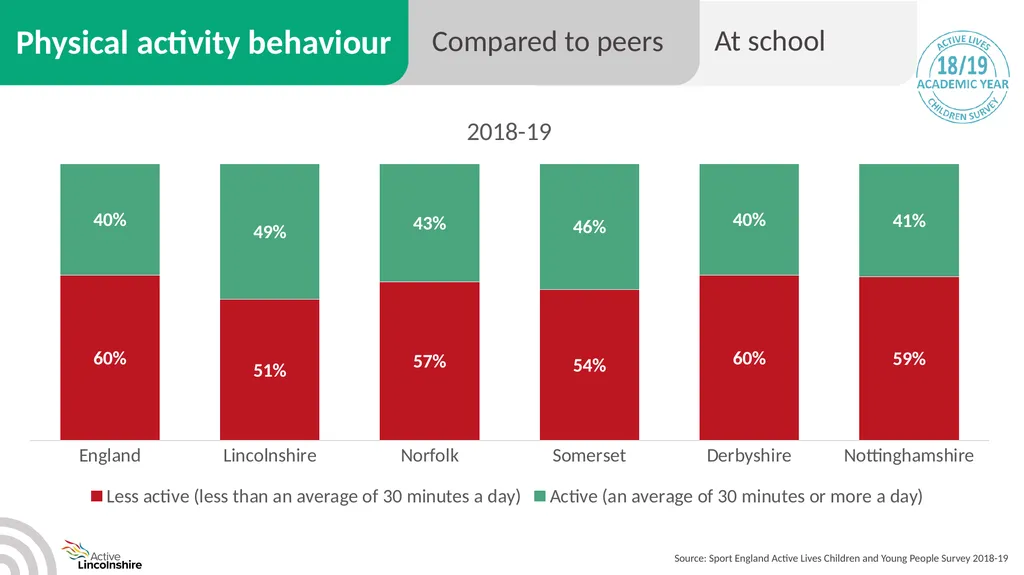
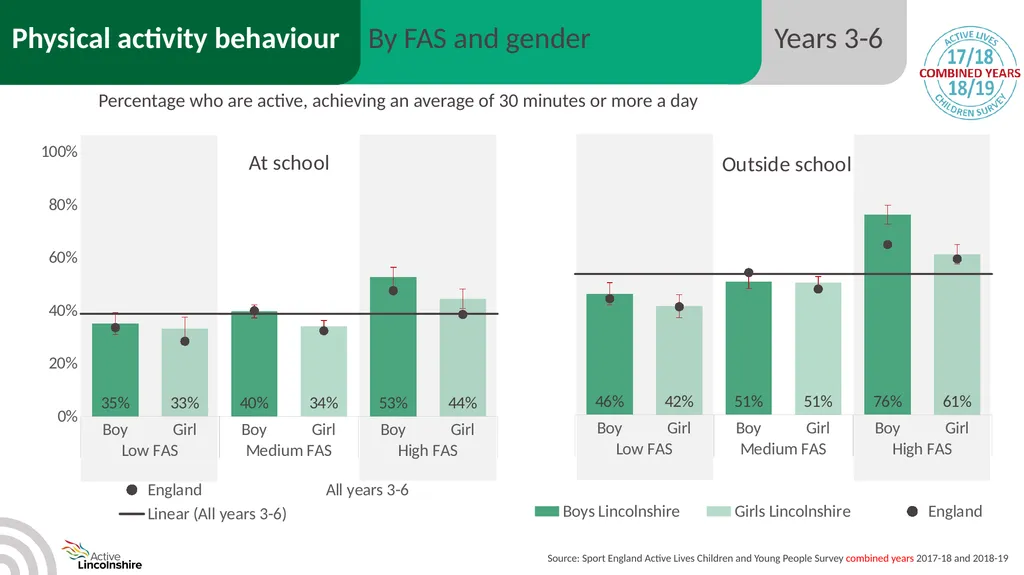
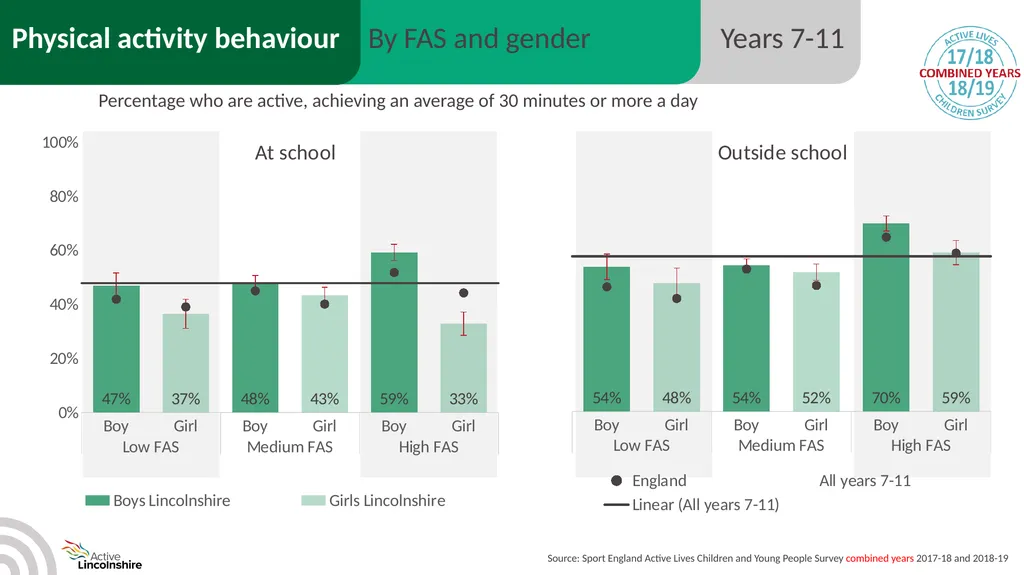
Government policy aims that children and young people should get 30 minutes of their daily physical activity through the school day and 30 minutes outside of school. Only activity of at least moderate intensity is included. For at school activity, every day is five days (weekdays). For outside school activity, every day is seven days.
At school refers to activity done while at school, during normal school hours. It includes activities in PE lessons and break times, but excludes activities at before and after school clubs, even if these take place at school
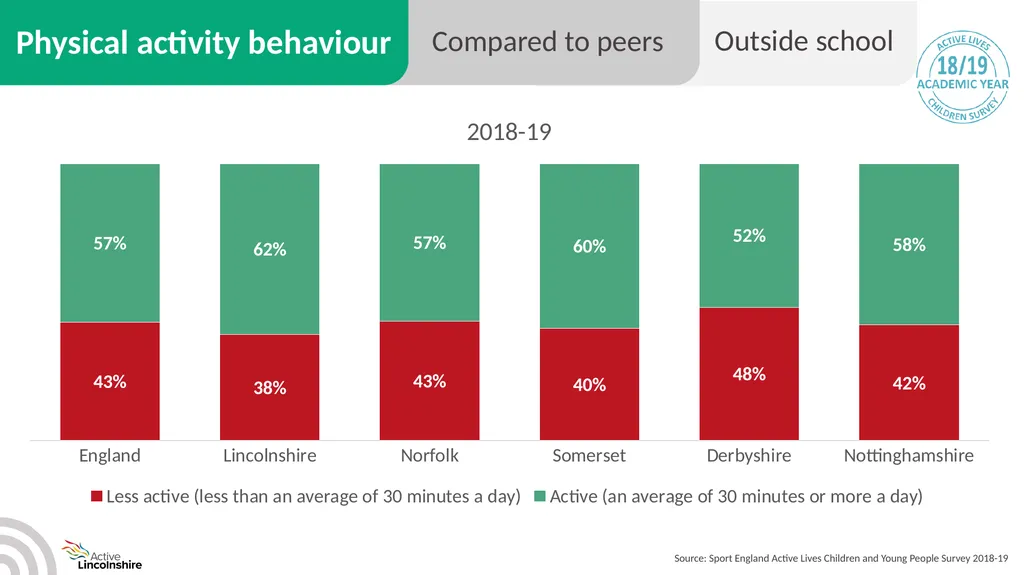
Outside school refers to activity done outside of school hours. It includes anything done before getting to school and after leaving school (including travel to/from), as well as activity done at the weekend, on holiday days and at before and after school clubs, even if these took place at school Sport and physical activity levels, at school and outside school<br>
An average of 30 minutes or more a day (in the specified setting)
Less than an average of 30 minutes a day (in the specified setting)
Government policy aims that children and young people should get 30 minutes of their daily physical activity through the school day and 30 minutes outside of school. Only activity of at least moderate intensity is included. For at school activity, every day is five days (weekdays). For outside school activity, every day is seven days.
At school refers to activity done while at school, during normal school hours. It includes activities in PE lessons and break times, but excludes activities at before and after school clubs, even if these take place at school
Outside school refers to activity done outside of school hours. It includes anything done before getting to school and after leaving school (including travel to/from), as well as activity done at the weekend, on holiday days and at before and after school clubs, even if these took place at school Sport and physical activity levels, at school and outside school<br>
08
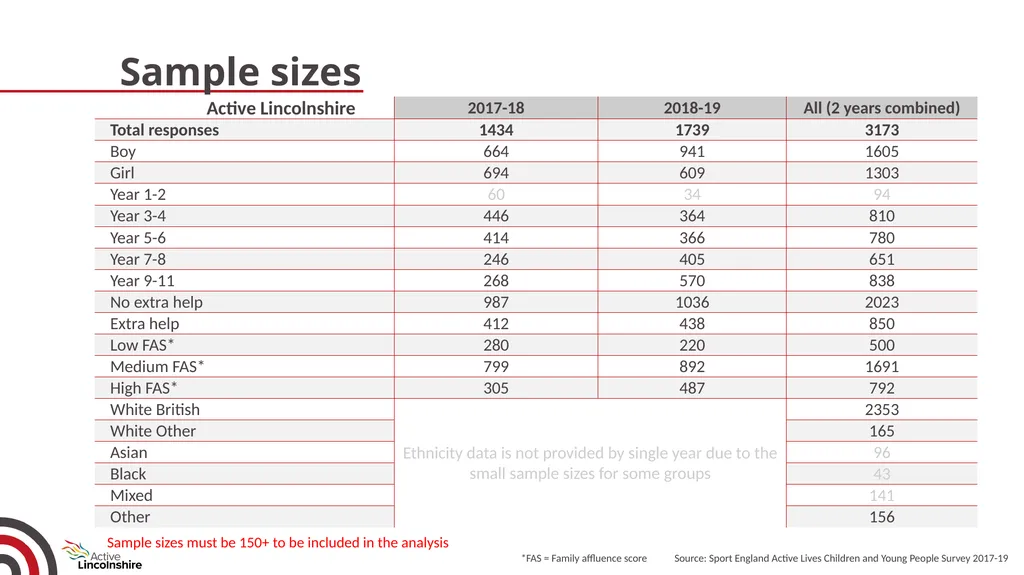
*FAS = Family affluence score Source: Sport England Active Lives Children and Young People Survey 2017-19 Sample sizes must be 150+ to be included in the analysis Sample sizes Active Lincolnshire<br>
09
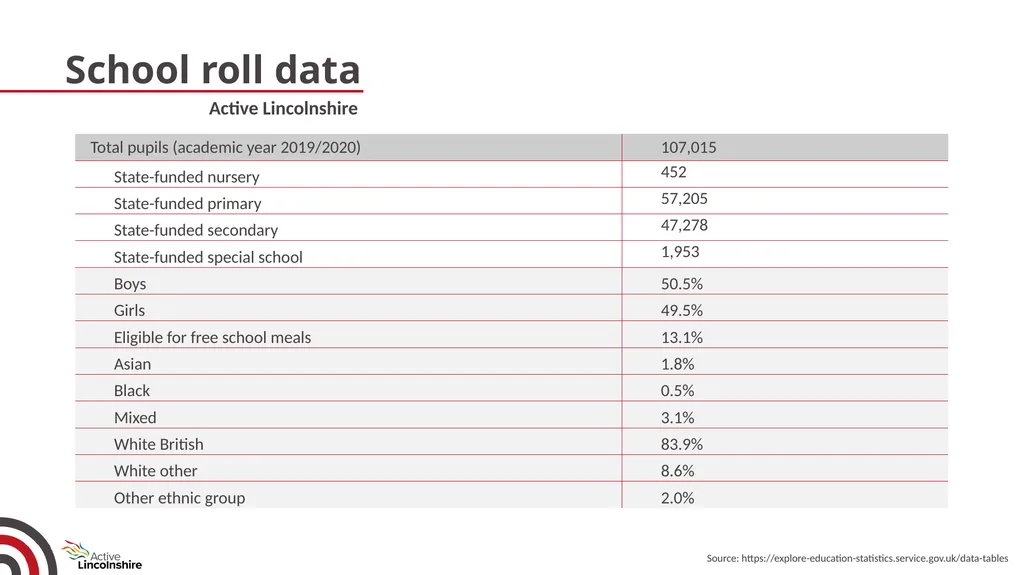
School roll data Source: https://explore-education-statistics.service.gov.uk/data-tables Active Lincolnshire<br>
10
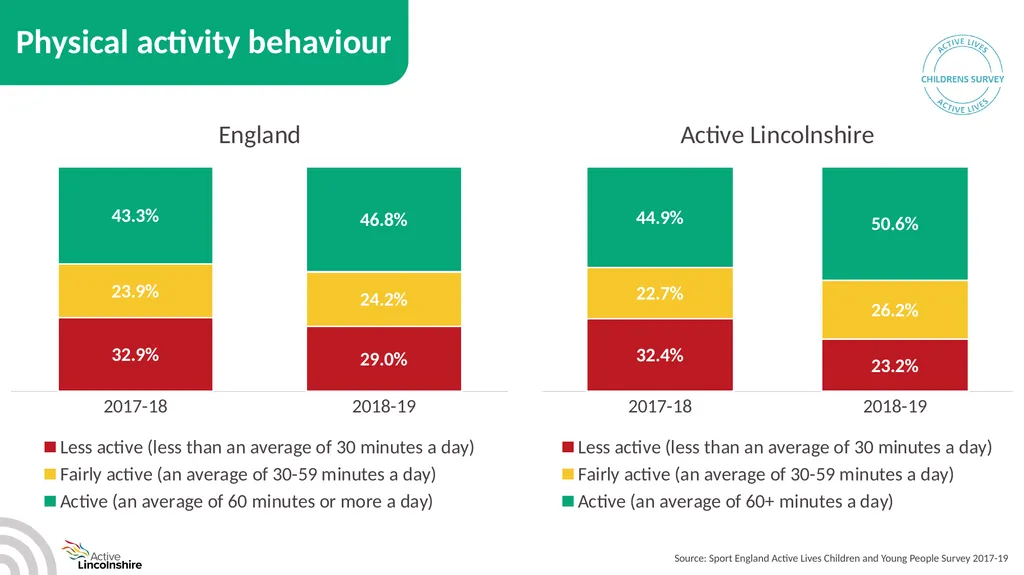
Source: Sport England Active Lives Children and Young People Survey 2017-19 Physical activity behaviour<br>
11
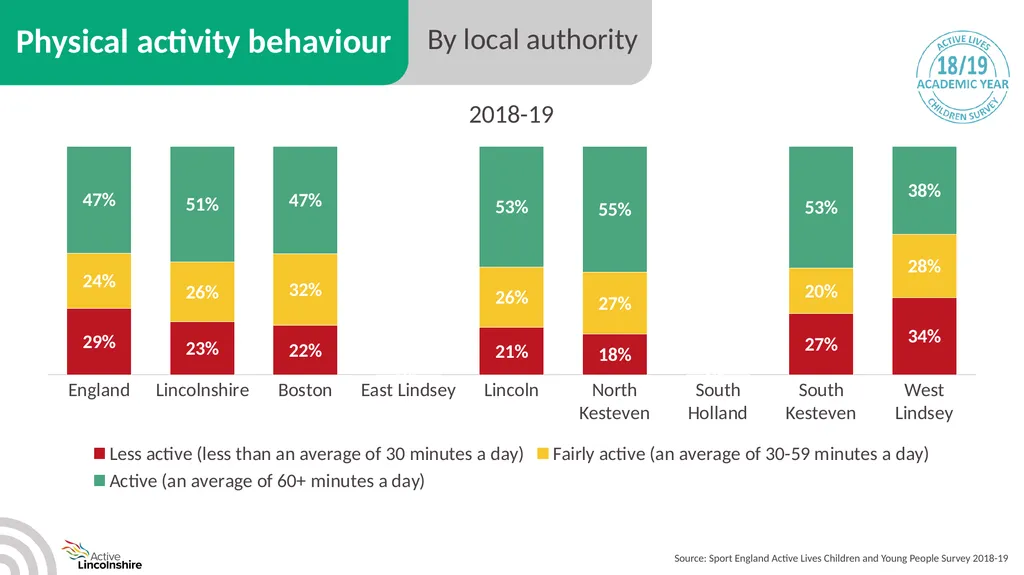
Source: Sport England Active Lives Children and Young People Survey 2018-19<br>
12
Source: Sport England Active Lives Children and Young People Survey 2017-19<br>
13
Source: Sport England Active Lives Children and Young People Survey 2017-19<br>
14
Source: Sport England Active Lives Children and Young People Survey 2018-19 Physical activity behaviour Compared to peers<br>
15
Compared to peers Source: Sport England Active Lives Children and Young People Survey 2018-19 At school<br>
16
Source: Sport England Active Lives Children and Young People Survey 2018-19 Compared to peers Outside school<br>
17
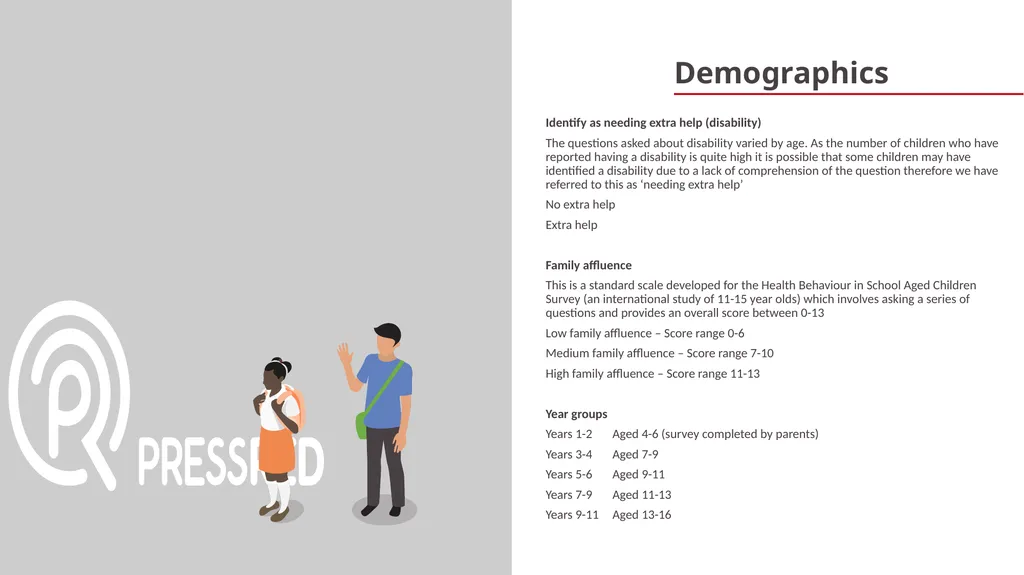
Identify as needing extra help (disability)
The questions asked about disability varied by age. As the number of children who have reported having a disability is quite high it is possible that some children may have identified a disability due to a lack of comprehension of the question therefore we have referred to this as ‘needing extra help’
No extra help
Extra help
Family affluence
This is a standard scale developed for the Health Behaviour in School Aged Children Survey (an international study of 11-15 year olds) which involves asking a series of questions and provides an overall score between 0-13
Low family affluence – Score range 0-6
Medium family affluence – Score range 7-10
High family affluence – Score range 11-13
Year groups
Years 1-2 Aged 4-6 (survey completed by parents)
Years 3-4 Aged 7-9
Years 5-6 Aged 9-11
Years 7-9 Aged 11-13
Years 9-11 Aged 13-16 Demographics<br>
The questions asked about disability varied by age. As the number of children who have reported having a disability is quite high it is possible that some children may have identified a disability due to a lack of comprehension of the question therefore we have referred to this as ‘needing extra help’
No extra help
Extra help
Family affluence
This is a standard scale developed for the Health Behaviour in School Aged Children Survey (an international study of 11-15 year olds) which involves asking a series of questions and provides an overall score between 0-13
Low family affluence – Score range 0-6
Medium family affluence – Score range 7-10
High family affluence – Score range 11-13
Year groups
Years 1-2 Aged 4-6 (survey completed by parents)
Years 3-4 Aged 7-9
Years 5-6 Aged 9-11
Years 7-9 Aged 11-13
Years 9-11 Aged 13-16 Demographics<br>
18
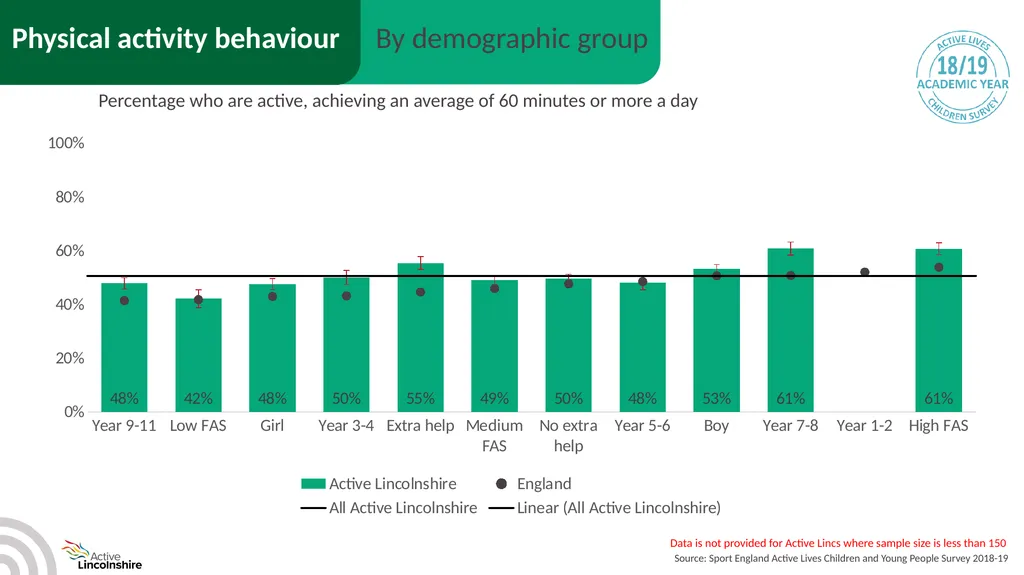
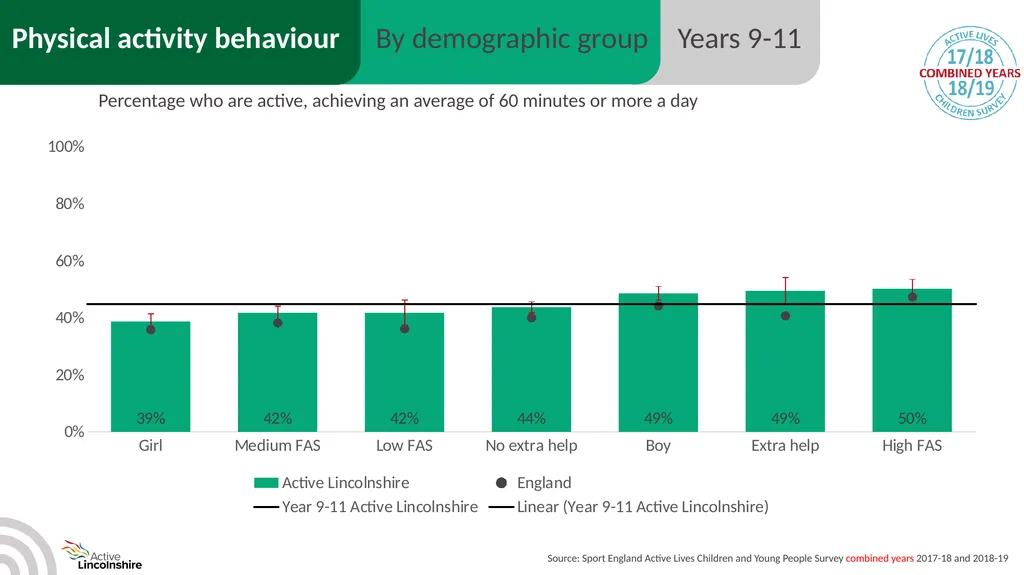
Source: Sport England Active Lives Children and Young People Survey 2018-19 Everywhere Physical activity behaviour By demographic group Percentage who are active, achieving an average of 60 minutes or more a day Data is not provided for Active Lincs where sample size is less than 150<br>
19
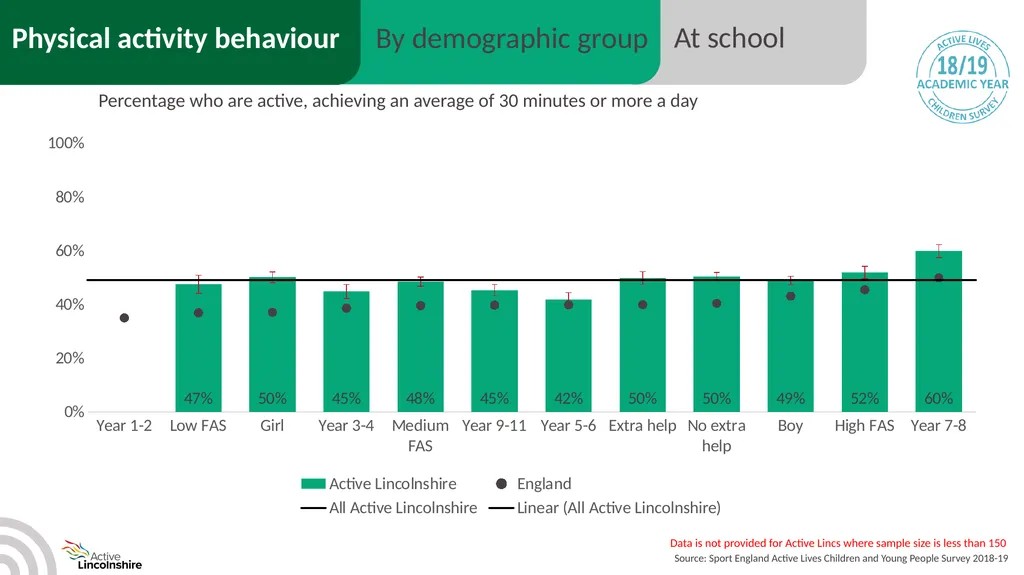
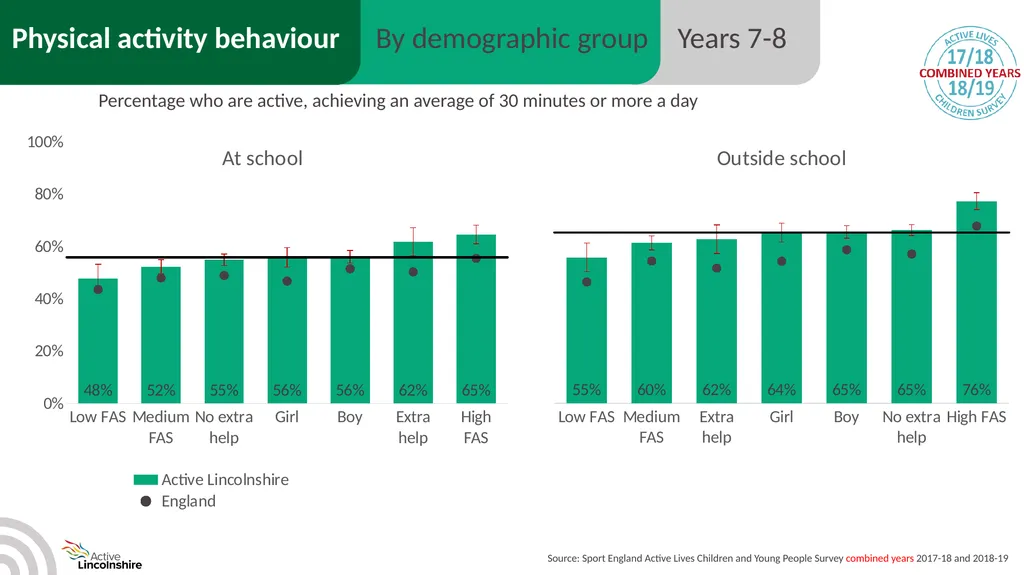
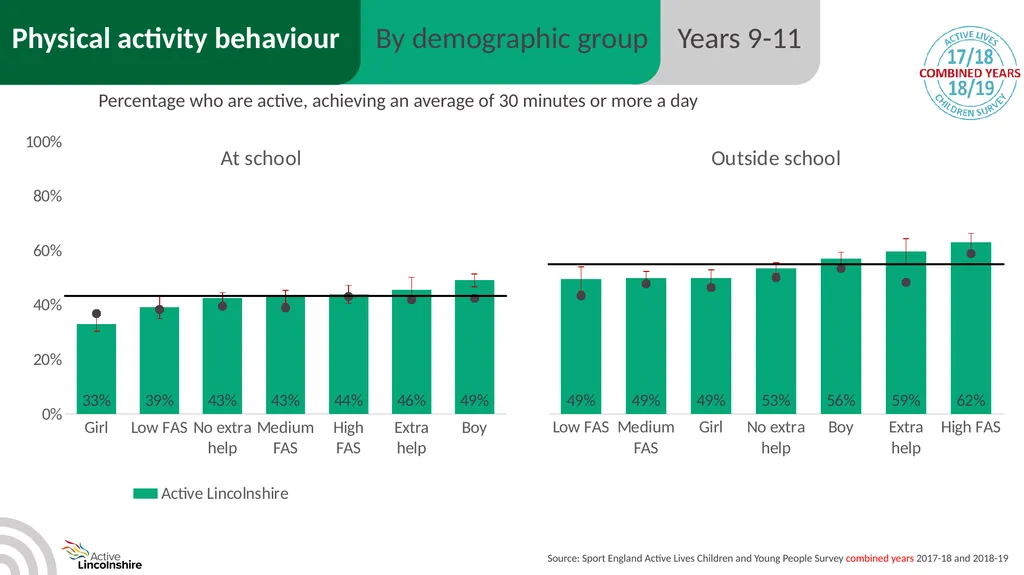
Source: Sport England Active Lives Children and Young People Survey 2018-19 Everywhere Physical activity behaviour By demographic group At school Percentage who are active, achieving an average of 30 minutes or more a day Data is not provided for Active Lincs where sample size is less than 150<br>
20
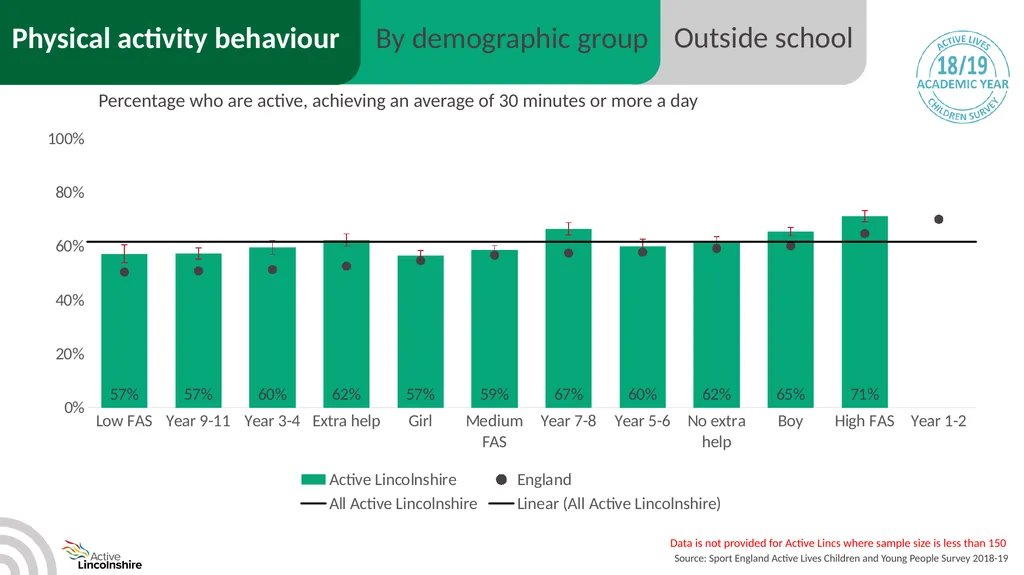
Source: Sport England Active Lives Children and Young People Survey 2018-19 Outside school Everywhere Physical activity behaviour By demographic group Percentage who are active, achieving an average of 30 minutes or more a day Data is not provided for Active Lincs where sample size is less than 150<br>
21
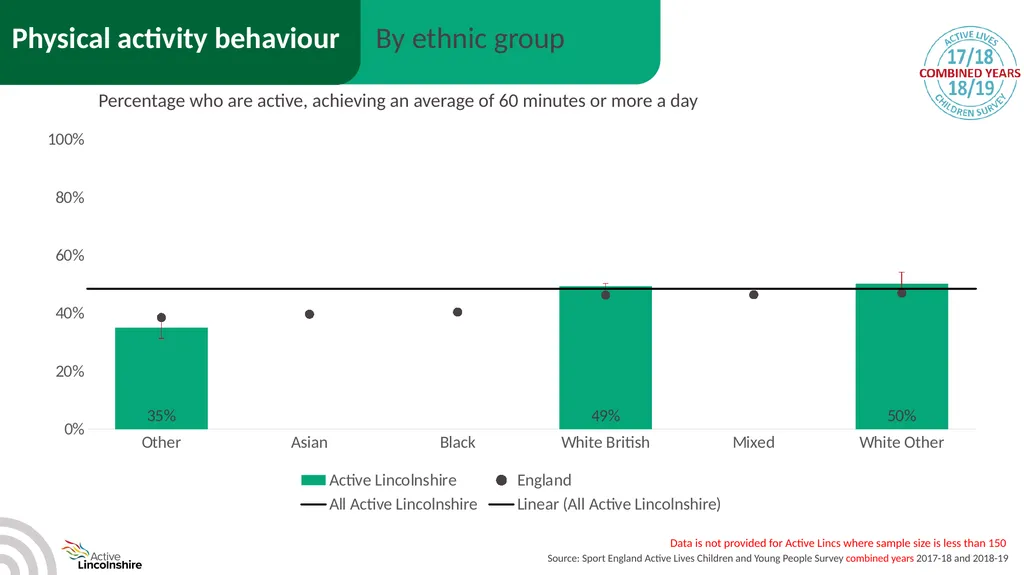
Source: Sport England Active Lives Children and Young People Survey combined years 2017-18 and 2018-19 Everywhere Physical activity behaviour By ethnic group Percentage who are active, achieving an average of 60 minutes or more a day Data is not provided for Active Lincs where sample size is less than 150<br>
22
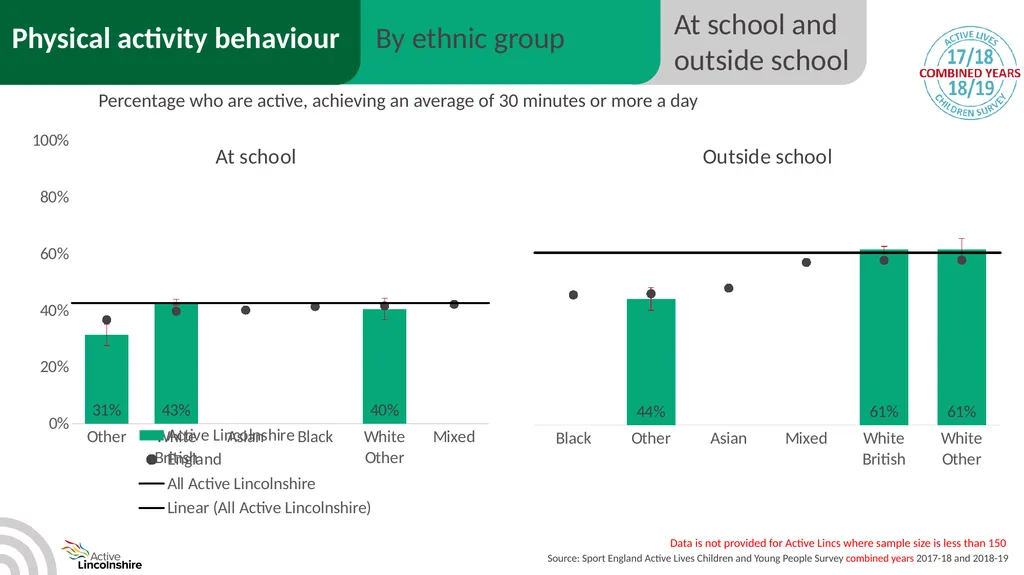
Source: Sport England Active Lives Children and Young People Survey combined years 2017-18 and 2018-19 Everywhere Physical activity behaviour By ethnic group At school and outside school Percentage who are active, achieving an average of 30 minutes or more a day Data is not provided for Active Lincs where sample size is less than 150<br>
23
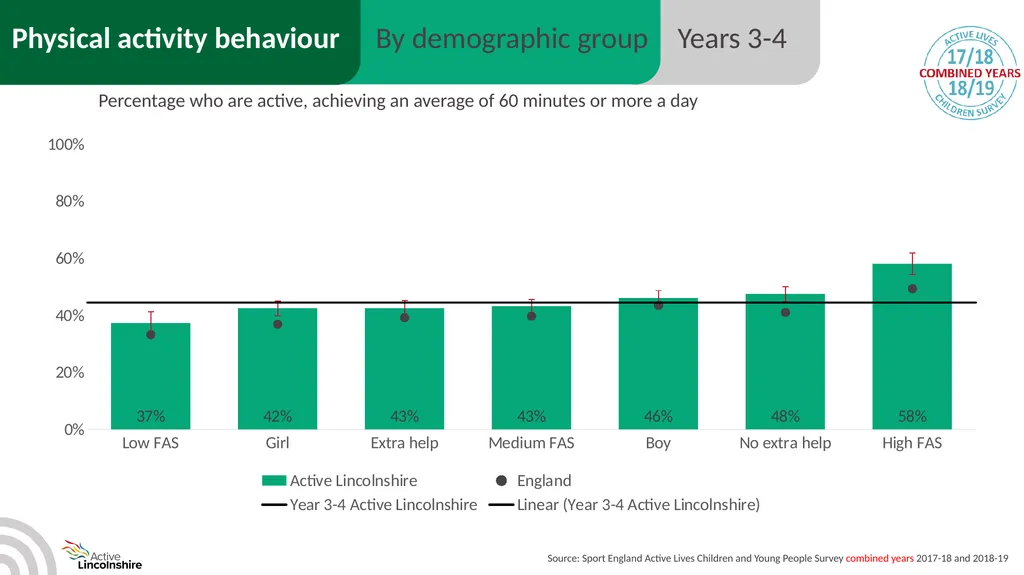
Source: Sport England Active Lives Children and Young People Survey combined years 2017-18 and 2018-19 Percentage who are active, achieving an average of 60 minutes or more a day<br>
24
Source: Sport England Active Lives Children and Young People Survey combined years 2017-18 and 2018-19 Percentage who are active, achieving an average of 30 minutes or more a day<br>
25
Source: Sport England Active Lives Children and Young People Survey combined years 2017-18 and 2018-19 Percentage who are active, achieving an average of 60 minutes or more a day<br>
26
Source: Sport England Active Lives Children and Young People Survey combined years 2017-18 and 2018-19 Percentage who are active, achieving an average of 30 minutes or more a day<br>
27
Source: Sport England Active Lives Children and Young People Survey combined years 2017-18 and 2018-19 Percentage who are active, achieving an average of 60 minutes or more a day<br>
28
Source: Sport England Active Lives Children and Young People Survey combined years 2017-18 and 2018-19 Percentage who are active, achieving an average of 30 minutes or more a day<br>
29
Source: Sport England Active Lives Children and Young People Survey combined years 2017-18 and 2018-19 Percentage who are active, achieving an average of 60 minutes or more a day<br>
30
Source: Sport England Active Lives Children and Young People Survey combined years 2017-18 and 2018-19 Percentage who are active, achieving an average of 30 minutes or more a day<br>
31
Source: Sport England Active Lives Children and Young People Survey combined years 2017-18 and 2018-19 Percentage who are active, achieving an average of 60 minutes or more a day<br>
32
Source: Sport England Active Lives Children and Young People Survey combined years 2017-18 and 2018-19 Percentage who are active, achieving an average of 30 minutes or more a day<br>
33
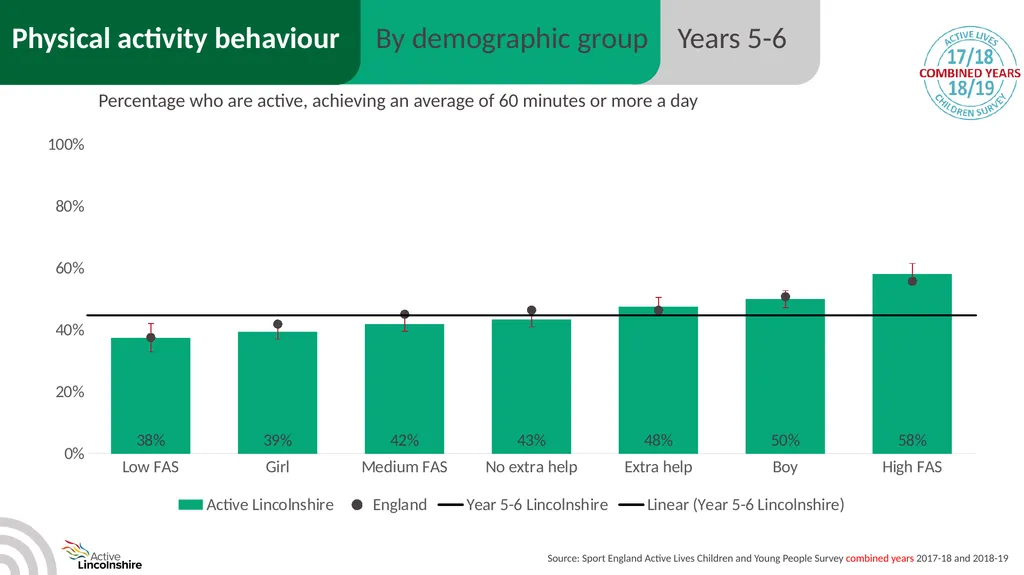
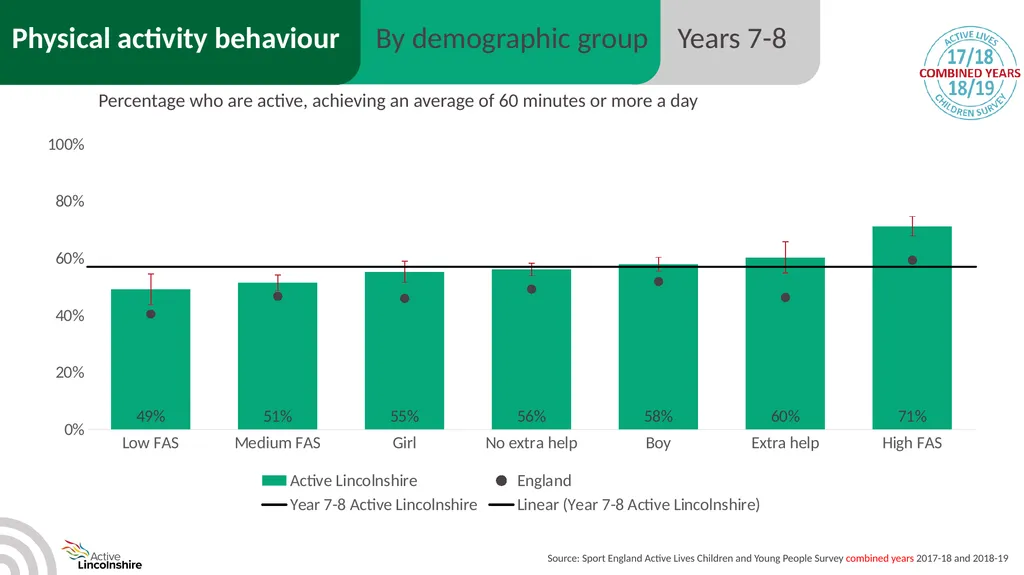
Source: Sport England Active Lives Children and Young People Survey combined years 2017-18 and 2018-19 Percentage who are active, achieving an average of 60 minutes or more a day<br>
34
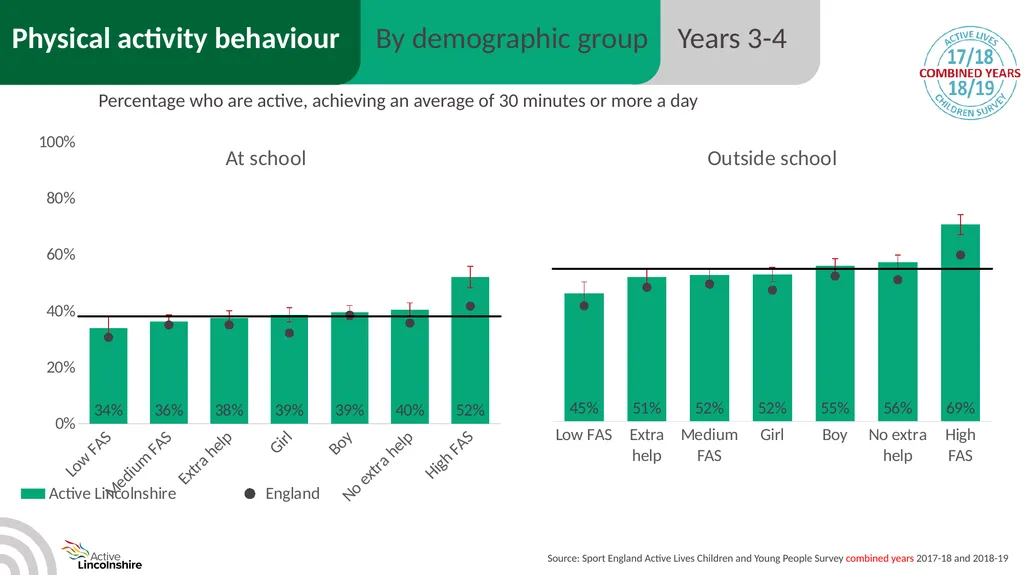
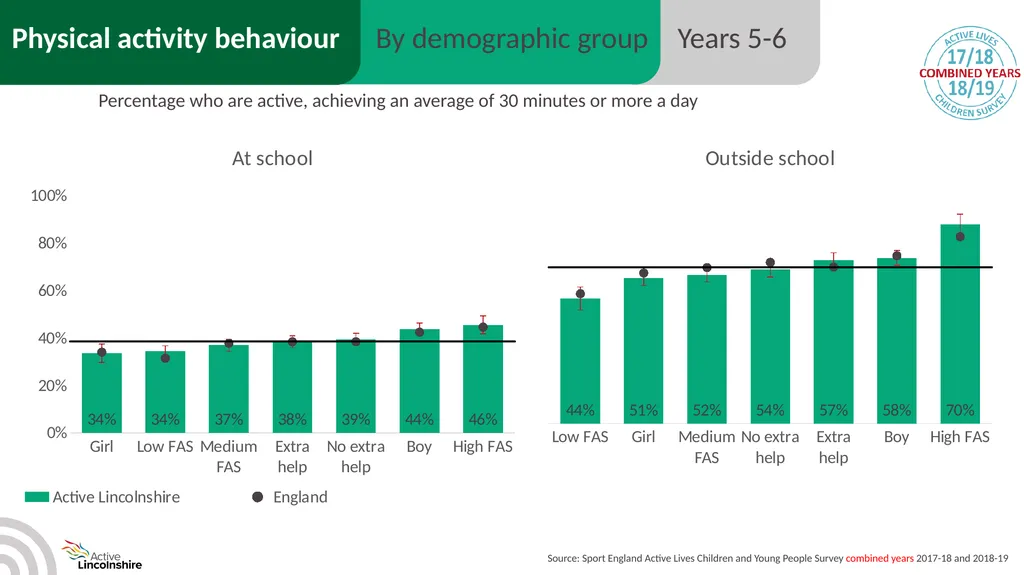
Source: Sport England Active Lives Children and Young People Survey combined years 2017-18 and 2018-19 Percentage who are active, achieving an average of 30 minutes or more a day<br>
35
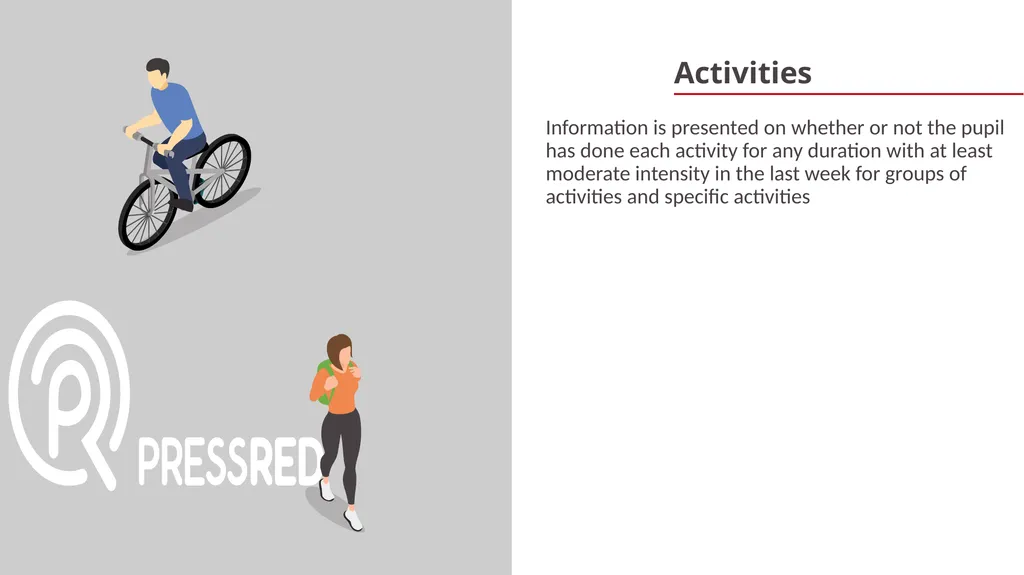
Information is presented on whether or not the pupil has done each activity for any duration with at least moderate intensity in the last week for groups of activities and specific activities Activities<br>
36
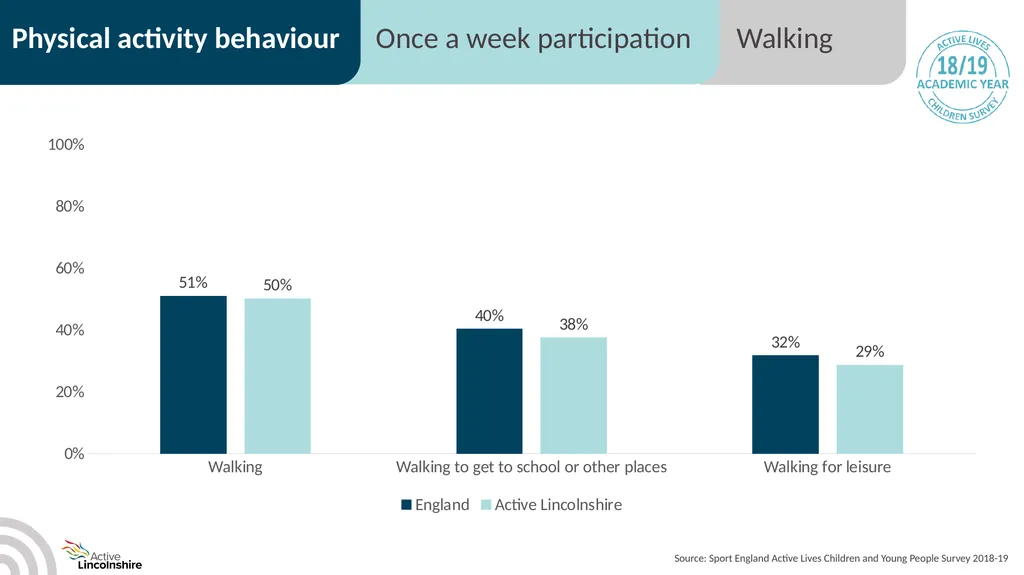
Source: Sport England Active Lives Children and Young People Survey 2018-19<br>
37
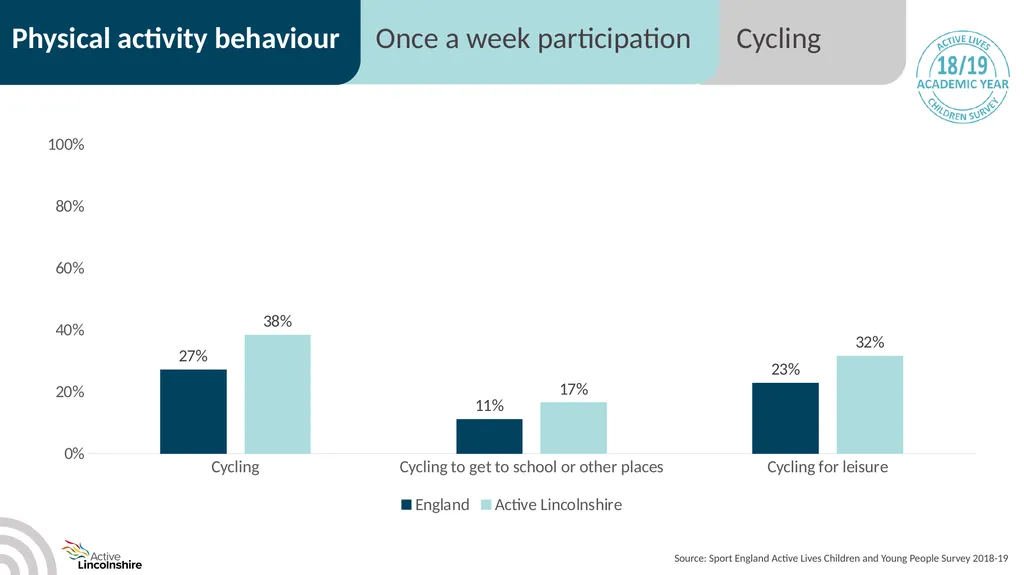
Source: Sport England Active Lives Children and Young People Survey 2018-19<br>
38
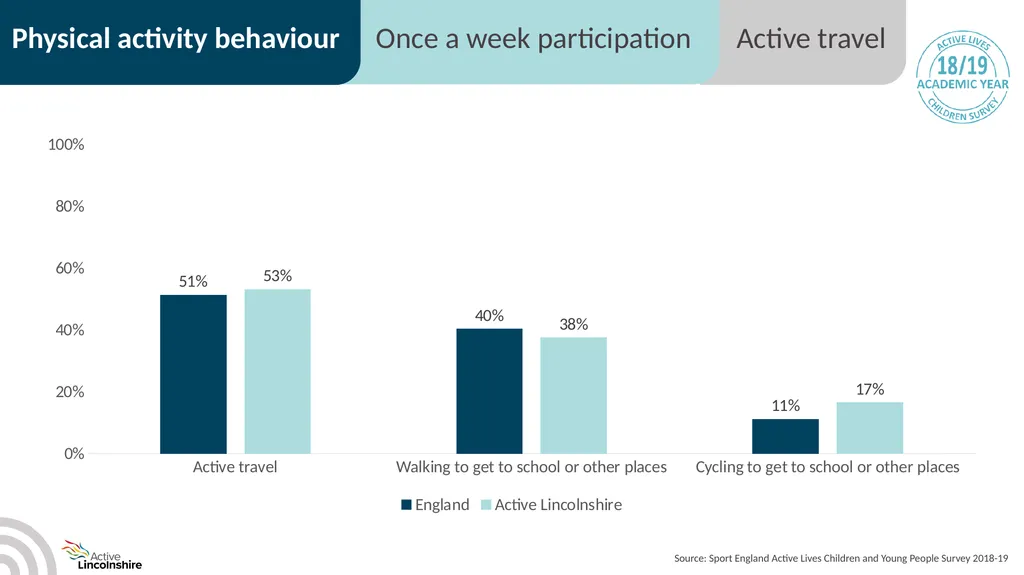
Source: Sport England Active Lives Children and Young People Survey 2018-19<br>
39
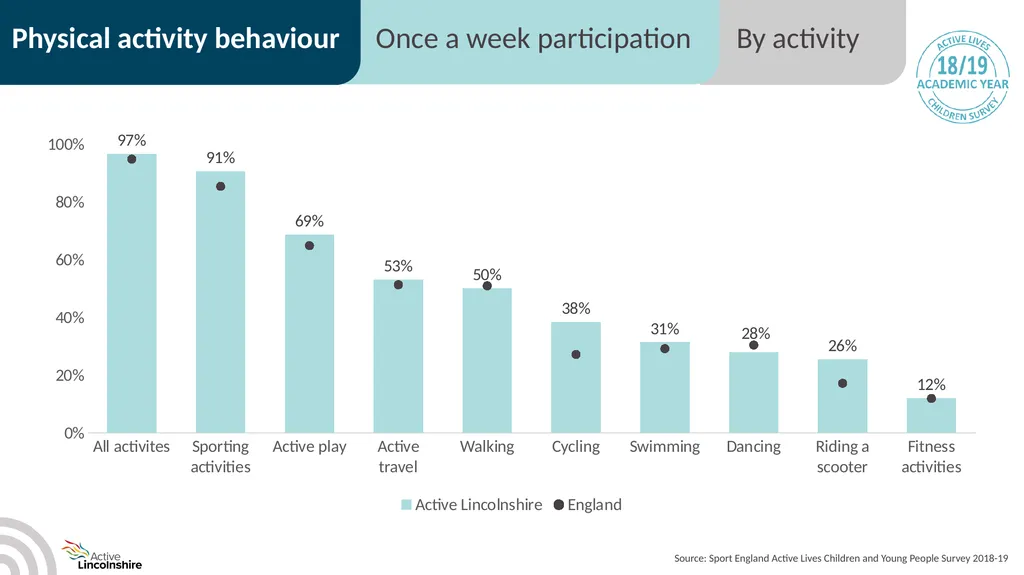
Source: Sport England Active Lives Children and Young People Survey 2018-19<br>
40
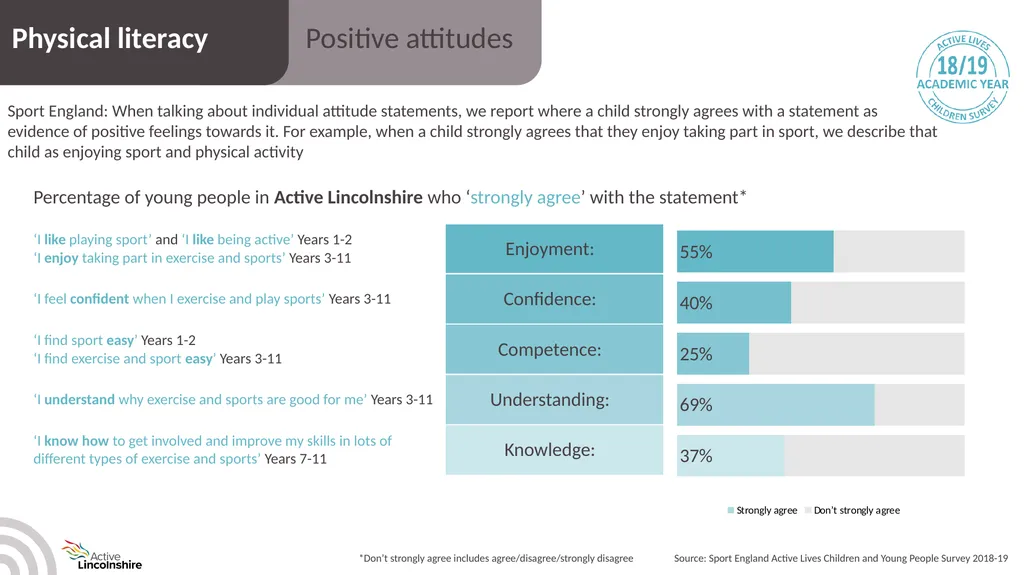
Physical literacy Physical literacy is about developing the fundamental movement skills that all children need. We measure it by gauging children’s positive feelings towards five elements: competence, understanding, enjoyment, knowledge and confidence, ie how strongly they agree that they enjoy being active or feel confident when they exercise etc.
When talking about individual attitude statements, we report where a child strongly agrees with a statement as evidence of positive feelings towards it. For example, when a child strongly agrees that they enjoy taking part in sport, we describe that child as enjoying sport and physical activity.<br>
When talking about individual attitude statements, we report where a child strongly agrees with a statement as evidence of positive feelings towards it. For example, when a child strongly agrees that they enjoy taking part in sport, we describe that child as enjoying sport and physical activity.<br>
41
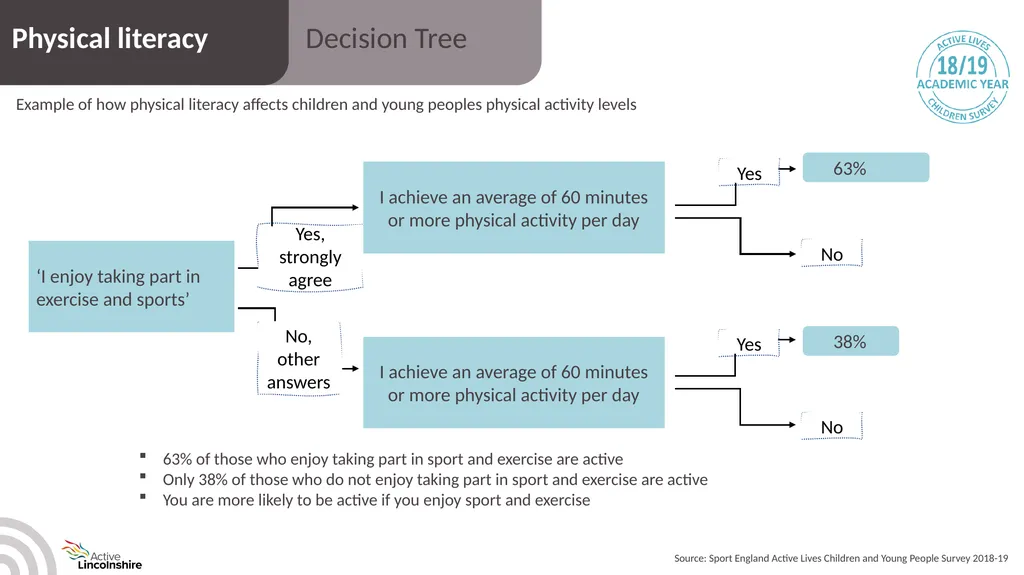
Source: Sport England Active Lives Children and Young People Survey 2018-19 Example of how physical literacy affects children and young peoples physical activity levels Decision Tree Physical literacy ‘I enjoy taking part in exercise and sports’ Yes, strongly agree I achieve an average of 60 minutes or more physical activity per day I achieve an average of 60 minutes or more physical activity per day Yes No Yes No 63% 38% 63% of those who enjoy taking part in sport and exercise are active
Only 38% of those who do not enjoy taking part in sport and exercise are active
You are more likely to be active if you enjoy sport and exercise No, other answers<br>
Only 38% of those who do not enjoy taking part in sport and exercise are active
You are more likely to be active if you enjoy sport and exercise No, other answers<br>
42
*Don’t strongly agree includes agree/disagree/strongly disagree Source: Sport England Active Lives Children and Young People Survey 2018-19 Sport England: When talking about individual attitude statements, we report where a child strongly agrees with a statement as evidence of positive feelings towards it. For example, when a child strongly agrees that they enjoy taking part in sport, we describe that child as enjoying sport and physical activity Positive attitudes Physical literacy<br>
43
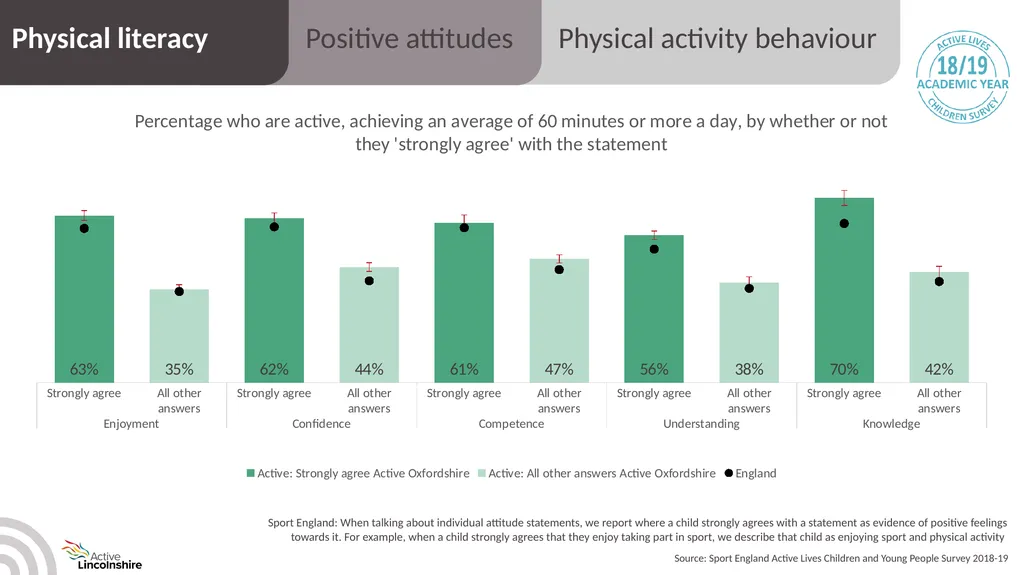
Source: Sport England Active Lives Children and Young People Survey 2018-19 Sport England: When talking about individual attitude statements, we report where a child strongly agrees with a statement as evidence of positive feelings towards it. For example, when a child strongly agrees that they enjoy taking part in sport, we describe that child as enjoying sport and physical activity<br>
44
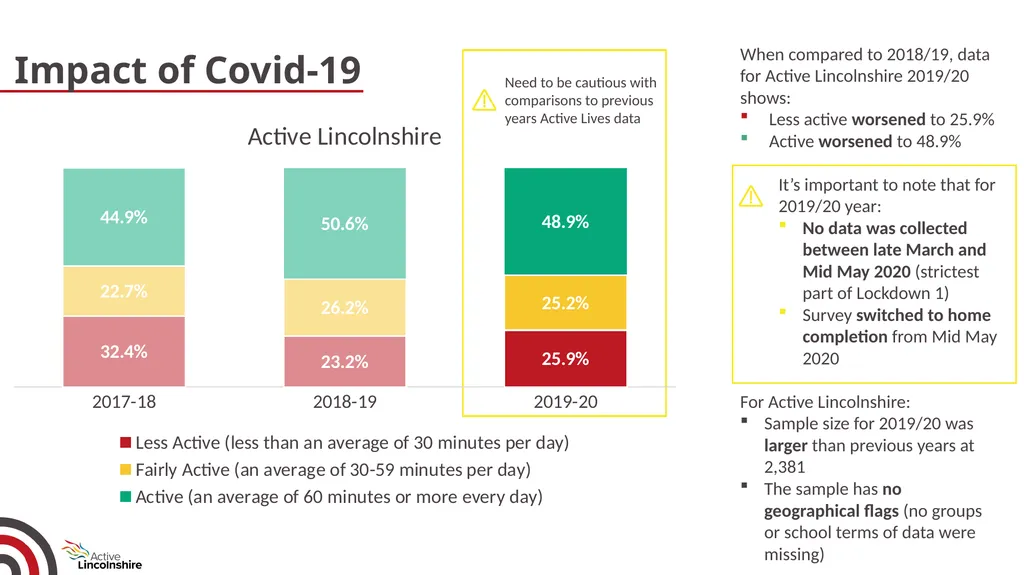
Impact of Covid-19 Need to be cautious with comparisons to previous years Active Lives data When compared to 2018/19, data for Active Lincolnshire 2019/20 shows:
Less active worsened to 25.9%
Active worsened to 48.9%
It’s important to note that for 2019/20 year:
No data was collected between late March and Mid May 2020 (strictest part of Lockdown 1)
Survey switched to home completion from Mid May 2020
For Active Lincolnshire:
Sample size for 2019/20 was larger than previous years at 2,381
The sample has no geographical flags (no groups or school terms of data were missing)<br>
Less active worsened to 25.9%
Active worsened to 48.9%
It’s important to note that for 2019/20 year:
No data was collected between late March and Mid May 2020 (strictest part of Lockdown 1)
Survey switched to home completion from Mid May 2020
For Active Lincolnshire:
Sample size for 2019/20 was larger than previous years at 2,381
The sample has no geographical flags (no groups or school terms of data were missing)<br>
45
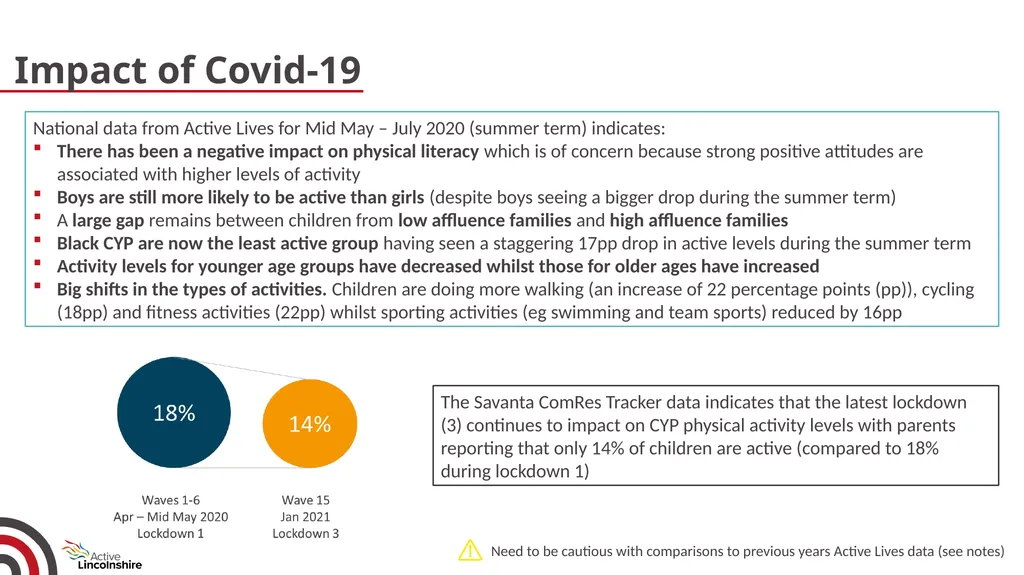
Impact of Covid-19 National data from Active Lives for Mid May – July 2020 (summer term) indicates:
There has been a negative impact on physical literacy which is of concern because strong positive attitudes are associated with higher levels of activity
Boys are still more likely to be active than girls (despite boys seeing a bigger drop during the summer term)
A large gap remains between children from low affluence families and high affluence families
Black CYP are now the least active group having seen a staggering 17pp drop in active levels during the summer term
Activity levels for younger age groups have decreased whilst those for older ages have increased
Big shifts in the types of activities. Children are doing more walking (an increase of 22 percentage points (pp)), cycling (18pp) and fitness activities (22pp) whilst sporting activities (eg swimming and team sports) reduced by 16pp The Savanta ComRes Tracker data indicates that the latest lockdown (3) continues to impact on CYP physical activity levels with parents reporting that only 14% of children are active (compared to 18% during lockdown 1) Need to be cautious with comparisons to previous years Active Lives data (see notes)<br>
There has been a negative impact on physical literacy which is of concern because strong positive attitudes are associated with higher levels of activity
Boys are still more likely to be active than girls (despite boys seeing a bigger drop during the summer term)
A large gap remains between children from low affluence families and high affluence families
Black CYP are now the least active group having seen a staggering 17pp drop in active levels during the summer term
Activity levels for younger age groups have decreased whilst those for older ages have increased
Big shifts in the types of activities. Children are doing more walking (an increase of 22 percentage points (pp)), cycling (18pp) and fitness activities (22pp) whilst sporting activities (eg swimming and team sports) reduced by 16pp The Savanta ComRes Tracker data indicates that the latest lockdown (3) continues to impact on CYP physical activity levels with parents reporting that only 14% of children are active (compared to 18% during lockdown 1) Need to be cautious with comparisons to previous years Active Lives data (see notes)<br>
46
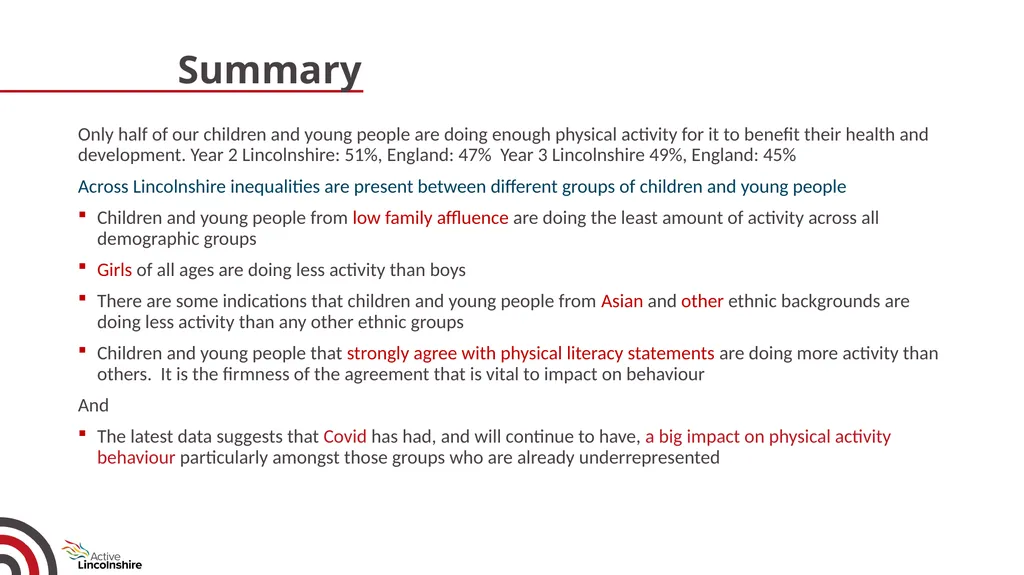
Summary Only half of our children and young people are doing enough physical activity for it to benefit their health and development. Year 2 Lincolnshire: 51%, England: 47% Year 3 Lincolnshire 49%, England: 45%
Across Lincolnshire inequalities are present between different groups of children and young people
Children and young people from low family affluence are doing the least amount of activity across all demographic groups
Girls of all ages are doing less activity than boys
There are some indications that children and young people from Asian and other ethnic backgrounds are doing less activity than any other ethnic groups
Children and young people that strongly agree with physical literacy statements are doing more activity than others. It is the firmness of the agreement that is vital to impact on behaviour
And
The latest data suggests that Covid has had, and will continue to have, a big impact on physical activity behaviour particularly amongst those groups who are already underrepresented<br>
Across Lincolnshire inequalities are present between different groups of children and young people
Children and young people from low family affluence are doing the least amount of activity across all demographic groups
Girls of all ages are doing less activity than boys
There are some indications that children and young people from Asian and other ethnic backgrounds are doing less activity than any other ethnic groups
Children and young people that strongly agree with physical literacy statements are doing more activity than others. It is the firmness of the agreement that is vital to impact on behaviour
And
The latest data suggests that Covid has had, and will continue to have, a big impact on physical activity behaviour particularly amongst those groups who are already underrepresented<br>
47
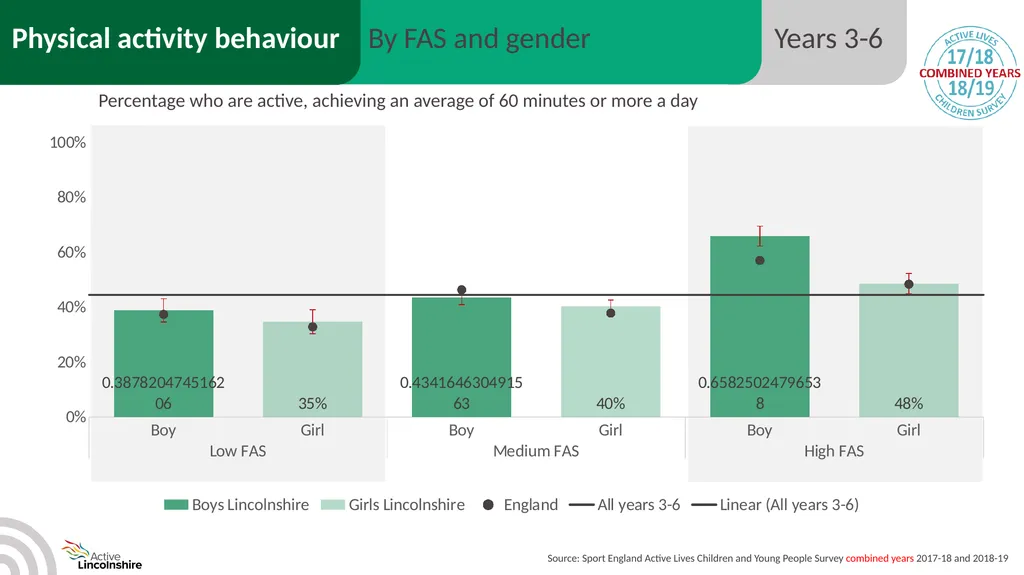
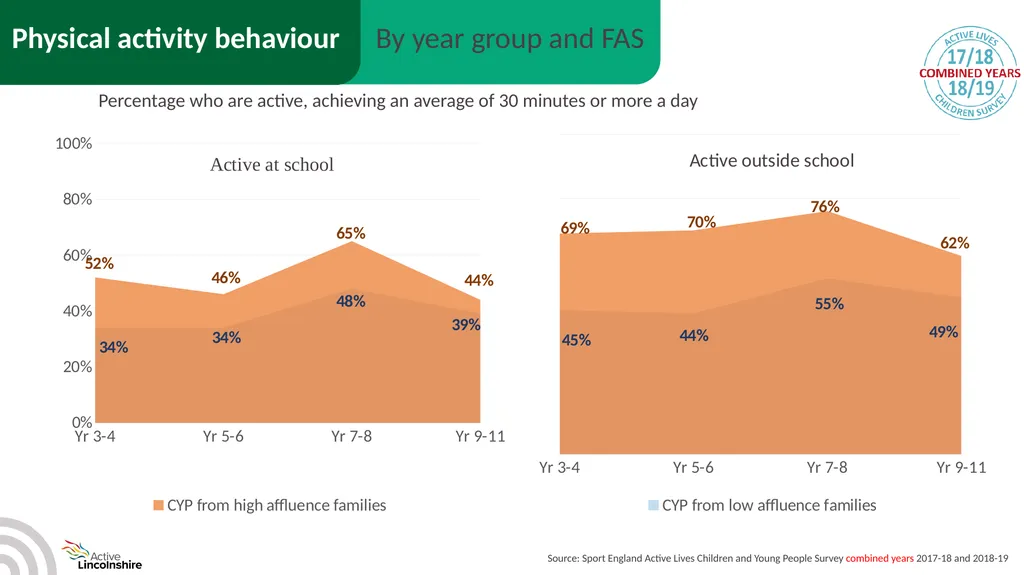
Source: Sport England Active Lives Children and Young People Survey combined years 2017-18 and 2018-19 Physical activity behaviour By year group and FAS Percentage who are active, achieving an average of 30 minutes or more a day<br>
48
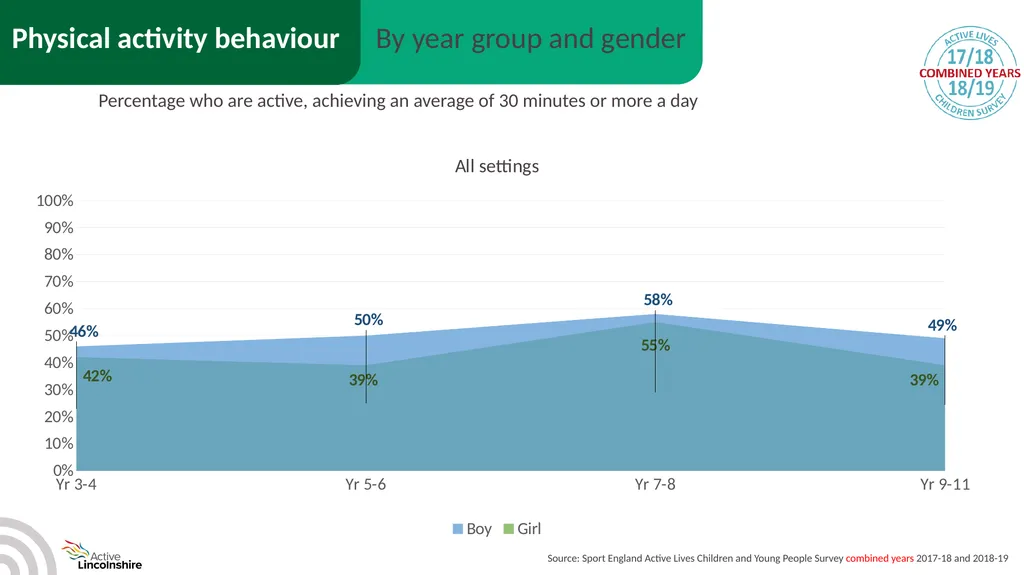
Source: Sport England Active Lives Children and Young People Survey combined years 2017-18 and 2018-19 Physical activity behaviour By year group and gender Percentage who are active, achieving an average of 30 minutes or more a day<br>
49
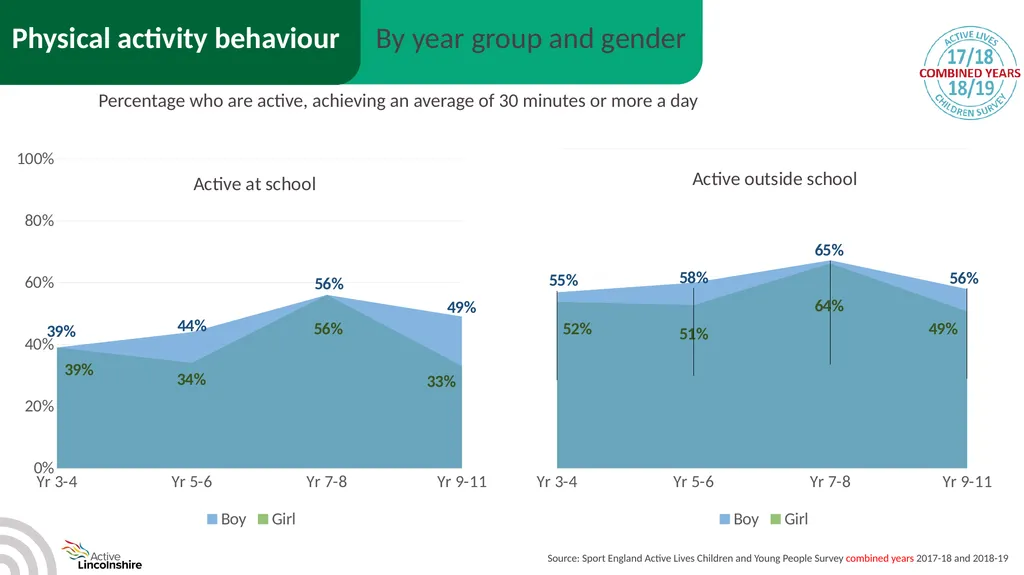
Source: Sport England Active Lives Children and Young People Survey combined years 2017-18 and 2018-19 Physical activity behaviour By year group and gender Percentage who are active, achieving an average of 30 minutes or more a day<br>
50
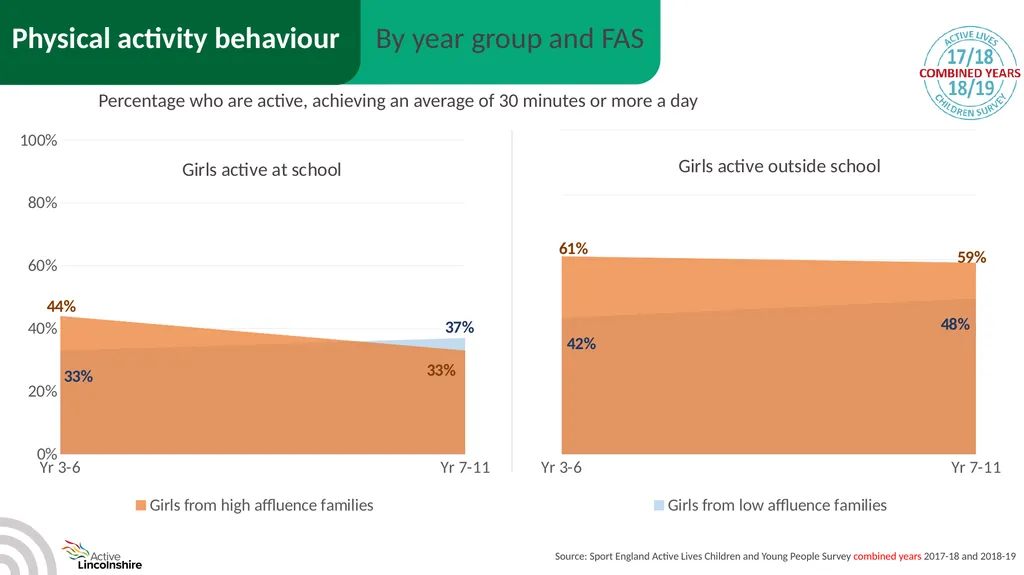
Source: Sport England Active Lives Children and Young People Survey combined years 2017-18 and 2018-19 Physical activity behaviour By year group and FAS Percentage who are active, achieving an average of 30 minutes or more a day<br>
51
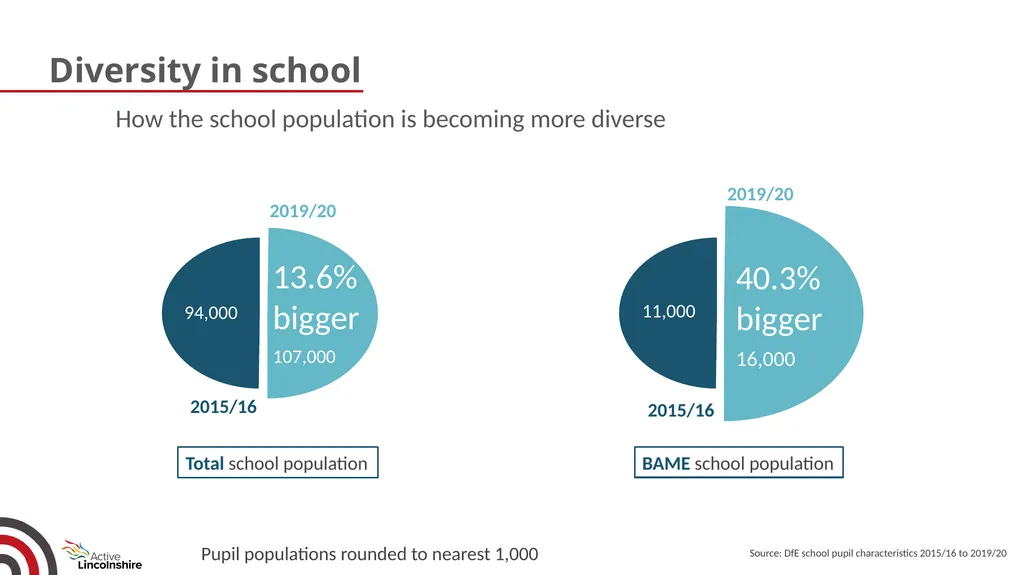
2015/16 13.6%
bigger
107,000 11,000 Total school population BAME school population Pupil populations rounded to nearest 1,000 40.3%
bigger
16,000 94,000 2019/20 2019/20 2015/16 Diversity in school How the school population is becoming more diverse Source: DfE school pupil characteristics 2015/16 to 2019/20<br>
bigger
107,000 11,000 Total school population BAME school population Pupil populations rounded to nearest 1,000 40.3%
bigger
16,000 94,000 2019/20 2019/20 2015/16 Diversity in school How the school population is becoming more diverse Source: DfE school pupil characteristics 2015/16 to 2019/20<br>
52
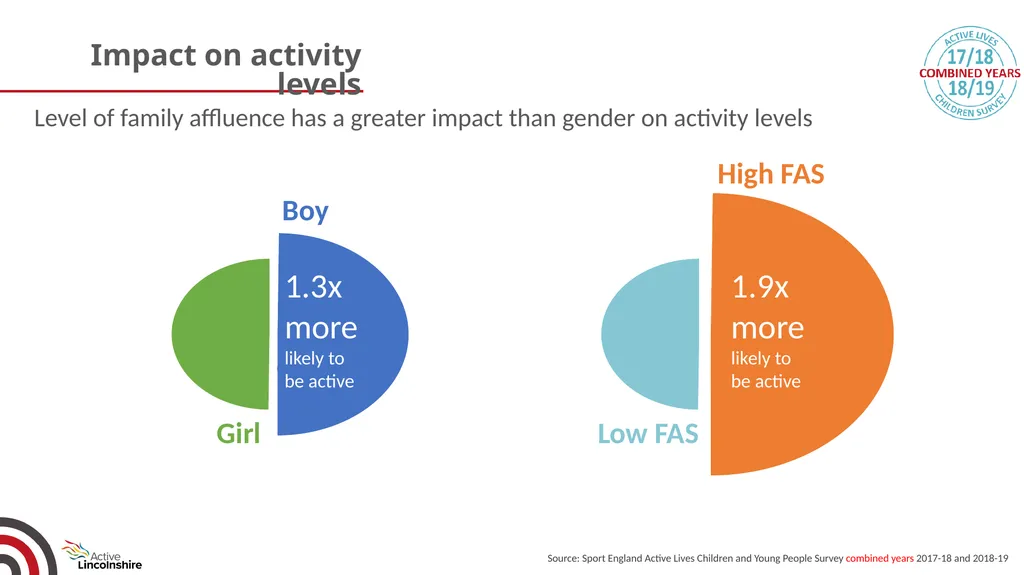
Impact on activity levels Level of family affluence has a greater impact than gender on activity levels Girl Activity 1.3x
more
likely to
be active 1.9x
more
likely to
be active Girl Boy High FAS Low FAS Source: Sport England Active Lives Children and Young People Survey combined years 2017-18 and 2018-19<br>
more
likely to
be active 1.9x
more
likely to
be active Girl Boy High FAS Low FAS Source: Sport England Active Lives Children and Young People Survey combined years 2017-18 and 2018-19<br>
53
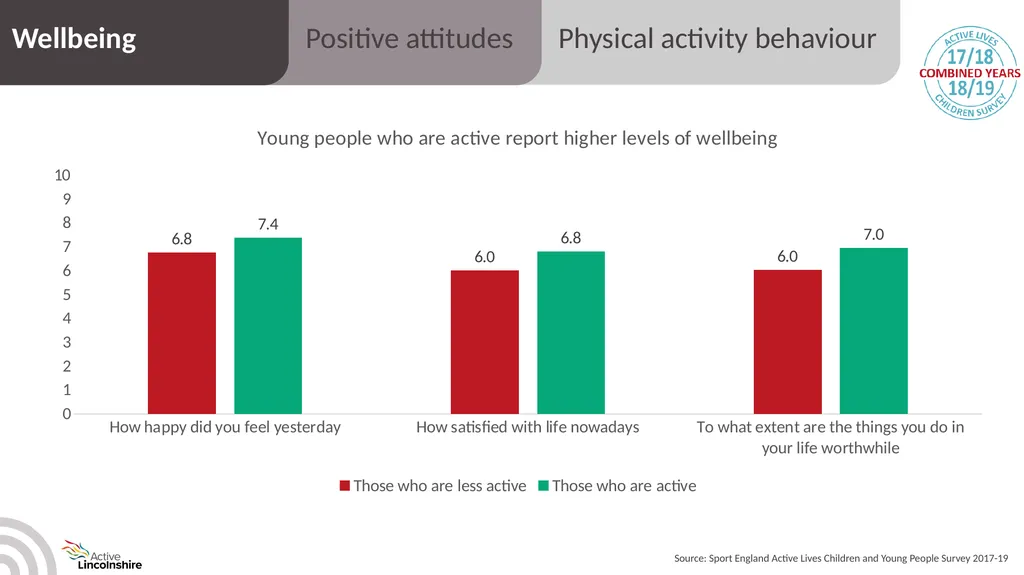
Source: Sport England Active Lives Children and Young People Survey 2017-19<br>