
Classification and Compensation Study Final


Description: Classification and Compensation Study Final Presentation Ulster County, NY Project Overview Methodology Data Collection: project planning meetings, data requested from the County, Position Analysis Questionnaires (PAQs) completed by
Related Topics
Download Presentation
"Classification and Compensation Study Final" is the property of its rightful owner. Permission is granted to download and print the materials on this website for personal, non-commercial use only, and to display it on your personal computer provided you do not modify the materials and that you retain all copyright notices contained in the materials. By downloading content from our website, you accept the terms of this agreement.
Presentation Transcript
slide1. Classification and Compensation Study
Final Presentation Ulster County, NY<br>
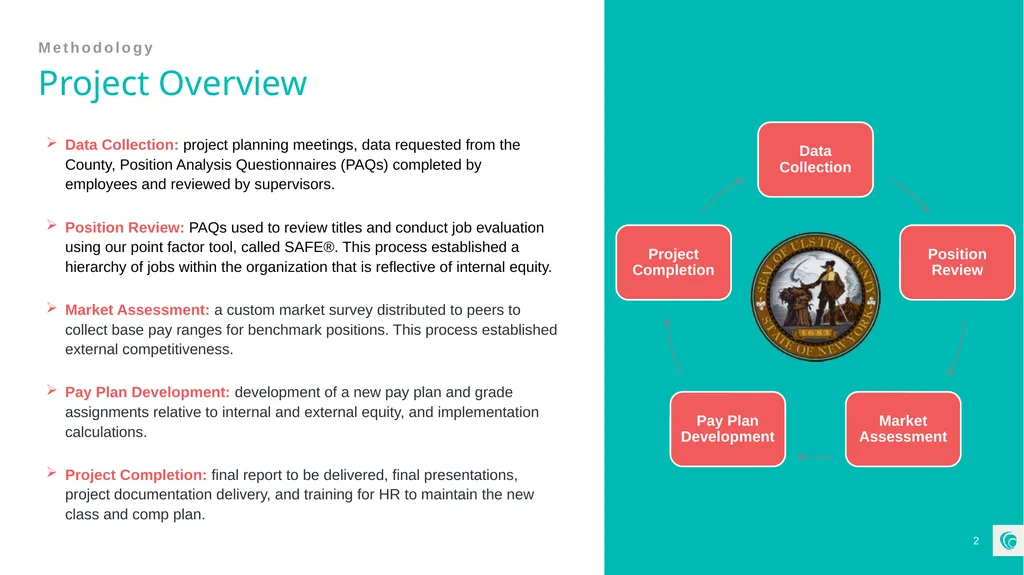
slide2. Project Overview Methodology Data Collection: project planning meetings, data requested from the County, Position Analysis Questionnaires (PAQs) completed by employees and reviewed by supervisors.
Position Review: PAQs used to review titles and conduct job evaluation using our point factor tool, called SAFE®. This process established a hierarchy of jobs within the organization that is reflective of internal equity.
Market Assessment: a custom market survey distributed to peers to collect base pay ranges for benchmark positions. This process established external competitiveness.
Pay Plan Development: development of a new pay plan and grade assignments relative to internal and external equity, and implementation calculations.
Project Completion: final report to be delivered, final presentations, project documentation delivery, and training for HR to maintain the new class and comp plan.<br>
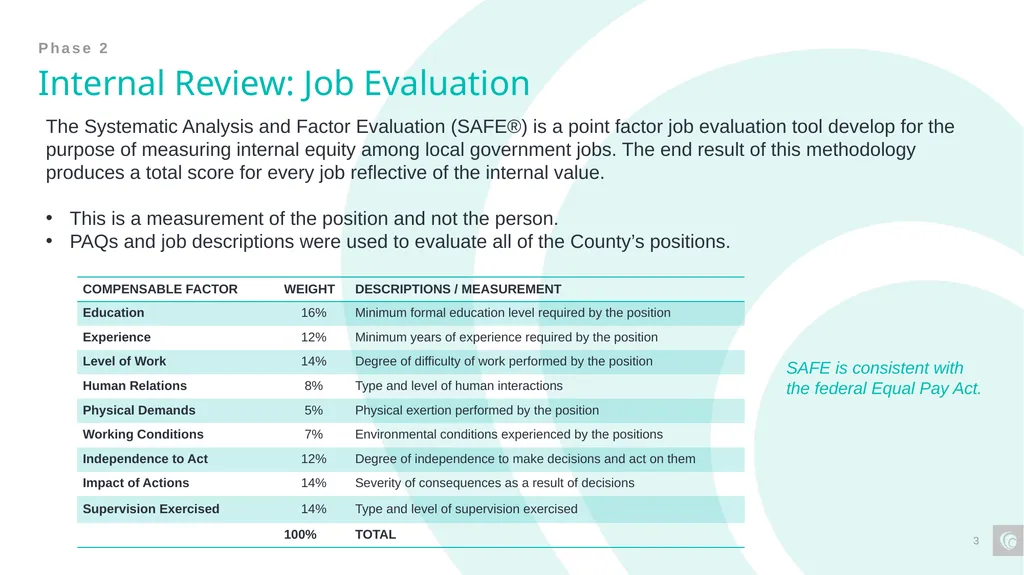
slide3. Internal Review: Job Evaluation Phase 2 The Systematic Analysis and Factor Evaluation (SAFE®) is a point factor job evaluation tool develop for the purpose of measuring internal equity among local government jobs. The end result of this methodology produces a total score for every job reflective of the internal value.
This is a measurement of the position and not the person.
PAQs and job descriptions were used to evaluate all of the County’s positions. SAFE is consistent with the federal Equal Pay Act.<br>
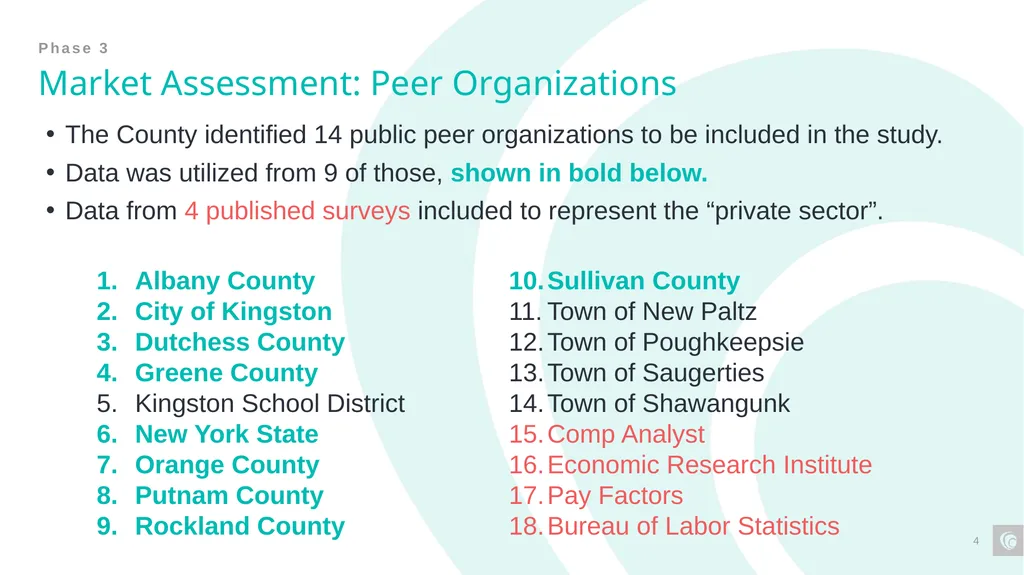
slide4. Market Assessment: Peer Organizations The County identified 14 public peer organizations to be included in the study.
Data was utilized from 9 of those, shown in bold below.
Data from 4 published surveys included to represent the “private sector”. Albany County
City of Kingston
Dutchess County
Greene County
Kingston School District
New York State
Orange County
Putnam County
Rockland County
Sullivan County
Town of New Paltz
Town of Poughkeepsie
Town of Saugerties
Town of Shawangunk
Comp Analyst
Economic Research Institute
Pay Factors
Bureau of Labor Statistics Phase 3<br>
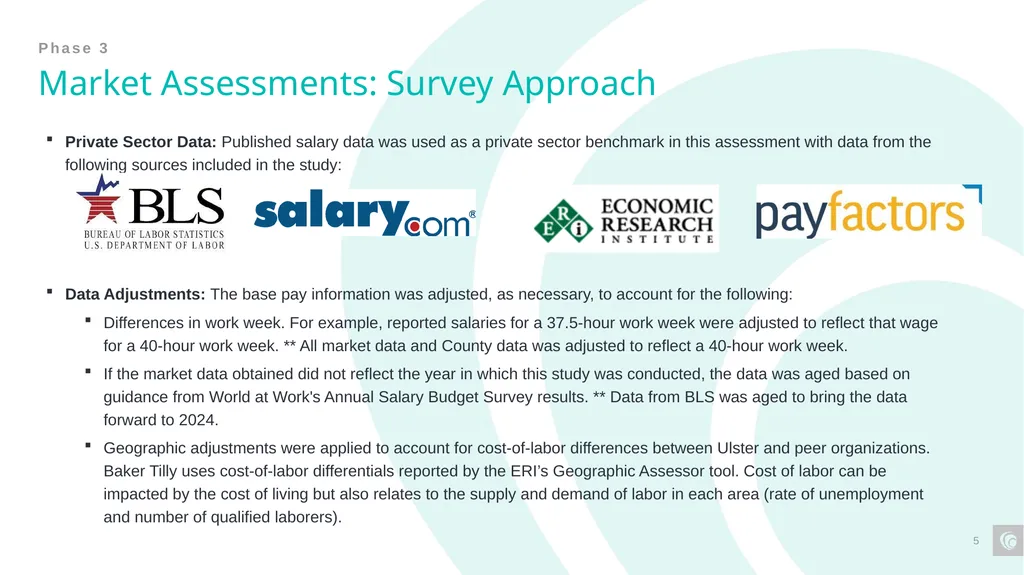
slide5. Market Assessments: Survey Approach Phase 3 Private Sector Data: Published salary data was used as a private sector benchmark in this assessment with data from the following sources included in the study:
Data Adjustments: The base pay information was adjusted, as necessary, to account for the following:
Differences in work week. For example, reported salaries for a 37.5-hour work week were adjusted to reflect that wage for a 40-hour work week. ** All market data and County data was adjusted to reflect a 40-hour work week.
If the market data obtained did not reflect the year in which this study was conducted, the data was aged based on guidance from World at Work's Annual Salary Budget Survey results. ** Data from BLS was aged to bring the data forward to 2024.
Geographic adjustments were applied to account for cost-of-labor differences between Ulster and peer organizations. Baker Tilly uses cost-of-labor differentials reported by the ERI’s Geographic Assessor tool. Cost of labor can be impacted by the cost of living but also relates to the supply and demand of labor in each area (rate of unemployment and number of qualified laborers).<br>
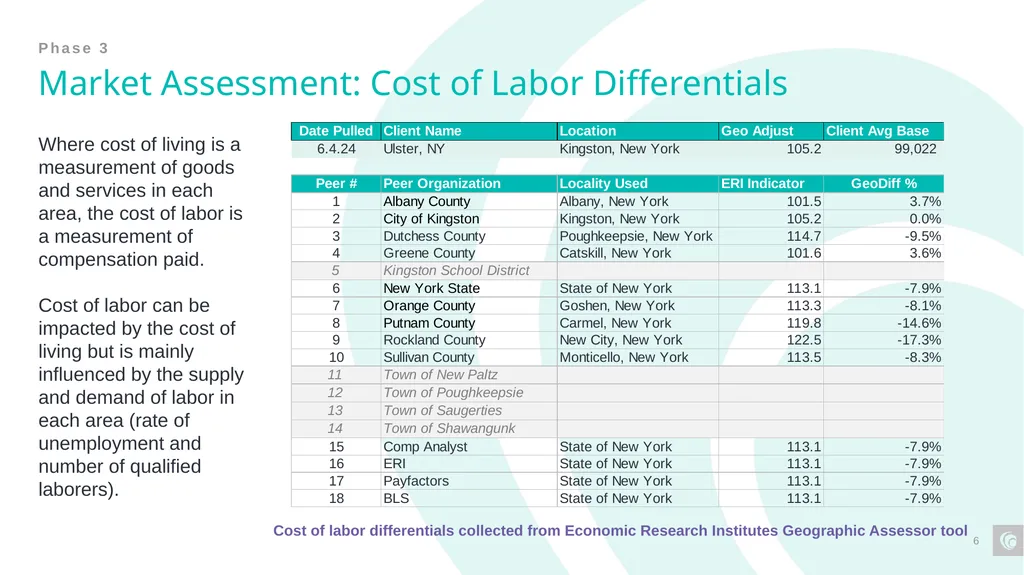
slide6. Market Assessment: Cost of Labor Differentials Where cost of living is a measurement of goods and services in each area, the cost of labor is a measurement of compensation paid.
Cost of labor can be impacted by the cost of living but is mainly influenced by the supply and demand of labor in each area (rate of unemployment and number of qualified laborers). Cost of labor differentials collected from Economic Research Institutes Geographic Assessor tool Phase 3<br>
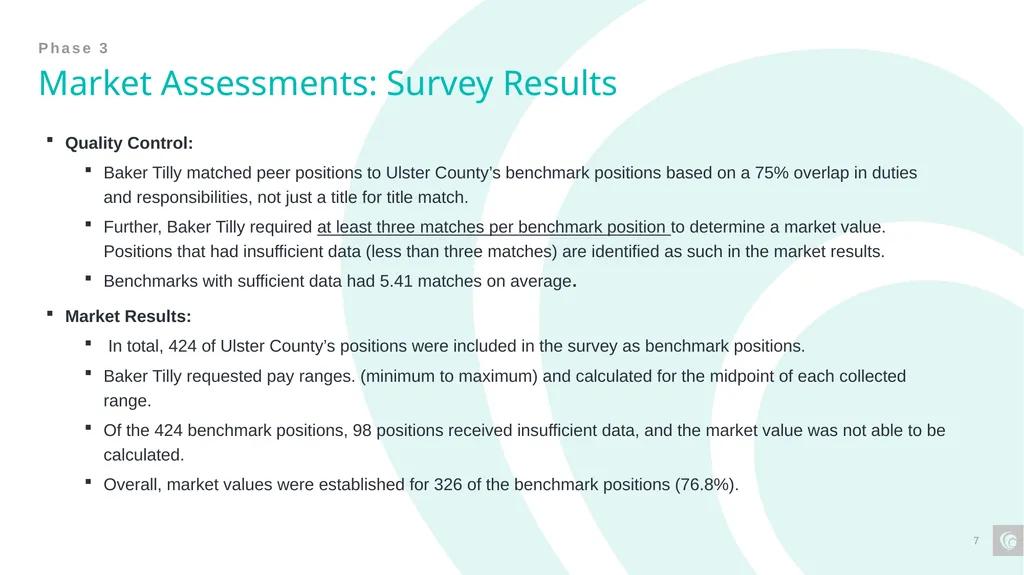
slide7. Market Assessments: Survey Results Phase 3 Quality Control:
Baker Tilly matched peer positions to Ulster County’s benchmark positions based on a 75% overlap in duties and responsibilities, not just a title for title match.
Further, Baker Tilly required at least three matches per benchmark position to determine a market value. Positions that had insufficient data (less than three matches) are identified as such in the market results.
Benchmarks with sufficient data had 5.41 matches on average.
Market Results:
In total, 424 of Ulster County’s positions were included in the survey as benchmark positions.
Baker Tilly requested pay ranges. (minimum to maximum) and calculated for the midpoint of each collected range.
Of the 424 benchmark positions, 98 positions received insufficient data, and the market value was not able to be calculated.
Overall, market values were established for 326 of the benchmark positions (76.8%).<br>
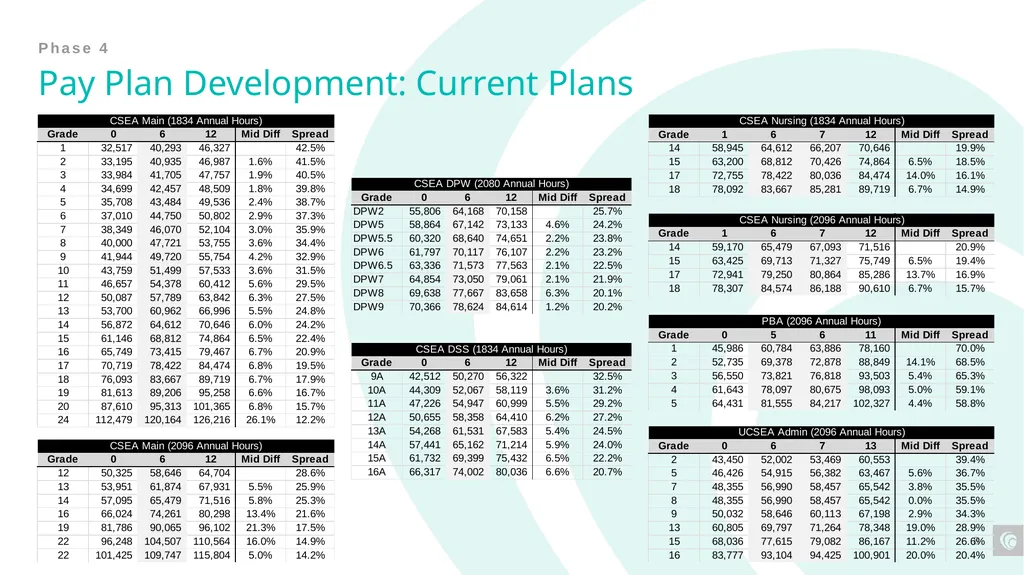
slide8. Pay Plan Development: Current Plans Phase 4<br>
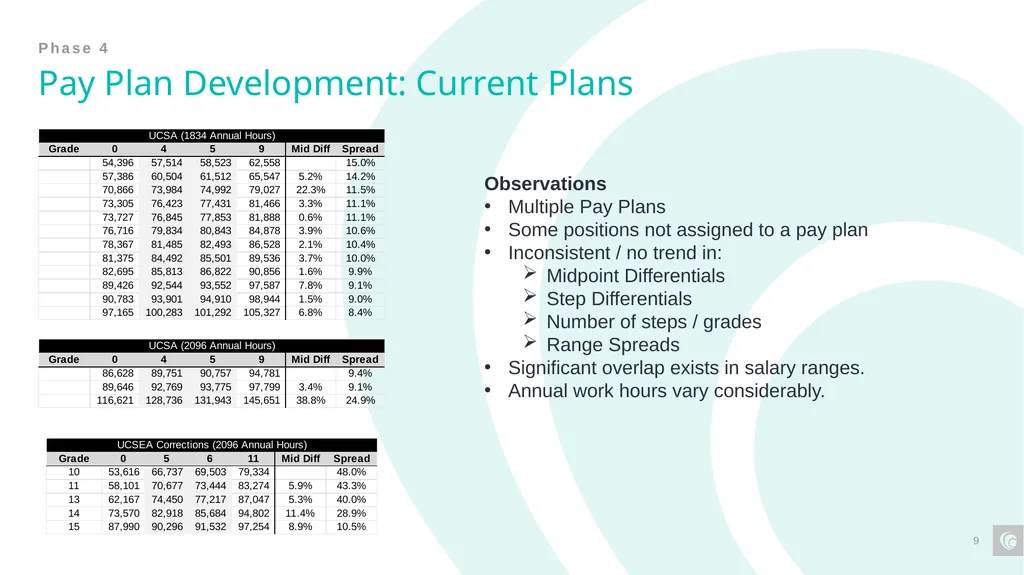
slide9. Pay Plan Development: Current Plans Phase 4 Observations
Multiple Pay Plans
Some positions not assigned to a pay plan
Inconsistent / no trend in:
Midpoint Differentials
Step Differentials
Number of steps / grades
Range Spreads
Significant overlap exists in salary ranges.
Annual work hours vary considerably.<br>
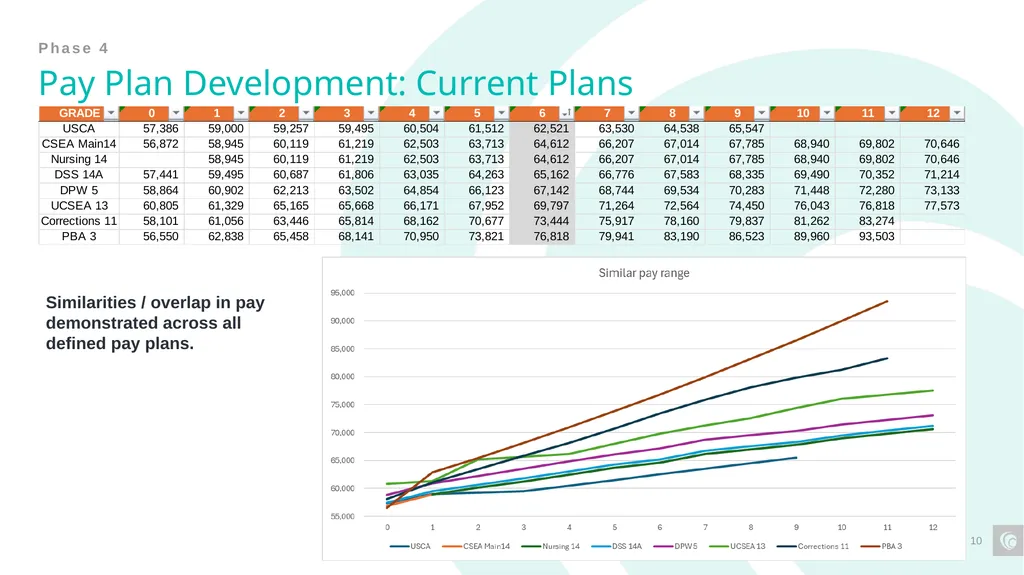
slide10. Pay Plan Development: Current Plans Phase 4 Similarities / overlap in pay demonstrated across all defined pay plans.<br>
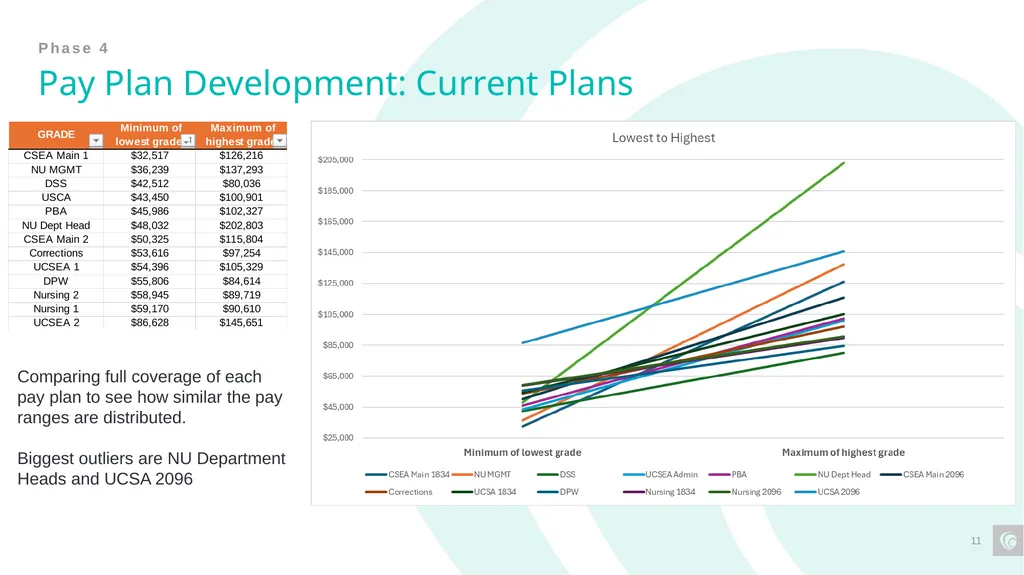
slide11. Pay Plan Development: Current Plans Phase 4 Comparing full coverage of each pay plan to see how similar the pay ranges are distributed.
Biggest outliers are NU Department Heads and UCSA 2096<br>
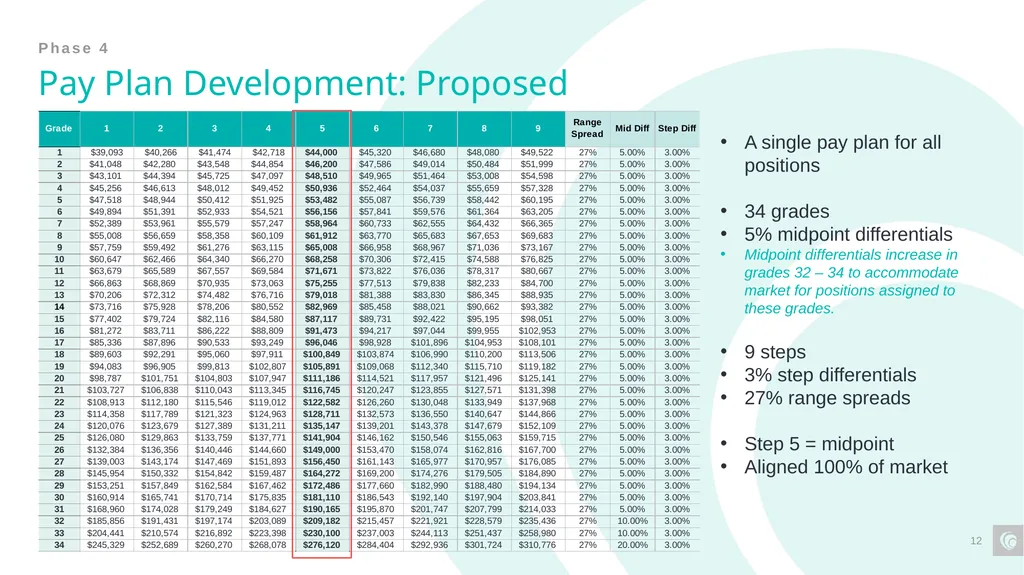
slide12. Pay Plan Development: Proposed Phase 4 A single pay plan for all positions
34 grades
5% midpoint differentials
Midpoint differentials increase in grades 32 – 34 to accommodate market for positions assigned to these grades.
9 steps
3% step differentials
27% range spreads
Step 5 = midpoint
Aligned 100% of market<br>
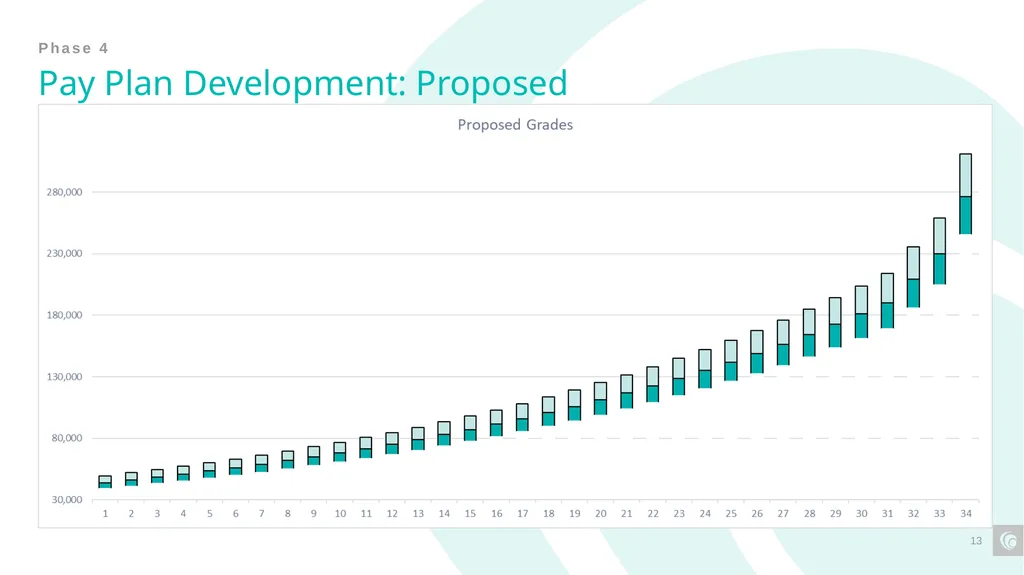
slide13. Pay Plan Development: Proposed Phase 4<br>
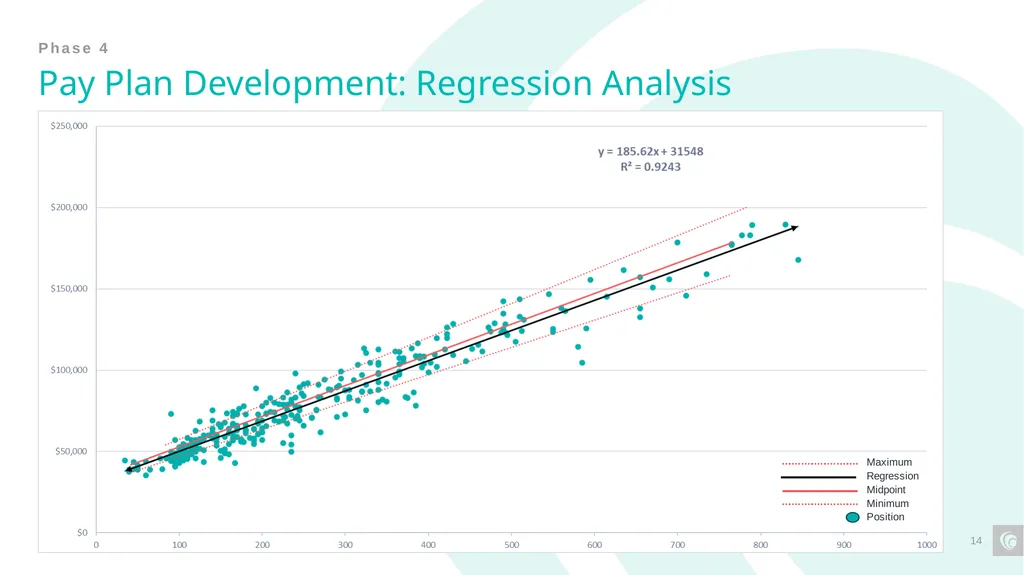
slide14. Pay Plan Development: Regression Analysis Phase 4<br>
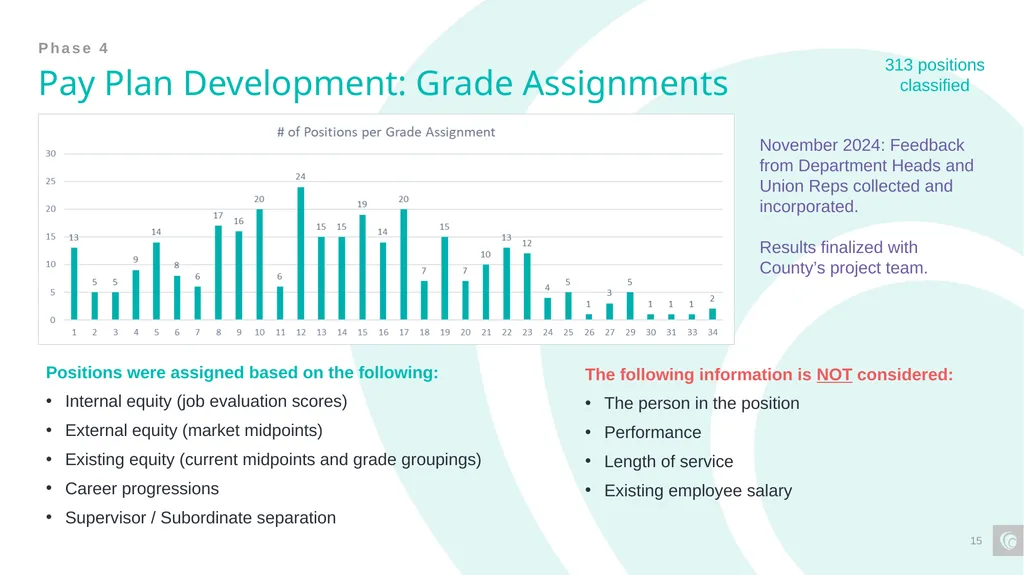
slide15. Pay Plan Development: Grade Assignments Phase 4 Positions were assigned based on the following:
Internal equity (job evaluation scores)
External equity (market midpoints)
Existing equity (current midpoints and grade groupings)
Career progressions
Supervisor / Subordinate separation The following information is NOT considered:
The person in the position
Performance
Length of service
Existing employee salary 313 positions classified November 2024: Feedback from Department Heads and Union Reps collected and incorporated.
Results finalized with County’s project team.<br>
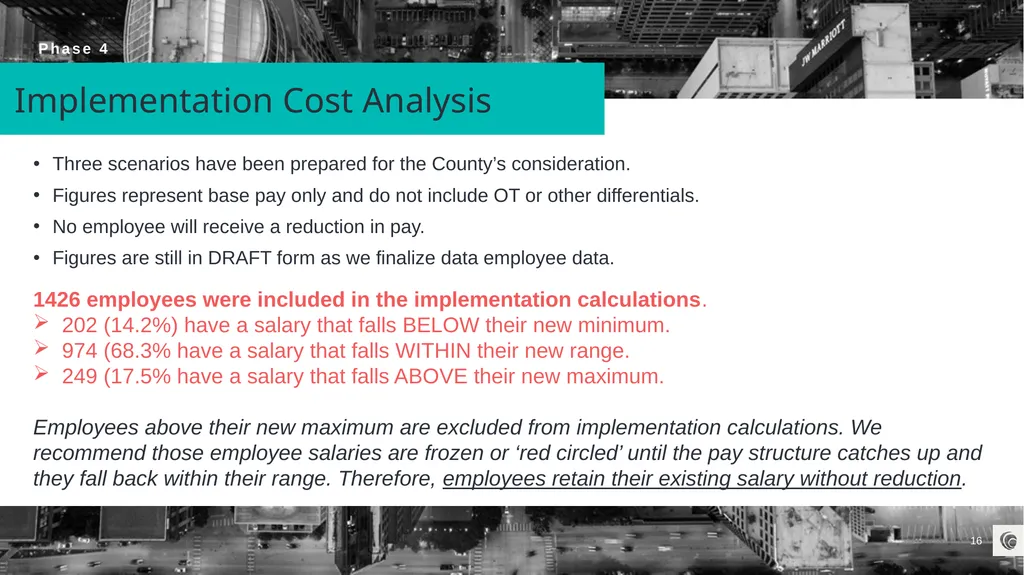
slide16. Implementation Cost Analysis Phase 4 Three scenarios have been prepared for the County’s consideration.
Figures represent base pay only and do not include OT or other differentials.
No employee will receive a reduction in pay.
Figures are still in DRAFT form as we finalize data employee data. 1426 employees were included in the implementation calculations.
202 (14.2%) have a salary that falls BELOW their new minimum.
974 (68.3% have a salary that falls WITHIN their new range.
249 (17.5% have a salary that falls ABOVE their new maximum.
Employees above their new maximum are excluded from implementation calculations. We recommend those employee salaries are frozen or ‘red circled’ until the pay structure catches up and they fall back within their range. Therefore, employees retain their existing salary without reduction.<br>
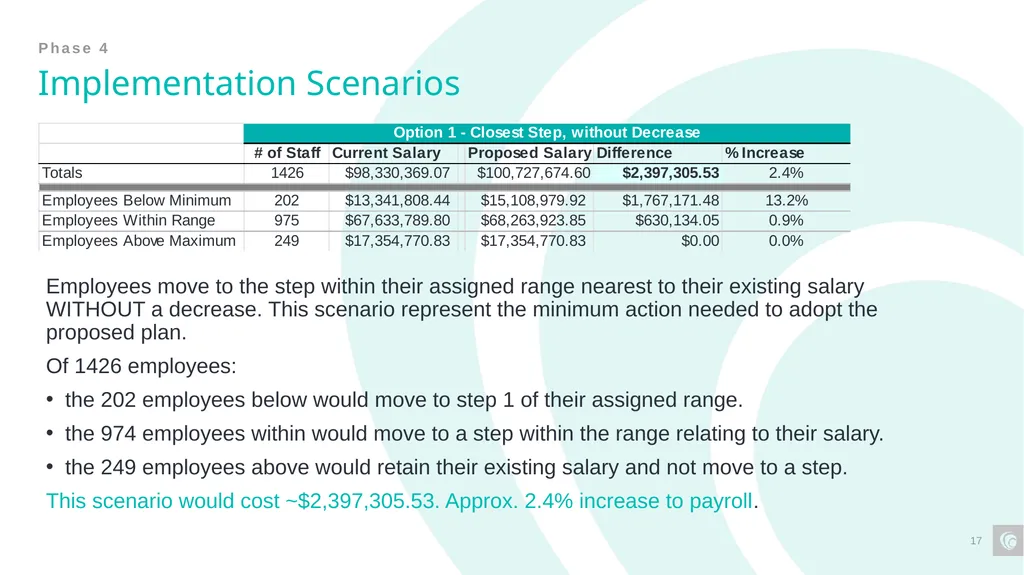
slide17. Implementation Scenarios Phase 4 Employees move to the step within their assigned range nearest to their existing salary WITHOUT a decrease. This scenario represent the minimum action needed to adopt the proposed plan.
Of 1426 employees:
the 202 employees below would move to step 1 of their assigned range.
the 974 employees within would move to a step within the range relating to their salary.
the 249 employees above would retain their existing salary and not move to a step.
This scenario would cost ~$2,397,305.53. Approx. 2.4% increase to payroll.<br>
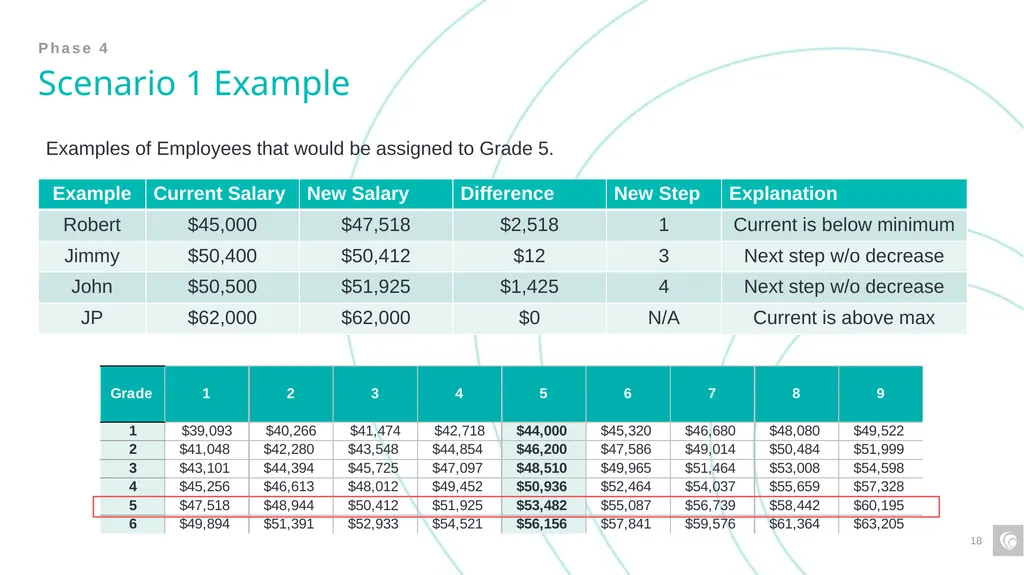
slide18. Scenario 1 Example Phase 4 Examples of Employees that would be assigned to Grade 5.<br>
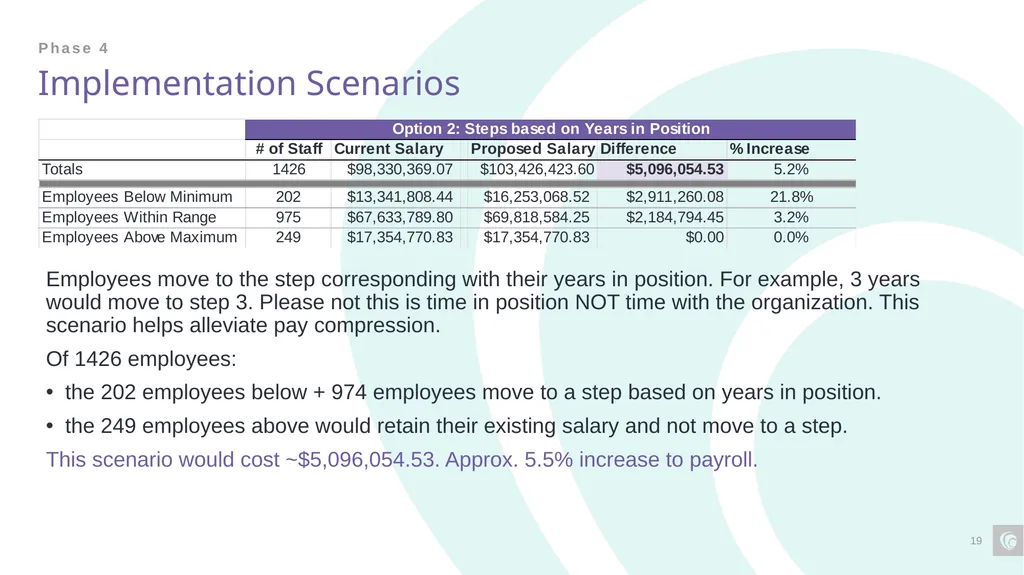
slide19. Implementation Scenarios Phase 4 Employees move to the step corresponding with their years in position. For example, 3 years would move to step 3. Please not this is time in position NOT time with the organization. This scenario helps alleviate pay compression.
Of 1426 employees:
the 202 employees below + 974 employees move to a step based on years in position.
the 249 employees above would retain their existing salary and not move to a step.
This scenario would cost ~$5,096,054.53. Approx. 5.5% increase to payroll.<br>
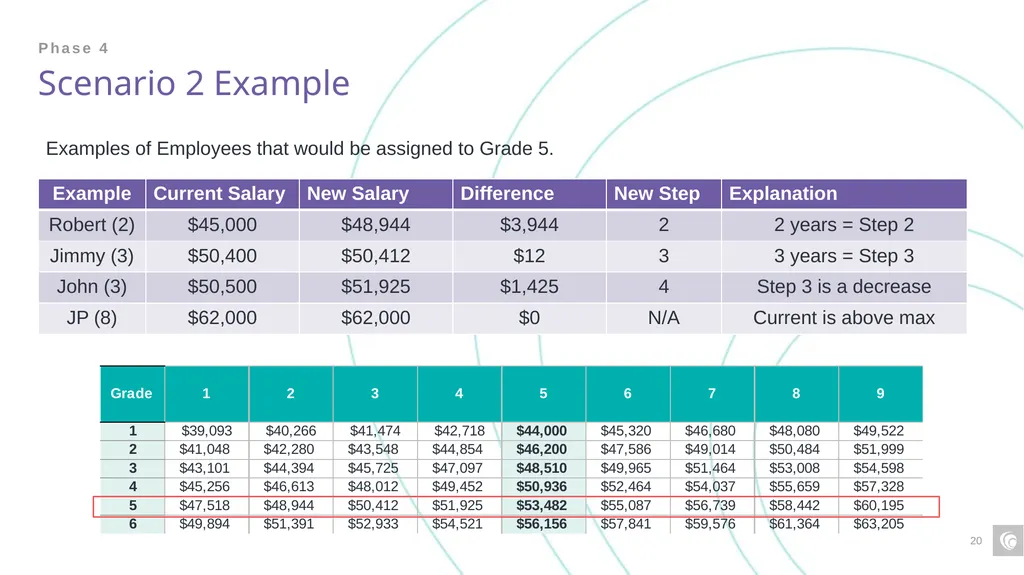
slide20. Scenario 2 Example Phase 4 Examples of Employees that would be assigned to Grade 5.<br>
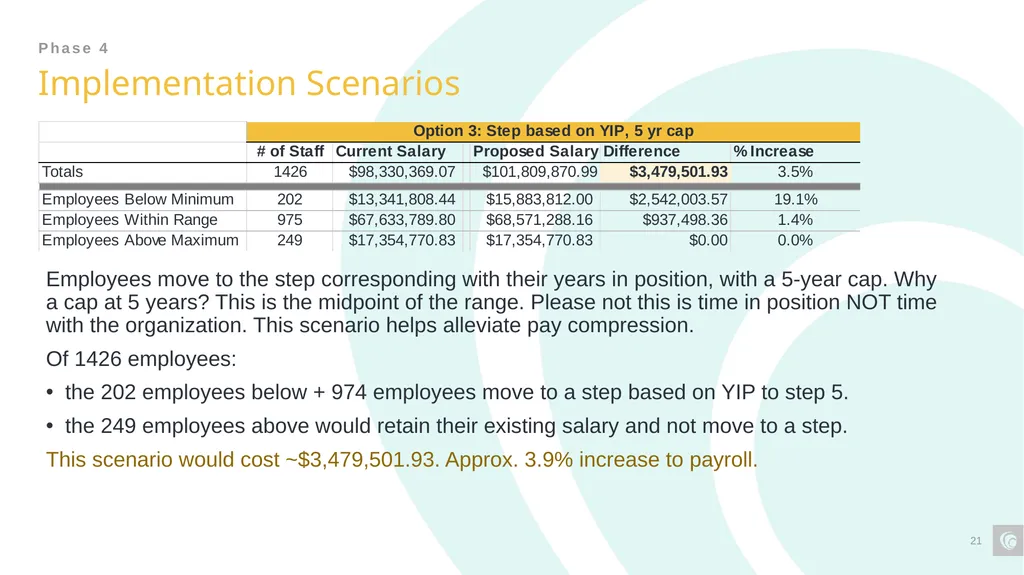
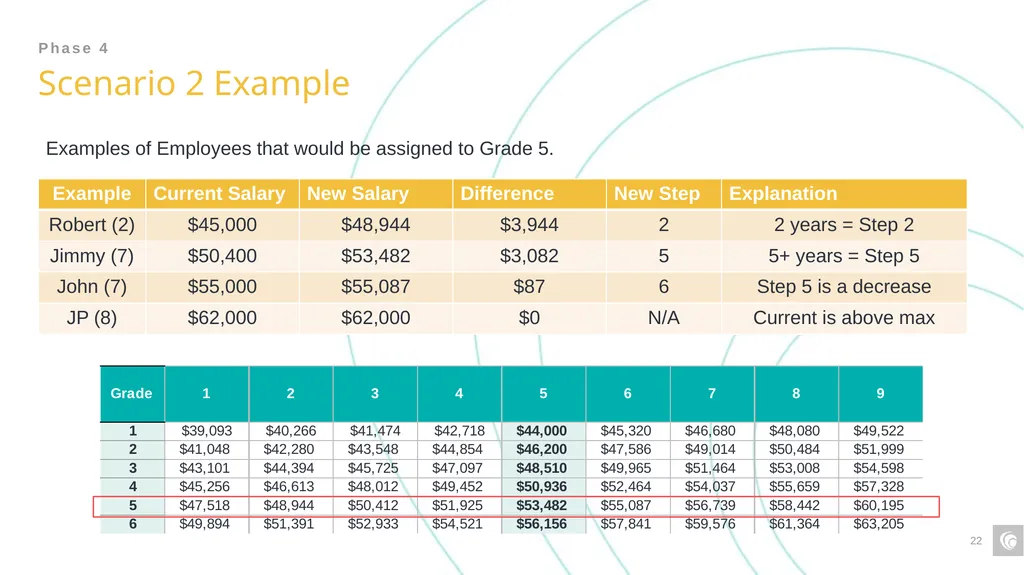
slide21. Implementation Scenarios Phase 4 Employees move to the step corresponding with their years in position, with a 5-year cap. Why a cap at 5 years? This is the midpoint of the range. Please not this is time in position NOT time with the organization. This scenario helps alleviate pay compression.
Of 1426 employees:
the 202 employees below + 974 employees move to a step based on YIP to step 5.
the 249 employees above would retain their existing salary and not move to a step.
This scenario would cost ~$3,479,501.93. Approx. 3.9% increase to payroll.<br>
slide22. Scenario 2 Example Phase 4 Examples of Employees that would be assigned to Grade 5.<br>
slide23. We urge Ulster County to:
Consider the use of a single pay structure for all positions. The single pay structure establishes consistency in defining pay for positions across the organization.
Consider the use of Baker Tilly’s SAFE® methodology to maintain internal equity in compliance with the federal Equal Pay Act. This job evaluation tool can also be used to maintain the integrity of the new classification and compensation plan going forward. Internal equity is necessary to help balance external / market data results.
Consider the approval position grade assignments which have been established with consideration of many factors to include, job evaluation, market data, existing midpoints, career progressions, as well as supervisor/subordinate separations. Additionally, grade assignments have been received input from the Selection Committee and Department Heads before finalization with the County’s project team.
Consider an implementation scenario that addresses the County’s compensation philosophy, business goals, and that is fiscally attainable and sustainable.
Continue efforts to maintain the new classification and compensation system:
Routinely review and updated job descriptions.
Utilize SAFE to ensure internally equitable grade assignments.
Adjust the pay structure, annually, to keep pace with the market. This adjustment would impact individual salaries as well as the pay structure itself.
Adjust salaries, annually, to ensure advancement through assigned pay ranges.
These actions should help maintain the shelf life of the County’s new pay structure until such time to recalibrate with a comprehensive review, like this one, every 5-7 years. It may be necessary to review positions or groups of positions more frequently based on market conditions.<br>
Final Presentation Ulster County, NY<br>
slide2. Project Overview Methodology Data Collection: project planning meetings, data requested from the County, Position Analysis Questionnaires (PAQs) completed by employees and reviewed by supervisors.
Position Review: PAQs used to review titles and conduct job evaluation using our point factor tool, called SAFE®. This process established a hierarchy of jobs within the organization that is reflective of internal equity.
Market Assessment: a custom market survey distributed to peers to collect base pay ranges for benchmark positions. This process established external competitiveness.
Pay Plan Development: development of a new pay plan and grade assignments relative to internal and external equity, and implementation calculations.
Project Completion: final report to be delivered, final presentations, project documentation delivery, and training for HR to maintain the new class and comp plan.<br>
slide3. Internal Review: Job Evaluation Phase 2 The Systematic Analysis and Factor Evaluation (SAFE®) is a point factor job evaluation tool develop for the purpose of measuring internal equity among local government jobs. The end result of this methodology produces a total score for every job reflective of the internal value.
This is a measurement of the position and not the person.
PAQs and job descriptions were used to evaluate all of the County’s positions. SAFE is consistent with the federal Equal Pay Act.<br>
slide4. Market Assessment: Peer Organizations The County identified 14 public peer organizations to be included in the study.
Data was utilized from 9 of those, shown in bold below.
Data from 4 published surveys included to represent the “private sector”. Albany County
City of Kingston
Dutchess County
Greene County
Kingston School District
New York State
Orange County
Putnam County
Rockland County
Sullivan County
Town of New Paltz
Town of Poughkeepsie
Town of Saugerties
Town of Shawangunk
Comp Analyst
Economic Research Institute
Pay Factors
Bureau of Labor Statistics Phase 3<br>
slide5. Market Assessments: Survey Approach Phase 3 Private Sector Data: Published salary data was used as a private sector benchmark in this assessment with data from the following sources included in the study:
Data Adjustments: The base pay information was adjusted, as necessary, to account for the following:
Differences in work week. For example, reported salaries for a 37.5-hour work week were adjusted to reflect that wage for a 40-hour work week. ** All market data and County data was adjusted to reflect a 40-hour work week.
If the market data obtained did not reflect the year in which this study was conducted, the data was aged based on guidance from World at Work's Annual Salary Budget Survey results. ** Data from BLS was aged to bring the data forward to 2024.
Geographic adjustments were applied to account for cost-of-labor differences between Ulster and peer organizations. Baker Tilly uses cost-of-labor differentials reported by the ERI’s Geographic Assessor tool. Cost of labor can be impacted by the cost of living but also relates to the supply and demand of labor in each area (rate of unemployment and number of qualified laborers).<br>
slide6. Market Assessment: Cost of Labor Differentials Where cost of living is a measurement of goods and services in each area, the cost of labor is a measurement of compensation paid.
Cost of labor can be impacted by the cost of living but is mainly influenced by the supply and demand of labor in each area (rate of unemployment and number of qualified laborers). Cost of labor differentials collected from Economic Research Institutes Geographic Assessor tool Phase 3<br>
slide7. Market Assessments: Survey Results Phase 3 Quality Control:
Baker Tilly matched peer positions to Ulster County’s benchmark positions based on a 75% overlap in duties and responsibilities, not just a title for title match.
Further, Baker Tilly required at least three matches per benchmark position to determine a market value. Positions that had insufficient data (less than three matches) are identified as such in the market results.
Benchmarks with sufficient data had 5.41 matches on average.
Market Results:
In total, 424 of Ulster County’s positions were included in the survey as benchmark positions.
Baker Tilly requested pay ranges. (minimum to maximum) and calculated for the midpoint of each collected range.
Of the 424 benchmark positions, 98 positions received insufficient data, and the market value was not able to be calculated.
Overall, market values were established for 326 of the benchmark positions (76.8%).<br>
slide8. Pay Plan Development: Current Plans Phase 4<br>
slide9. Pay Plan Development: Current Plans Phase 4 Observations
Multiple Pay Plans
Some positions not assigned to a pay plan
Inconsistent / no trend in:
Midpoint Differentials
Step Differentials
Number of steps / grades
Range Spreads
Significant overlap exists in salary ranges.
Annual work hours vary considerably.<br>
slide10. Pay Plan Development: Current Plans Phase 4 Similarities / overlap in pay demonstrated across all defined pay plans.<br>
slide11. Pay Plan Development: Current Plans Phase 4 Comparing full coverage of each pay plan to see how similar the pay ranges are distributed.
Biggest outliers are NU Department Heads and UCSA 2096<br>
slide12. Pay Plan Development: Proposed Phase 4 A single pay plan for all positions
34 grades
5% midpoint differentials
Midpoint differentials increase in grades 32 – 34 to accommodate market for positions assigned to these grades.
9 steps
3% step differentials
27% range spreads
Step 5 = midpoint
Aligned 100% of market<br>
slide13. Pay Plan Development: Proposed Phase 4<br>
slide14. Pay Plan Development: Regression Analysis Phase 4<br>
slide15. Pay Plan Development: Grade Assignments Phase 4 Positions were assigned based on the following:
Internal equity (job evaluation scores)
External equity (market midpoints)
Existing equity (current midpoints and grade groupings)
Career progressions
Supervisor / Subordinate separation The following information is NOT considered:
The person in the position
Performance
Length of service
Existing employee salary 313 positions classified November 2024: Feedback from Department Heads and Union Reps collected and incorporated.
Results finalized with County’s project team.<br>
slide16. Implementation Cost Analysis Phase 4 Three scenarios have been prepared for the County’s consideration.
Figures represent base pay only and do not include OT or other differentials.
No employee will receive a reduction in pay.
Figures are still in DRAFT form as we finalize data employee data. 1426 employees were included in the implementation calculations.
202 (14.2%) have a salary that falls BELOW their new minimum.
974 (68.3% have a salary that falls WITHIN their new range.
249 (17.5% have a salary that falls ABOVE their new maximum.
Employees above their new maximum are excluded from implementation calculations. We recommend those employee salaries are frozen or ‘red circled’ until the pay structure catches up and they fall back within their range. Therefore, employees retain their existing salary without reduction.<br>
slide17. Implementation Scenarios Phase 4 Employees move to the step within their assigned range nearest to their existing salary WITHOUT a decrease. This scenario represent the minimum action needed to adopt the proposed plan.
Of 1426 employees:
the 202 employees below would move to step 1 of their assigned range.
the 974 employees within would move to a step within the range relating to their salary.
the 249 employees above would retain their existing salary and not move to a step.
This scenario would cost ~$2,397,305.53. Approx. 2.4% increase to payroll.<br>
slide18. Scenario 1 Example Phase 4 Examples of Employees that would be assigned to Grade 5.<br>
slide19. Implementation Scenarios Phase 4 Employees move to the step corresponding with their years in position. For example, 3 years would move to step 3. Please not this is time in position NOT time with the organization. This scenario helps alleviate pay compression.
Of 1426 employees:
the 202 employees below + 974 employees move to a step based on years in position.
the 249 employees above would retain their existing salary and not move to a step.
This scenario would cost ~$5,096,054.53. Approx. 5.5% increase to payroll.<br>
slide20. Scenario 2 Example Phase 4 Examples of Employees that would be assigned to Grade 5.<br>
slide21. Implementation Scenarios Phase 4 Employees move to the step corresponding with their years in position, with a 5-year cap. Why a cap at 5 years? This is the midpoint of the range. Please not this is time in position NOT time with the organization. This scenario helps alleviate pay compression.
Of 1426 employees:
the 202 employees below + 974 employees move to a step based on YIP to step 5.
the 249 employees above would retain their existing salary and not move to a step.
This scenario would cost ~$3,479,501.93. Approx. 3.9% increase to payroll.<br>
slide22. Scenario 2 Example Phase 4 Examples of Employees that would be assigned to Grade 5.<br>
slide23. We urge Ulster County to:
Consider the use of a single pay structure for all positions. The single pay structure establishes consistency in defining pay for positions across the organization.
Consider the use of Baker Tilly’s SAFE® methodology to maintain internal equity in compliance with the federal Equal Pay Act. This job evaluation tool can also be used to maintain the integrity of the new classification and compensation plan going forward. Internal equity is necessary to help balance external / market data results.
Consider the approval position grade assignments which have been established with consideration of many factors to include, job evaluation, market data, existing midpoints, career progressions, as well as supervisor/subordinate separations. Additionally, grade assignments have been received input from the Selection Committee and Department Heads before finalization with the County’s project team.
Consider an implementation scenario that addresses the County’s compensation philosophy, business goals, and that is fiscally attainable and sustainable.
Continue efforts to maintain the new classification and compensation system:
Routinely review and updated job descriptions.
Utilize SAFE to ensure internally equitable grade assignments.
Adjust the pay structure, annually, to keep pace with the market. This adjustment would impact individual salaries as well as the pay structure itself.
Adjust salaries, annually, to ensure advancement through assigned pay ranges.
These actions should help maintain the shelf life of the County’s new pay structure until such time to recalibrate with a comprehensive review, like this one, every 5-7 years. It may be necessary to review positions or groups of positions more frequently based on market conditions.<br>