
Consumer Intelligence Centre How to Guide Content:
CS
Published · 59 slides · 0 views
1 / 1








Description
Consumer Intelligence Centre How to Guide Content: Market Analyser Product Launch Analytics Analysis Countries Database Companies Trendsight Map AI Hub Tutorial Videos deo: One Scalable Platform The Intelligence Center Access 230
Related Topics
Share
Embed code
Download this presentation From Below
"Consumer Intelligence Centre How to Guide Content:" is the property of its rightful owner. Permission is granted to download and print the materials on this website for personal, non-commercial use only, and to display it on your personal computer provided you do not modify the materials and that you retain all copyright notices contained in the materials. By downloading content from our website, you accept the terms of this agreement.
Presentation Transcript
01
Consumer Intelligence Centre
How to Guide<br>
02
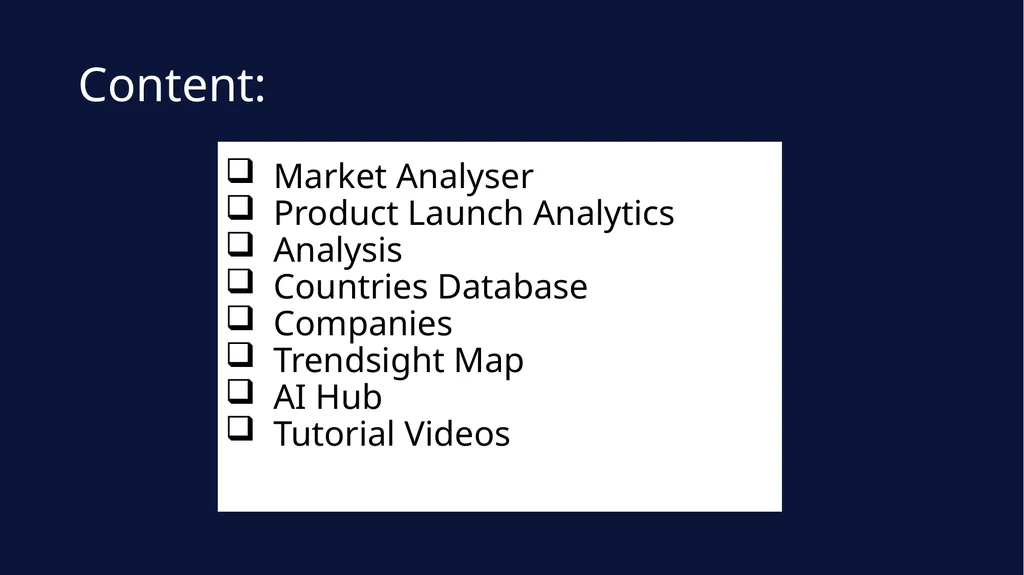
Content: Market Analyser
Product Launch Analytics
Analysis
Countries Database
Companies
Trendsight Map
AI Hub
Tutorial Videos
deo:<br>
Product Launch Analytics
Analysis
Countries Database
Companies
Trendsight Map
AI Hub
Tutorial Videos
deo:<br>
03
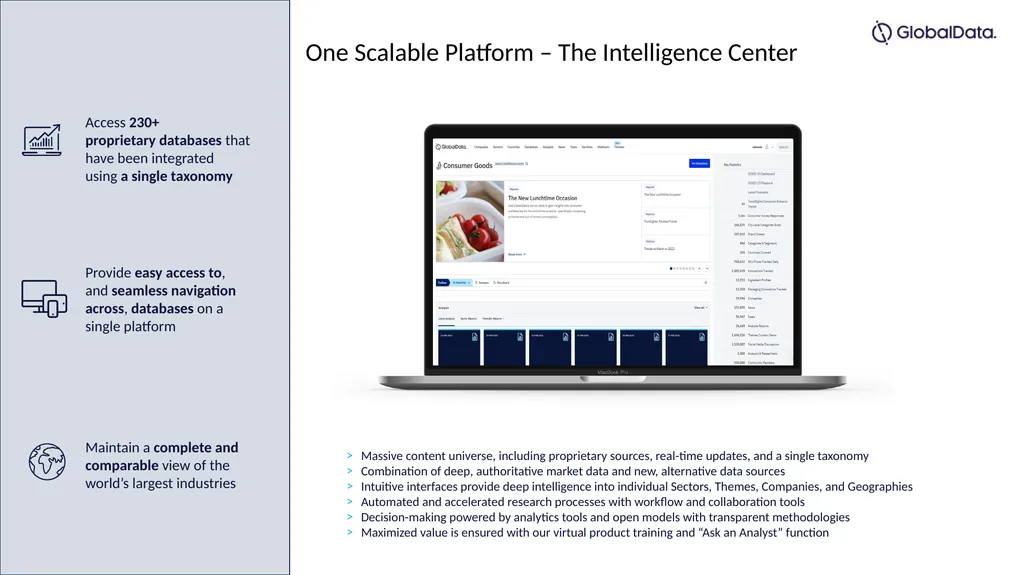
One Scalable Platform – The Intelligence Center Access 230+ proprietary databases that have been integrated using a single taxonomy Provide easy access to, and seamless navigation across, databases on a single platform Maintain a complete and comparable view of the world’s largest industries Massive content universe, including proprietary sources, real-time updates, and a single taxonomy
Combination of deep, authoritative market data and new, alternative data sources
Intuitive interfaces provide deep intelligence into individual Sectors, Themes, Companies, and Geographies
Automated and accelerated research processes with workflow and collaboration tools
Decision-making powered by analytics tools and open models with transparent methodologies
Maximized value is ensured with our virtual product training and “Ask an Analyst” function<br>
Combination of deep, authoritative market data and new, alternative data sources
Intuitive interfaces provide deep intelligence into individual Sectors, Themes, Companies, and Geographies
Automated and accelerated research processes with workflow and collaboration tools
Decision-making powered by analytics tools and open models with transparent methodologies
Maximized value is ensured with our virtual product training and “Ask an Analyst” function<br>
04
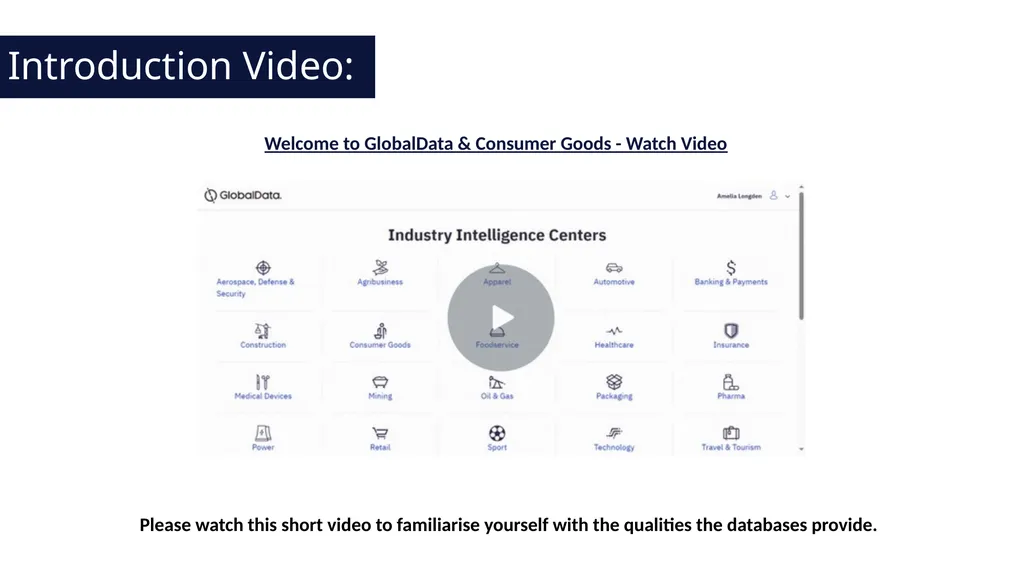
Welcome to GlobalData & Consumer Goods - Watch Video Introduction Video: Please watch this short video to familiarise yourself with the qualities the databases provide.<br>
05
1. MARKET ANALYSER Click to Access<br>
06
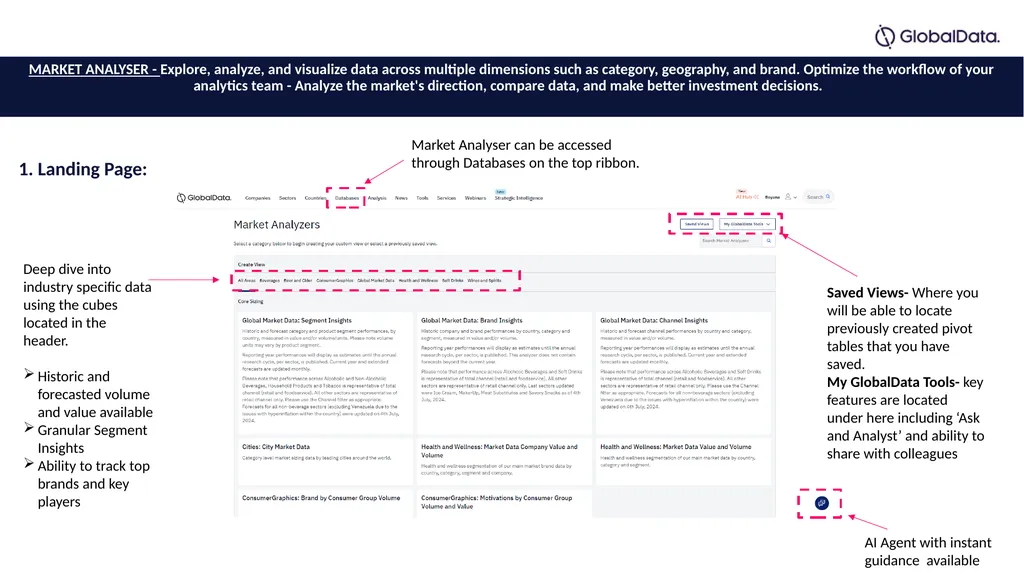
MARKET ANALYSER - Explore, analyze, and visualize data across multiple dimensions such as category, geography, and brand. Optimize the workflow of your analytics team - Analyze the market's direction, compare data, and make better investment decisions. 1. Landing Page: Market Analyser can be accessed through Databases on the top ribbon. Deep dive into industry specific data using the cubes located in the header.
Historic and forecasted volume and value available
Granular Segment Insights
Ability to track top brands and key players Saved Views- Where you will be able to locate previously created pivot tables that you have saved.
My GlobalData Tools- key features are located under here including ‘Ask and Analyst’ and ability to share with colleagues AI Agent with instant guidance available<br>
Historic and forecasted volume and value available
Granular Segment Insights
Ability to track top brands and key players Saved Views- Where you will be able to locate previously created pivot tables that you have saved.
My GlobalData Tools- key features are located under here including ‘Ask and Analyst’ and ability to share with colleagues AI Agent with instant guidance available<br>
07
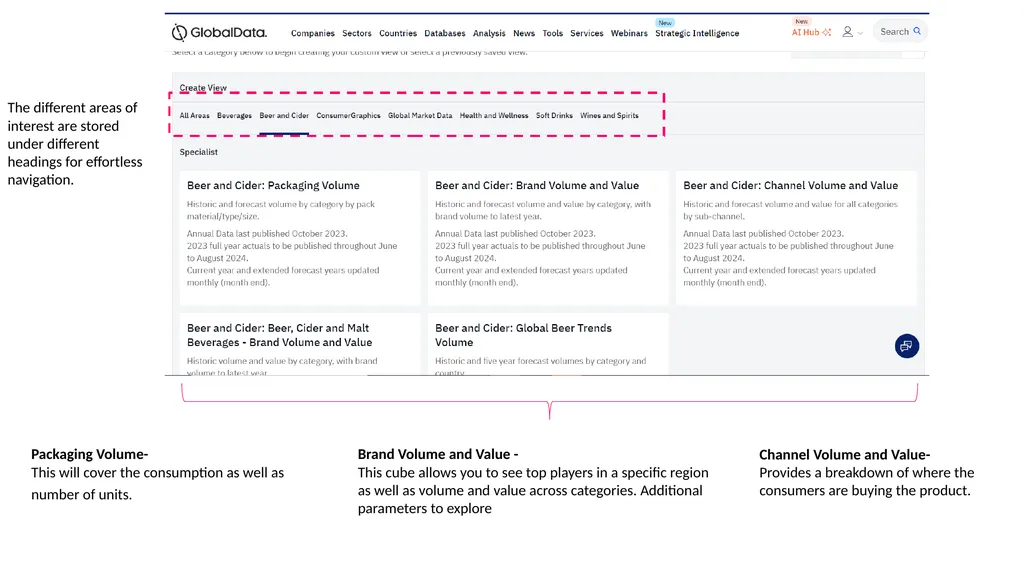
The different areas of interest are stored under different headings for effortless navigation. Brand Volume and Value -
This cube allows you to see top players in a specific region as well as volume and value across categories. Additional parameters to explore Channel Volume and Value-
Provides a breakdown of where the consumers are buying the product. Packaging Volume-
This will cover the consumption as well as number of units.<br>
This cube allows you to see top players in a specific region as well as volume and value across categories. Additional parameters to explore Channel Volume and Value-
Provides a breakdown of where the consumers are buying the product. Packaging Volume-
This will cover the consumption as well as number of units.<br>
08
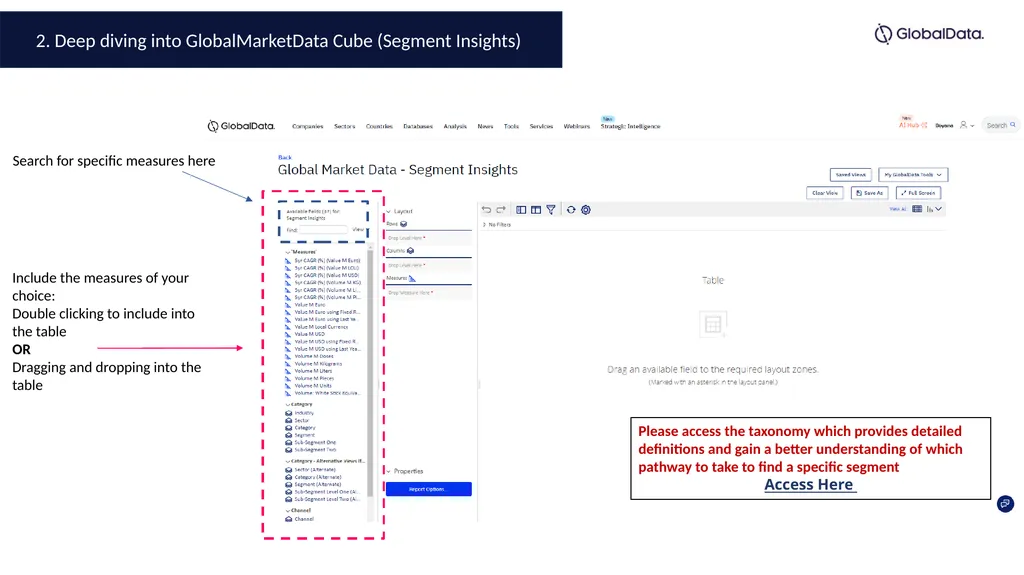
2. Deep diving into GlobalMarketData Cube (Segment Insights) Include the measures of your choice:
Double clicking to include into the table
OR
Dragging and dropping into the table Search for specific measures here Please access the taxonomy which provides detailed definitions and gain a better understanding of which pathway to take to find a specific segment
Access Here<br>
Double clicking to include into the table
OR
Dragging and dropping into the table Search for specific measures here Please access the taxonomy which provides detailed definitions and gain a better understanding of which pathway to take to find a specific segment
Access Here<br>
09
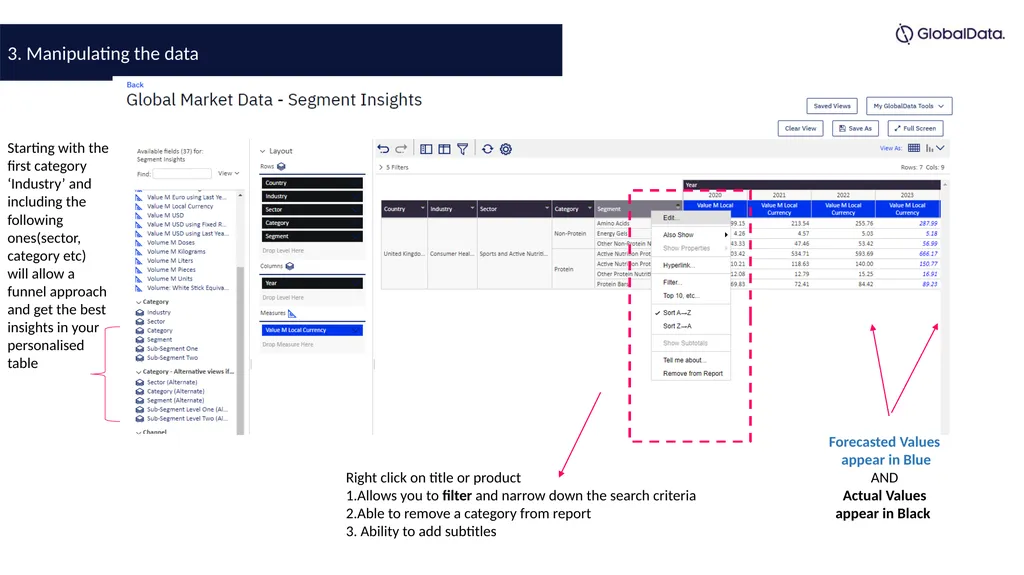
3. Manipulating the data Right click on title or product
1.Allows you to filter and narrow down the search criteria
2.Able to remove a category from report
3. Ability to add subtitles Forecasted Values appear in Blue
AND
Actual Values appear in Black Starting with the first category ‘Industry’ and including the following ones(sector, category etc) will allow a funnel approach and get the best insights in your personalised table<br>
1.Allows you to filter and narrow down the search criteria
2.Able to remove a category from report
3. Ability to add subtitles Forecasted Values appear in Blue
AND
Actual Values appear in Black Starting with the first category ‘Industry’ and including the following ones(sector, category etc) will allow a funnel approach and get the best insights in your personalised table<br>
10
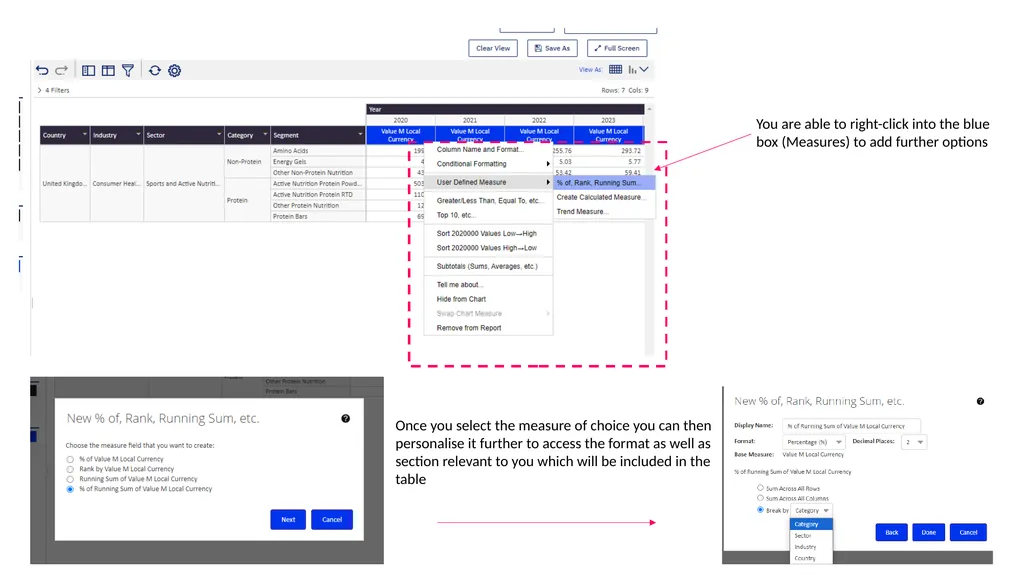
You are able to right-click into the blue box (Measures) to add further options Once you select the measure of choice you can then personalise it further to access the format as well as section relevant to you which will be included in the table<br>
11
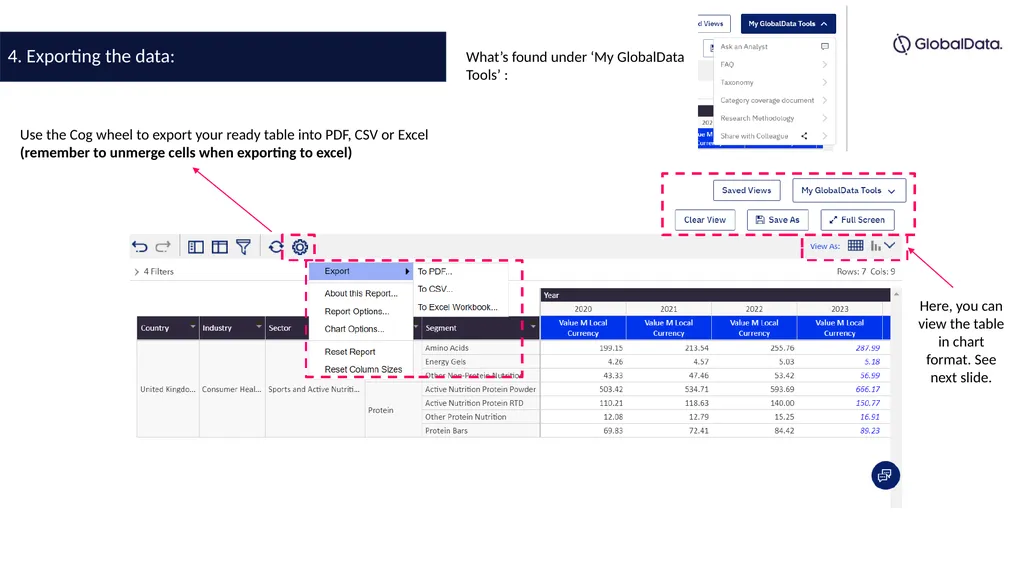
4. Exporting the data: Use the Cog wheel to export your ready table into PDF, CSV or Excel (remember to unmerge cells when exporting to excel) Here, you can view the table in chart format. See next slide. What’s found under ‘My GlobalData Tools’ :<br>
12
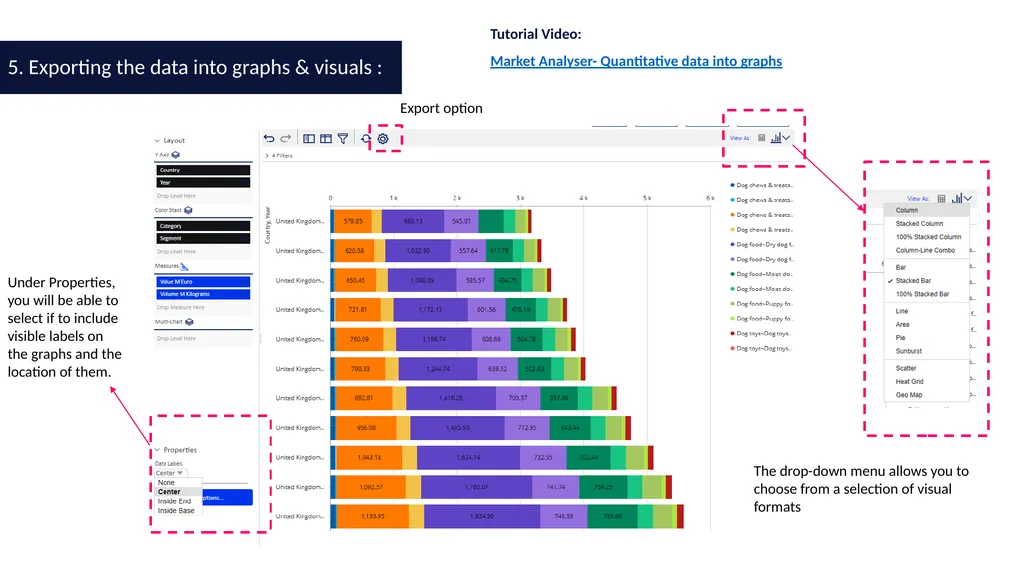
5. Exporting the data into graphs & visuals : Tutorial Video:
Market Analyser- Quantitative data into graphs Under Properties, you will be able to select if to include visible labels on the graphs and the location of them. The drop-down menu allows you to choose from a selection of visual formats Export option<br>
Market Analyser- Quantitative data into graphs Under Properties, you will be able to select if to include visible labels on the graphs and the location of them. The drop-down menu allows you to choose from a selection of visual formats Export option<br>
13
By right clicking one of our value measure. You can either right click the blue box in the left hand Layout screen, or the blue box in the table above your data. Now we can highlight User Defined Measure, and from withing select Create Calculated Measure.
Doing this will bring up the Create Calculated Measure prompt box. Adding User Defined Measures (converting to GBP)<br>
Doing this will bring up the Create Calculated Measure prompt box. Adding User Defined Measures (converting to GBP)<br>
14
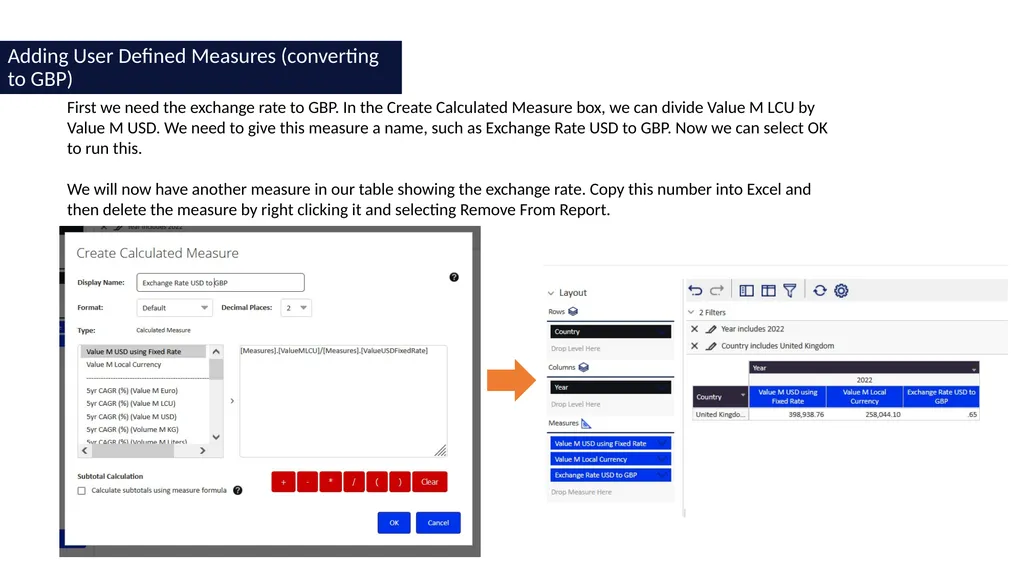
First we need the exchange rate to GBP. In the Create Calculated Measure box, we can divide Value M LCU by Value M USD. We need to give this measure a name, such as Exchange Rate USD to GBP. Now we can select OK to run this.
We will now have another measure in our table showing the exchange rate. Copy this number into Excel and then delete the measure by right clicking it and selecting Remove From Report. Adding User Defined Measures (converting to GBP)<br>
We will now have another measure in our table showing the exchange rate. Copy this number into Excel and then delete the measure by right clicking it and selecting Remove From Report. Adding User Defined Measures (converting to GBP)<br>
15
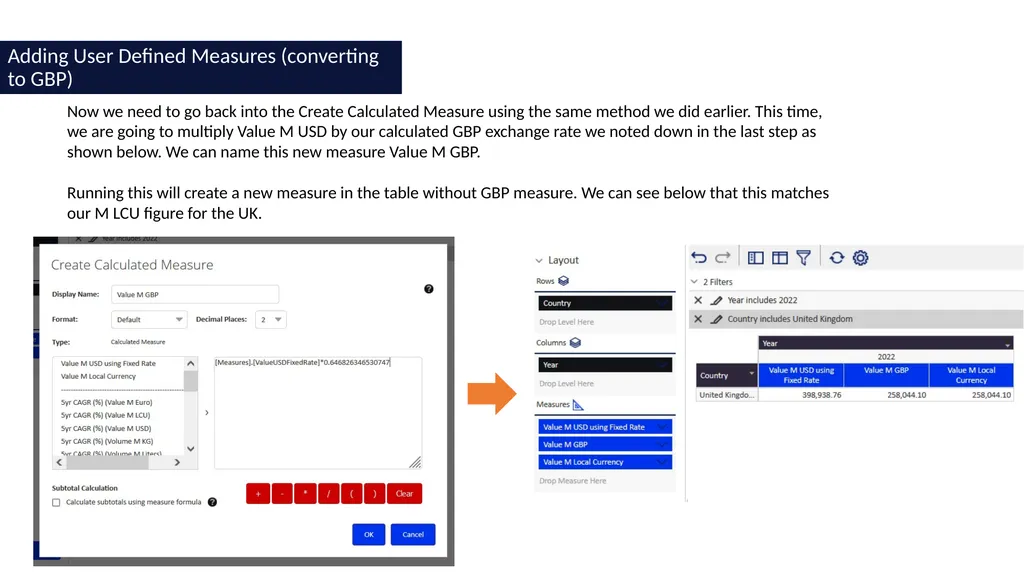
Now we need to go back into the Create Calculated Measure using the same method we did earlier. This time, we are going to multiply Value M USD by our calculated GBP exchange rate we noted down in the last step as shown below. We can name this new measure Value M GBP.
Running this will create a new measure in the table without GBP measure. We can see below that this matches our M LCU figure for the UK. Adding User Defined Measures (converting to GBP)<br>
Running this will create a new measure in the table without GBP measure. We can see below that this matches our M LCU figure for the UK. Adding User Defined Measures (converting to GBP)<br>
16
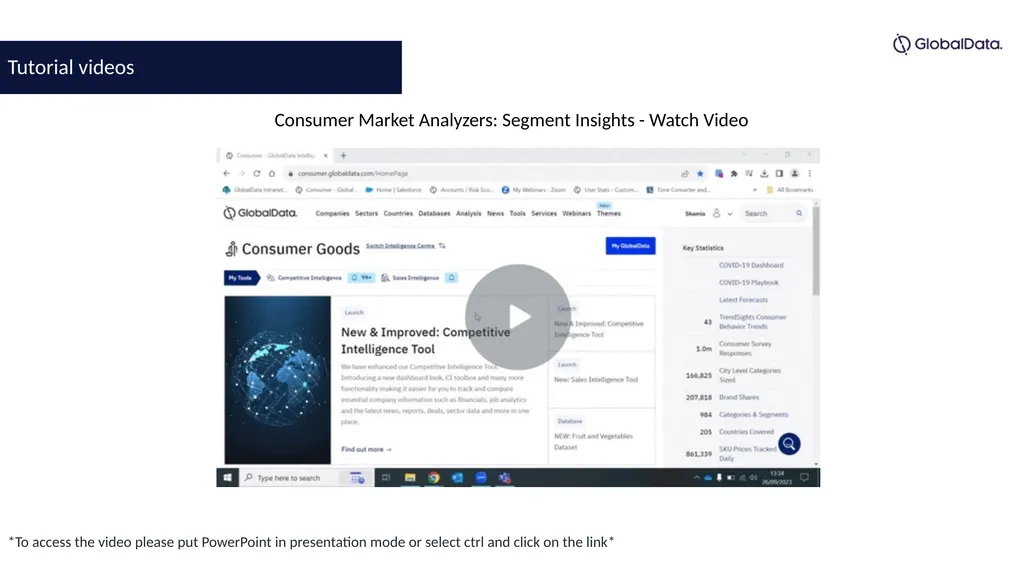
Consumer Market Analyzers: Segment Insights - Watch Video *To access the video please put PowerPoint in presentation mode or select ctrl and click on the link* Tutorial videos<br>
17
2. PRODUCT-LAUNCH ANALYTICS Click to Access<br>
18
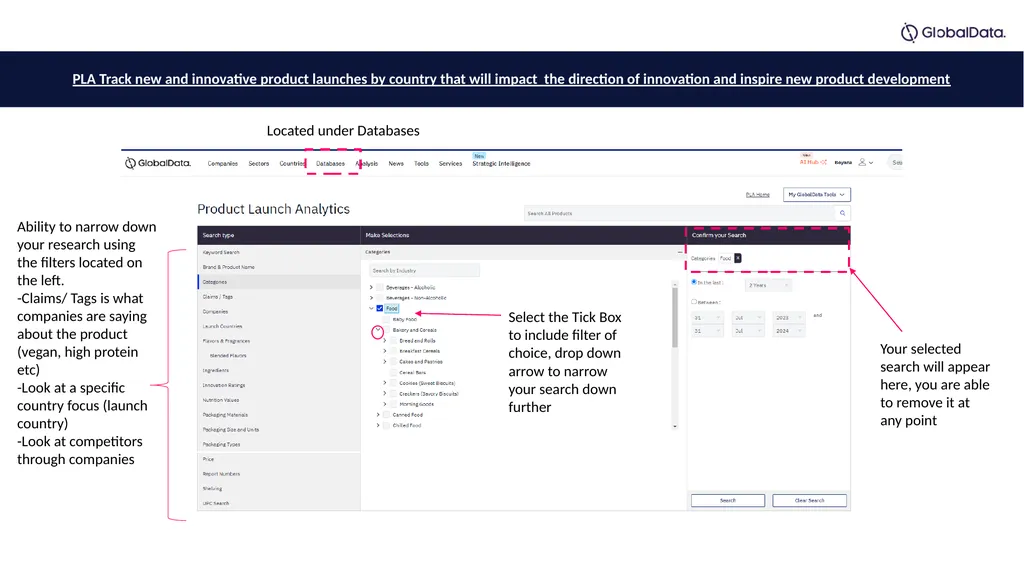
Click to Access PLA Track new and innovative product launches by country that will impact the direction of innovation and inspire new product development Your selected search will appear here, you are able to remove it at any point Select the Tick Box to include filter of choice, drop down arrow to narrow your search down further Ability to narrow down your research using the filters located on the left.
-Claims/ Tags is what companies are saying about the product (vegan, high protein etc)
-Look at a specific country focus (launch country)
-Look at competitors through companies Located under Databases<br>
-Claims/ Tags is what companies are saying about the product (vegan, high protein etc)
-Look at a specific country focus (launch country)
-Look at competitors through companies Located under Databases<br>
19
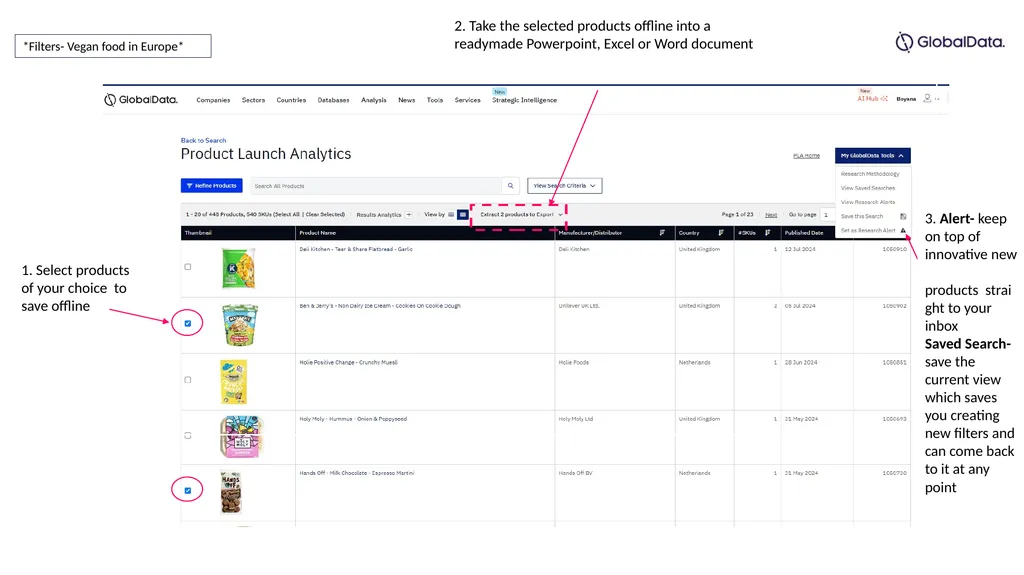
Click to Access *Filters- Vegan food in Europe* 3. Alert- keep on top of innovative new products straight to your inbox
Saved Search- save the current view which saves you creating new filters and can come back to it at any point 2. Take the selected products offline into a readymade Powerpoint, Excel or Word document 1. Select products of your choice to save offline<br>
Saved Search- save the current view which saves you creating new filters and can come back to it at any point 2. Take the selected products offline into a readymade Powerpoint, Excel or Word document 1. Select products of your choice to save offline<br>
20
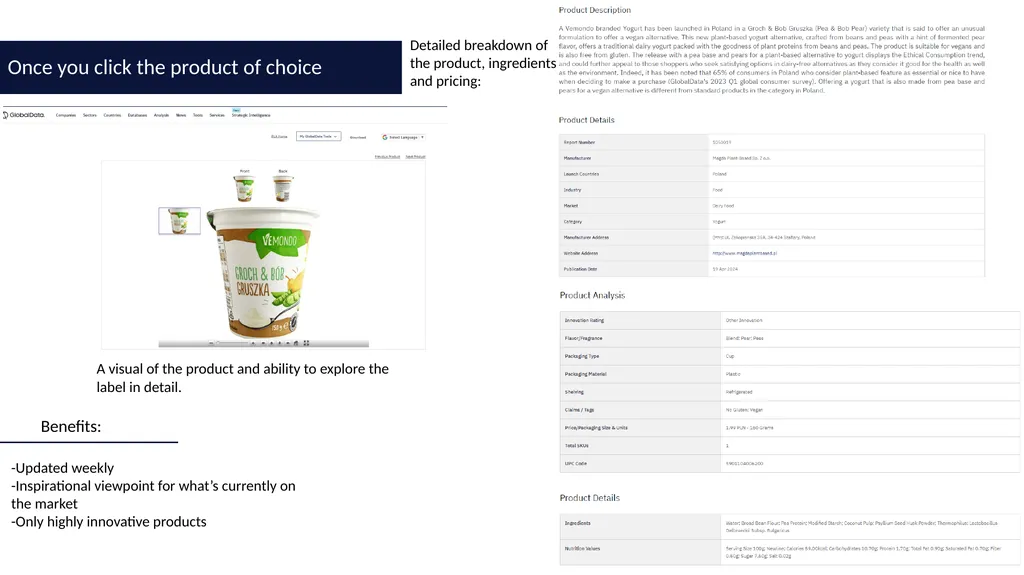
A visual of the product and ability to explore the label in detail. Detailed breakdown of the product, ingredients and pricing: Benefits: -Updated weekly
-Inspirational viewpoint for what’s currently on the market
-Only highly innovative products Once you click the product of choice<br>
-Inspirational viewpoint for what’s currently on the market
-Only highly innovative products Once you click the product of choice<br>
21
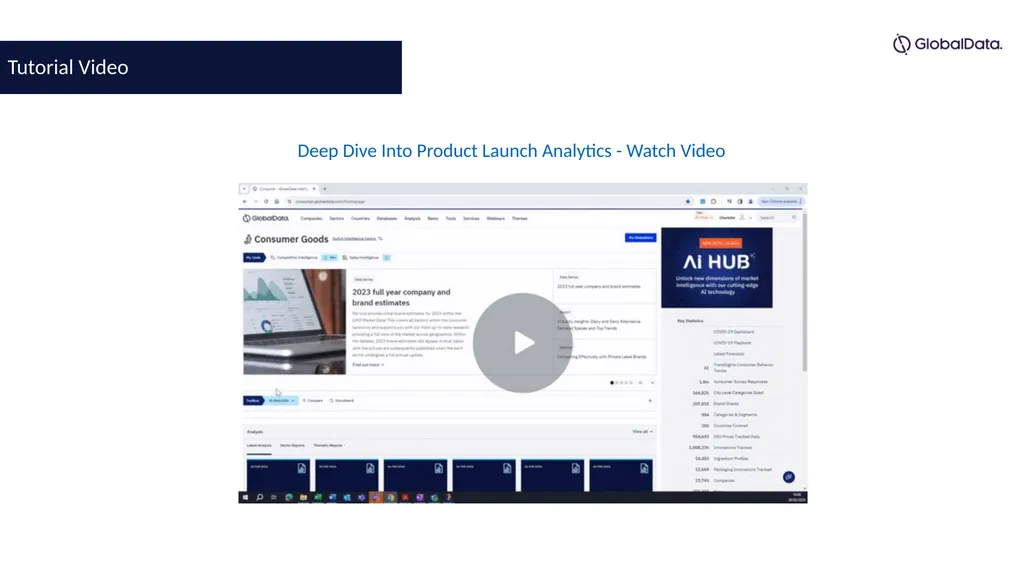
Deep Dive Into Product Launch Analytics - Watch Video Tutorial Video<br>
22
3. ANALYSIS Click to Access<br>
23
120
Long
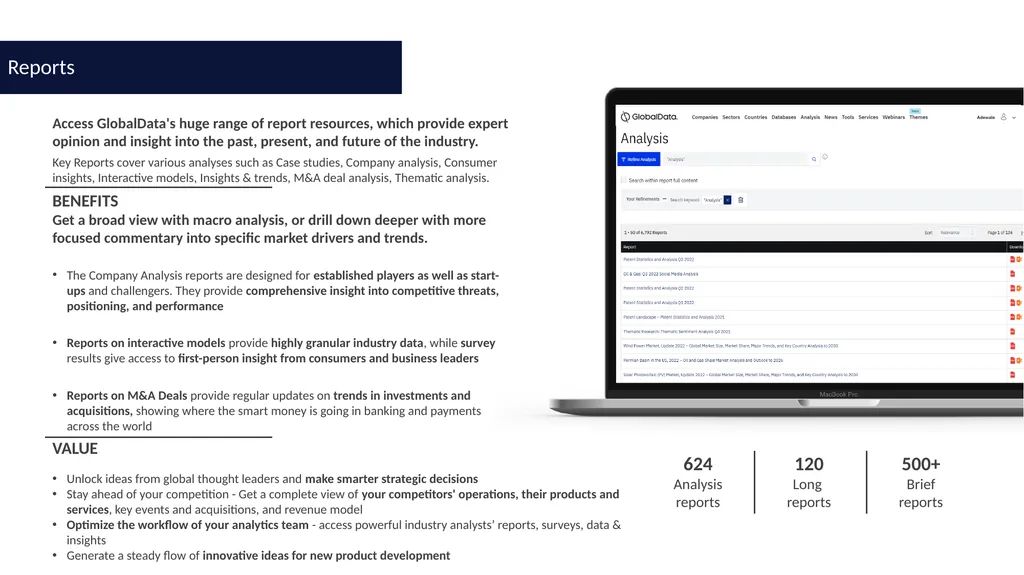
reports FEATURE Access GlobalData's huge range of report resources, which provide expert opinion and insight into the past, present, and future of the industry.
Key Reports cover various analyses such as Case studies, Company analysis, Consumer insights, Interactive models, Insights & trends, M&A deal analysis, Thematic analysis. BENEFITS Get a broad view with macro analysis, or drill down deeper with more focused commentary into specific market drivers and trends.
The Company Analysis reports are designed for established players as well as start-ups and challengers. They provide comprehensive insight into competitive threats, positioning, and performance
Reports on interactive models provide highly granular industry data, while survey results give access to first-person insight from consumers and business leaders
Reports on M&A Deals provide regular updates on trends in investments and acquisitions, showing where the smart money is going in banking and payments across the world VALUE Unlock ideas from global thought leaders and make smarter strategic decisions
Stay ahead of your competition - Get a complete view of your competitors' operations, their products and services, key events and acquisitions, and revenue model
Optimize the workflow of your analytics team - access powerful industry analysts’ reports, surveys, data & insights
Generate a steady flow of innovative ideas for new product development 624
Analysis
reports 500+
Brief
reports Reports<br>
Long
reports FEATURE Access GlobalData's huge range of report resources, which provide expert opinion and insight into the past, present, and future of the industry.
Key Reports cover various analyses such as Case studies, Company analysis, Consumer insights, Interactive models, Insights & trends, M&A deal analysis, Thematic analysis. BENEFITS Get a broad view with macro analysis, or drill down deeper with more focused commentary into specific market drivers and trends.
The Company Analysis reports are designed for established players as well as start-ups and challengers. They provide comprehensive insight into competitive threats, positioning, and performance
Reports on interactive models provide highly granular industry data, while survey results give access to first-person insight from consumers and business leaders
Reports on M&A Deals provide regular updates on trends in investments and acquisitions, showing where the smart money is going in banking and payments across the world VALUE Unlock ideas from global thought leaders and make smarter strategic decisions
Stay ahead of your competition - Get a complete view of your competitors' operations, their products and services, key events and acquisitions, and revenue model
Optimize the workflow of your analytics team - access powerful industry analysts’ reports, surveys, data & insights
Generate a steady flow of innovative ideas for new product development 624
Analysis
reports 500+
Brief
reports Reports<br>
24
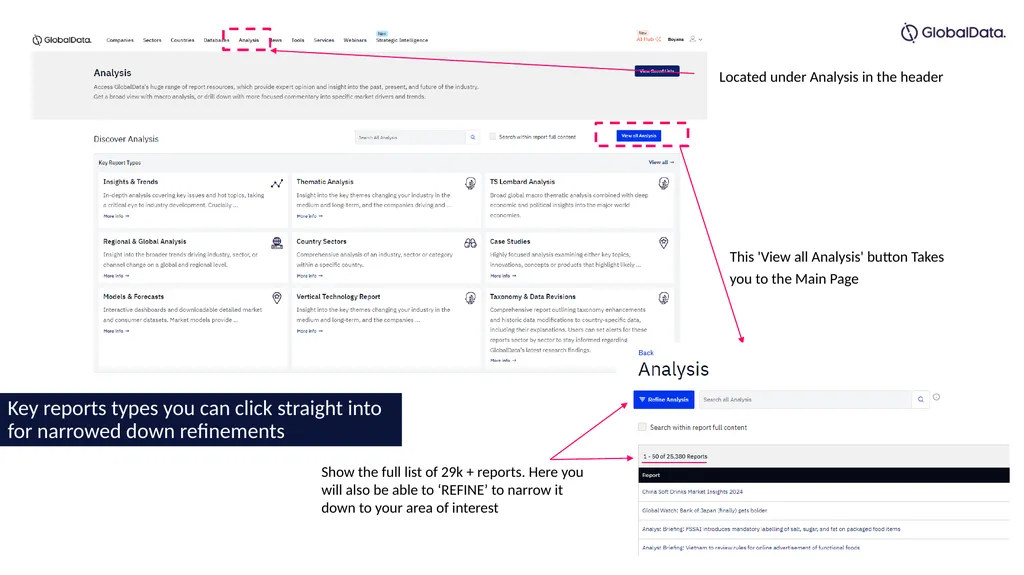
Show the full list of 29k + reports. Here you will also be able to ‘REFINE’ to narrow it down to your area of interest This 'View all Analysis' button Takes you to the Main Page Located under Analysis in the header Key reports types you can click straight into for narrowed down refinements<br>
25
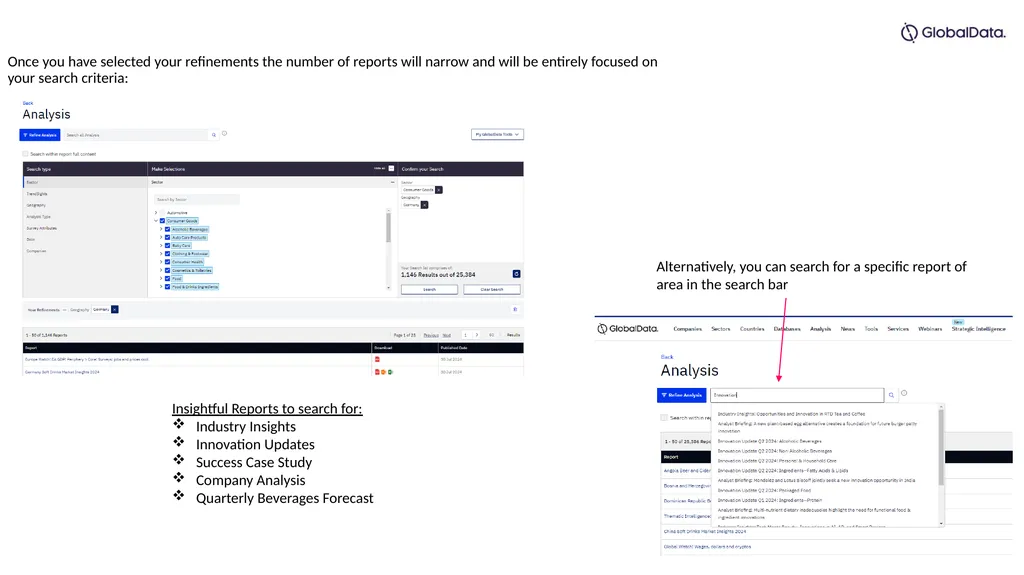
Once you have selected your refinements the number of reports will narrow and will be entirely focused on your search criteria: Alternatively, you can search for a specific report of area in the search bar Insightful Reports to search for:
Industry Insights
Innovation Updates
Success Case Study
Company Analysis
Quarterly Beverages Forecast<br>
Industry Insights
Innovation Updates
Success Case Study
Company Analysis
Quarterly Beverages Forecast<br>
26
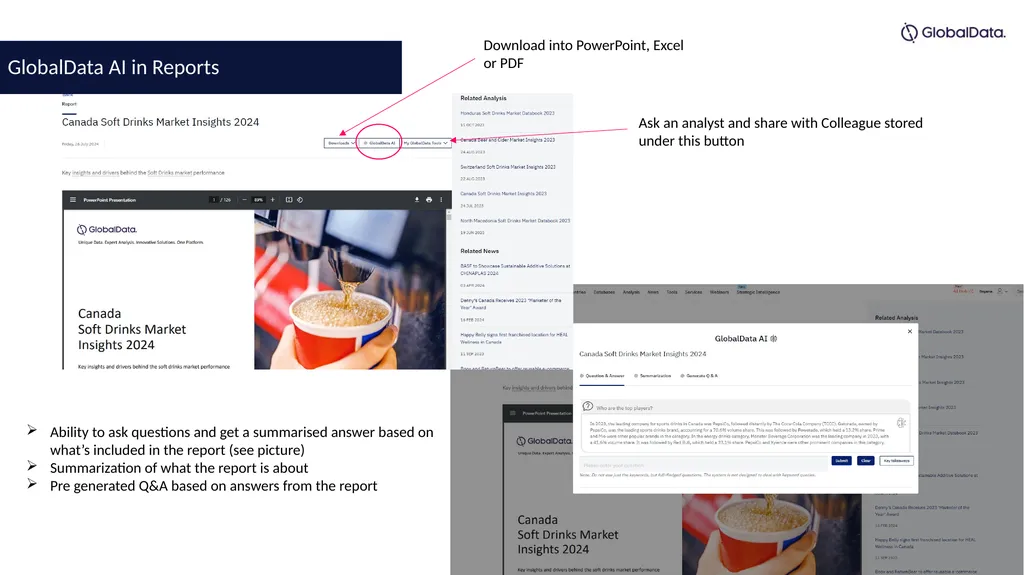
Ability to ask questions and get a summarised answer based on what’s included in the report (see picture)
Summarization of what the report is about
Pre generated Q&A based on answers from the report Download into PowerPoint, Excel or PDF Ask an analyst and share with Colleague stored under this button GlobalData AI in Reports<br>
Summarization of what the report is about
Pre generated Q&A based on answers from the report Download into PowerPoint, Excel or PDF Ask an analyst and share with Colleague stored under this button GlobalData AI in Reports<br>
27
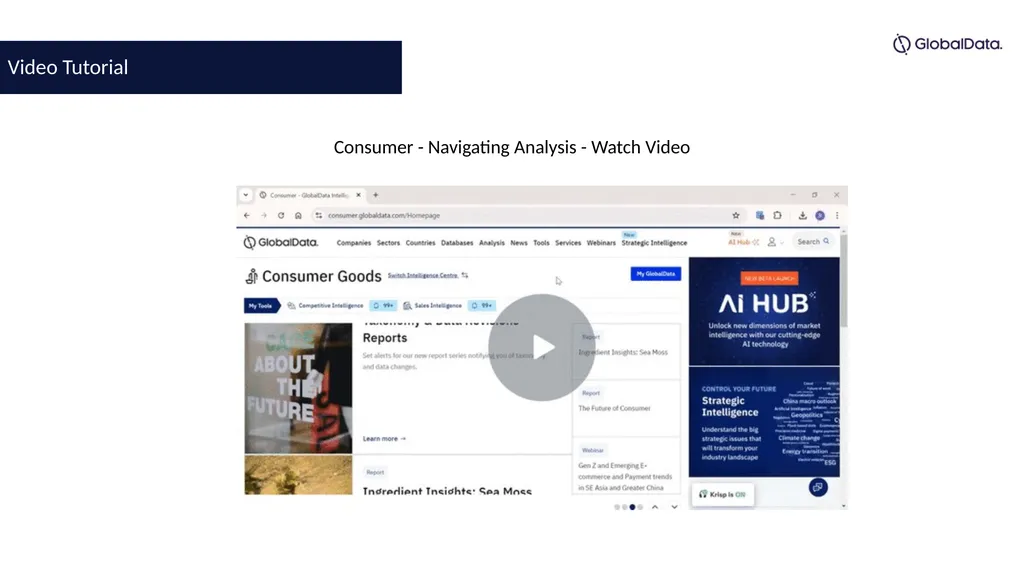
Consumer - Navigating Analysis - Watch Video Video Tutorial<br>
28
3. COUNTRIES ANALYSIS Click to Access<br>
29
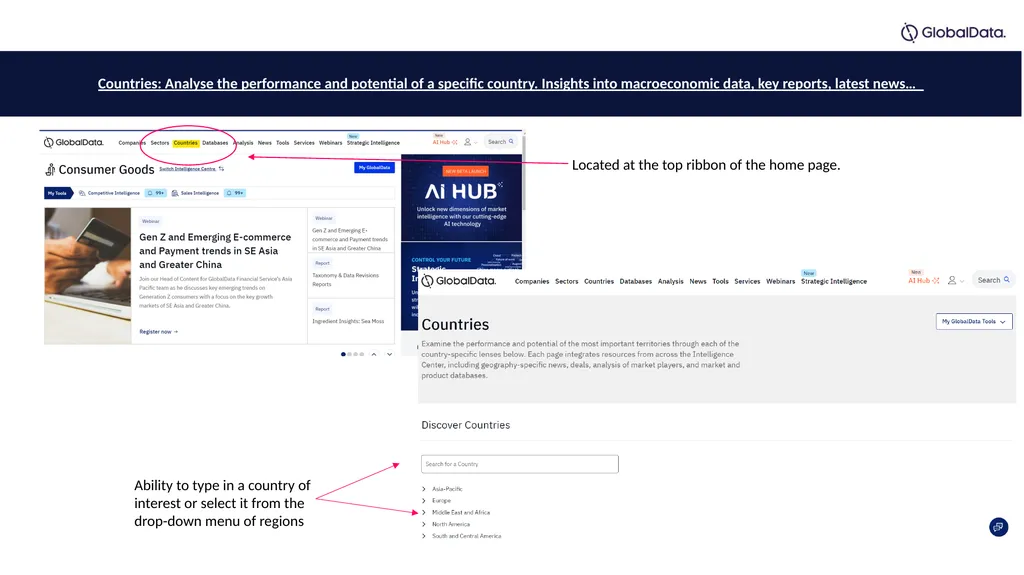
Countries: Analyse the performance and potential of a specific country. Insights into macroeconomic data, key reports, latest news… Ability to type in a country of interest or select it from the drop-down menu of regions Located at the top ribbon of the home page.<br>
30
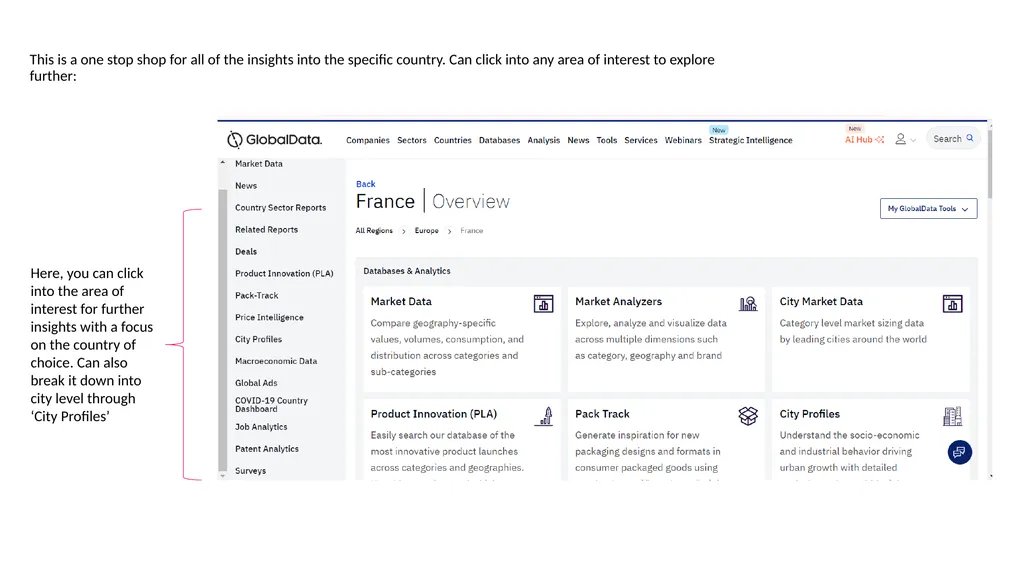
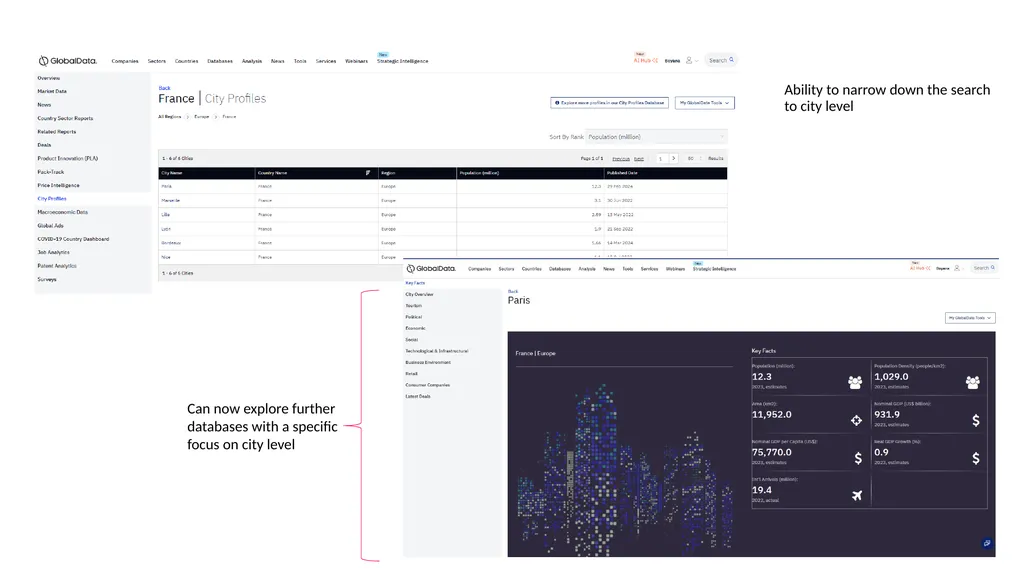
This is a one stop shop for all of the insights into the specific country. Can click into any area of interest to explore further: Here, you can click into the area of interest for further insights with a focus on the country of choice. Can also break it down into city level through ‘City Profiles’<br>
31
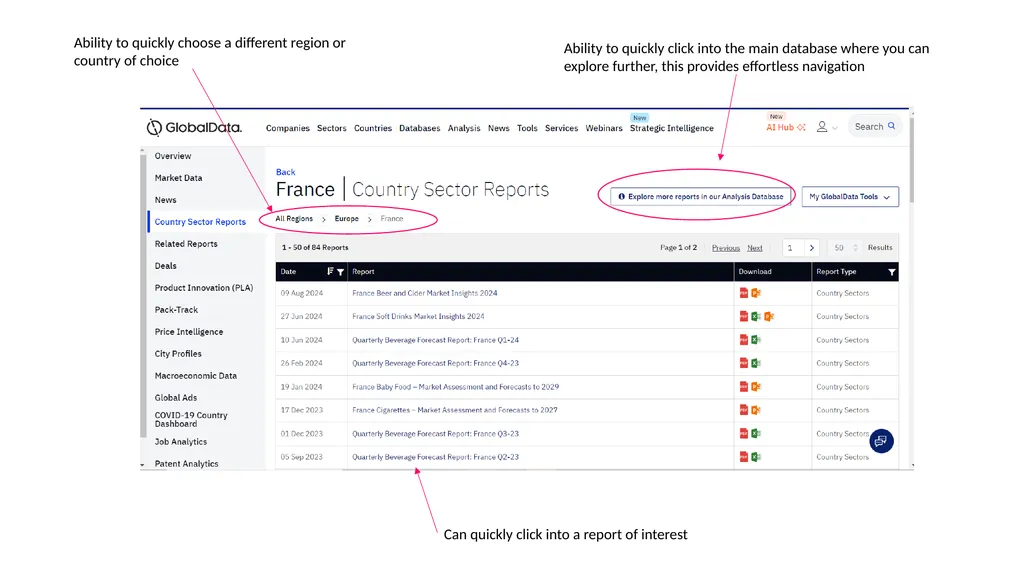
Ability to quickly click into the main database where you can explore further, this provides effortless navigation Can quickly click into a report of interest Ability to quickly choose a different region or country of choice<br>
32
Ability to narrow down the search to city level Can now explore further databases with a specific focus on city level<br>
33
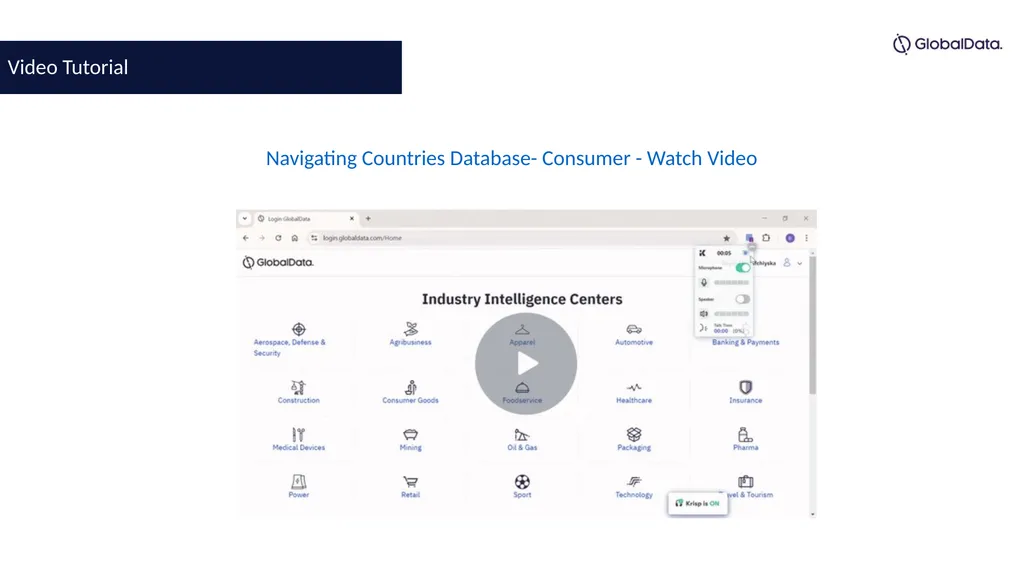
Navigating Countries Database- Consumer - Watch Video Video Tutorial<br>
34
4. COMPANIES Click to Access<br>
35
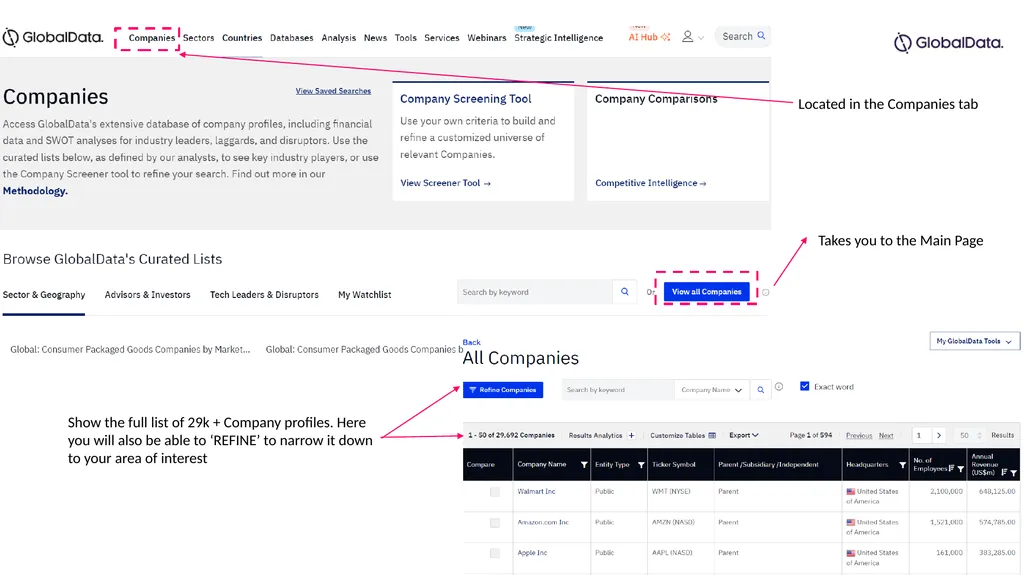
Located in the Companies tab Takes you to the Main Page Show the full list of 29k + Company profiles. Here you will also be able to ‘REFINE’ to narrow it down to your area of interest<br>
36
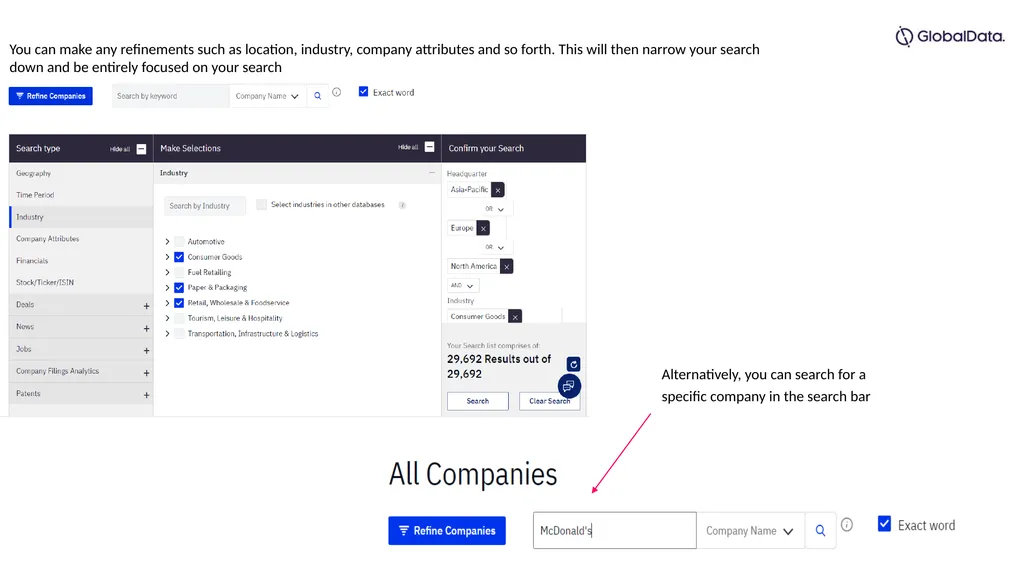
You can make any refinements such as location, industry, company attributes and so forth. This will then narrow your search down and be entirely focused on your search Alternatively, you can search for a specific company in the search bar<br>
37
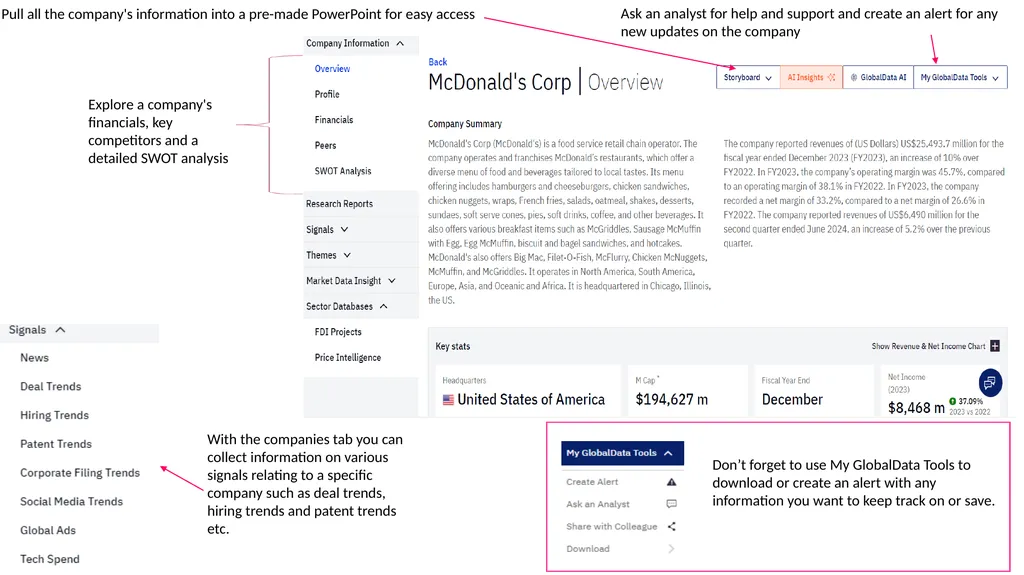
Ask an analyst for help and support and create an alert for any new updates on the company Pull all the company's information into a pre-made PowerPoint for easy access Explore a company's financials, key competitors and a detailed SWOT analysis With the companies tab you can collect information on various signals relating to a specific company such as deal trends, hiring trends and patent trends etc. Don’t forget to use My GlobalData Tools to download or create an alert with any information you want to keep track on or save.<br>
38
Exploring GlobalData's Company Database - Watch Video Video Tutorial<br>
39
4. TrendSights Click to Access<br>
40
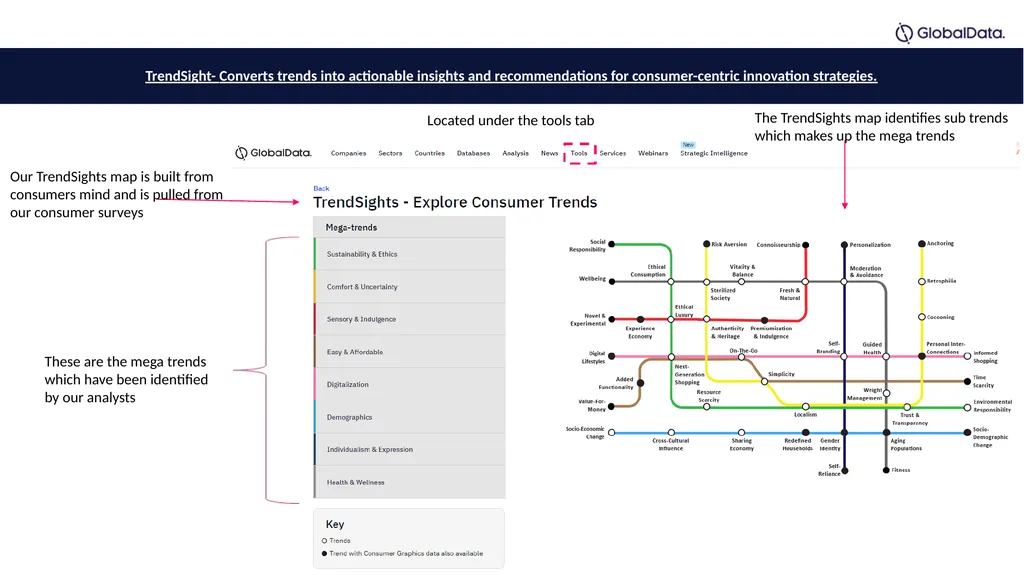
These are the mega trends which have been identified by our analysts Located under the tools tab Our TrendSights map is built from consumers mind and is pulled from our consumer surveys The TrendSights map identifies sub trends which makes up the mega trends TrendSight- Converts trends into actionable insights and recommendations for consumer-centric innovation strategies.<br>
41
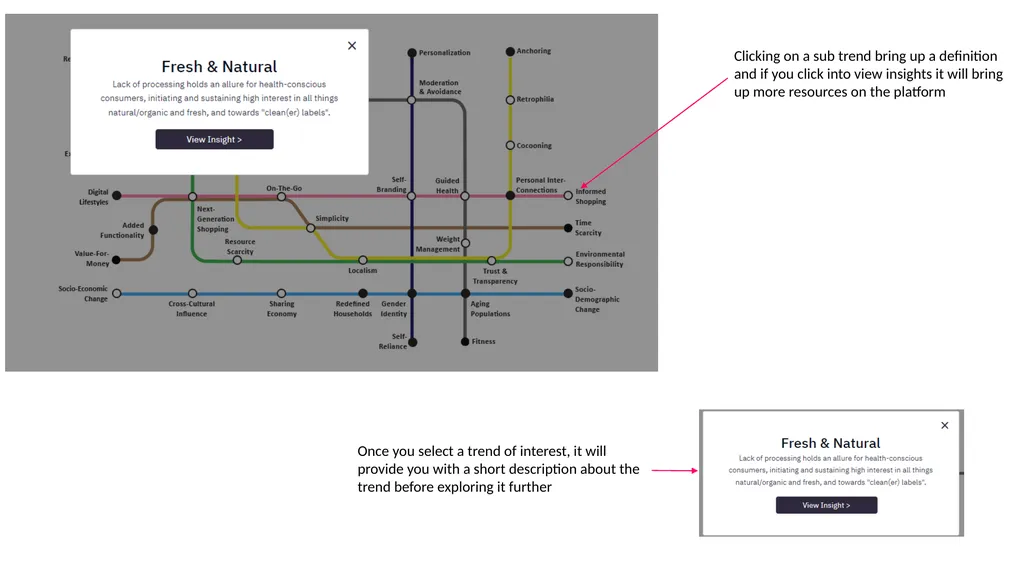
Clicking on a sub trend bring up a definition and if you click into view insights it will bring up more resources on the platform Once you select a trend of interest, it will provide you with a short description about the trend before exploring it further<br>
42
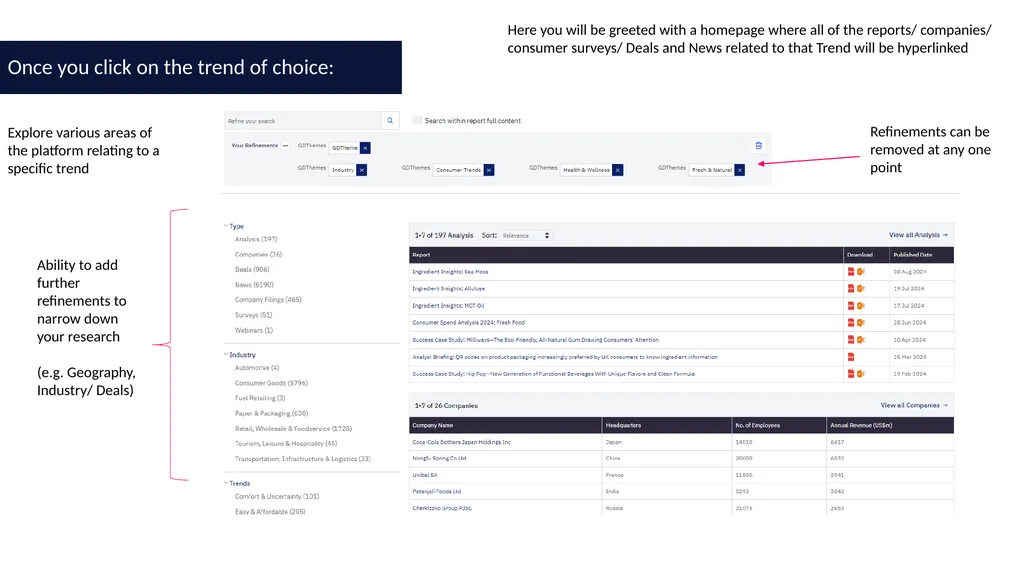
Explore various areas of the platform relating to a specific trend Here you will be greeted with a homepage where all of the reports/ companies/ consumer surveys/ Deals and News related to that Trend will be hyperlinked Ability to add further refinements to narrow down your research
(e.g. Geography, Industry/ Deals) Refinements can be removed at any one point Once you click on the trend of choice:<br>
(e.g. Geography, Industry/ Deals) Refinements can be removed at any one point Once you click on the trend of choice:<br>
43
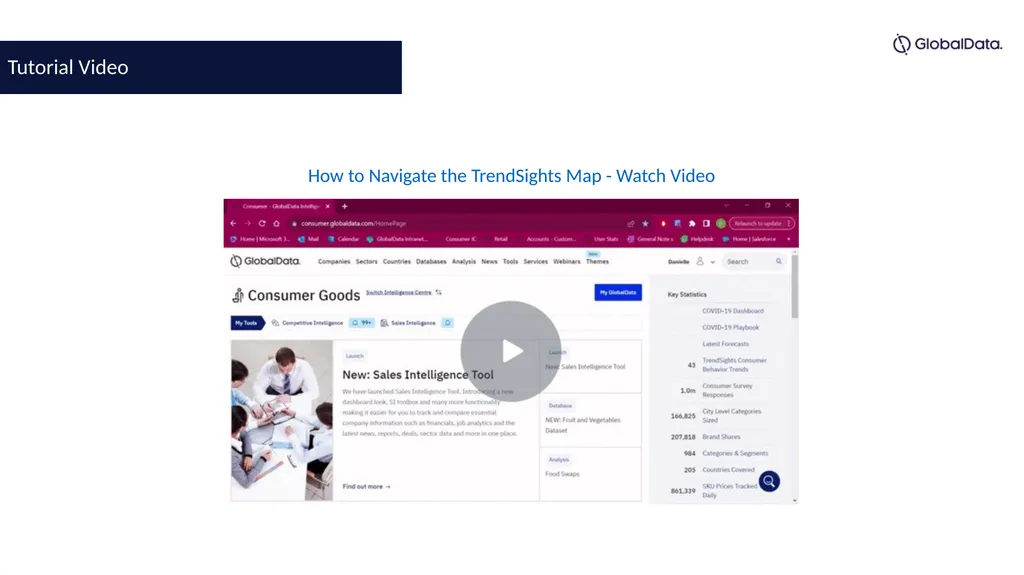
How to Navigate the TrendSights Map - Watch Video Tutorial Video<br>
44
5. AI Hub<br>
45
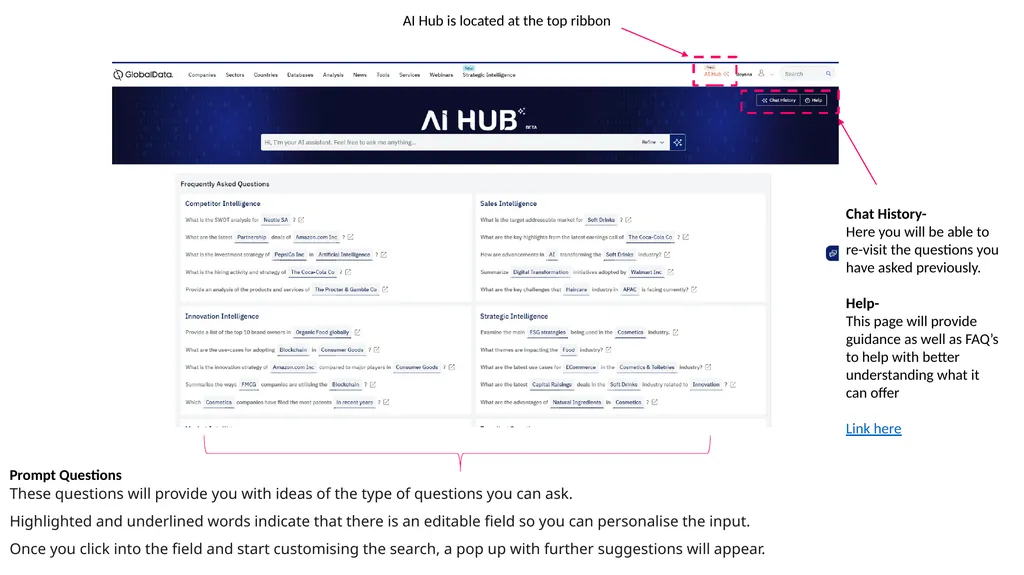
AI Hub is located at the top ribbon Chat History-
Here you will be able to re-visit the questions you have asked previously.
Help-
This page will provide guidance as well as FAQ’s to help with better understanding what it can offer
Link here Prompt Questions
These questions will provide you with ideas of the type of questions you can ask.
Highlighted and underlined words indicate that there is an editable field so you can personalise the input.
Once you click into the field and start customising the search, a pop up with further suggestions will appear.<br>
Here you will be able to re-visit the questions you have asked previously.
Help-
This page will provide guidance as well as FAQ’s to help with better understanding what it can offer
Link here Prompt Questions
These questions will provide you with ideas of the type of questions you can ask.
Highlighted and underlined words indicate that there is an editable field so you can personalise the input.
Once you click into the field and start customising the search, a pop up with further suggestions will appear.<br>
46
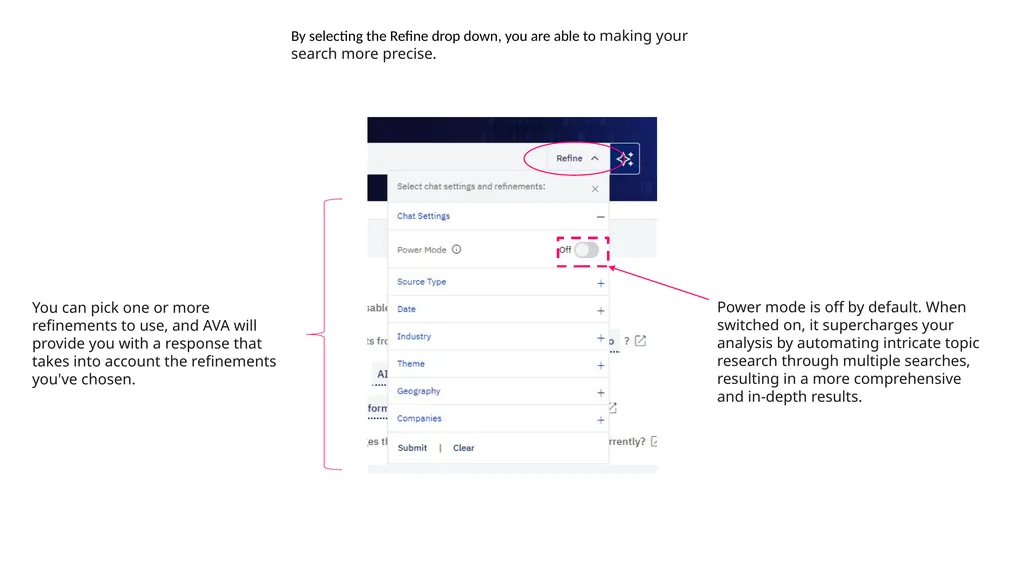
Power mode is off by default. When switched on, it supercharges your analysis by automating intricate topic research through multiple searches, resulting in a more comprehensive and in-depth results. By selecting the Refine drop down, you are able to making your search more precise. You can pick one or more refinements to use, and AVA will provide you with a response that takes into account the refinements you've chosen.<br>
47
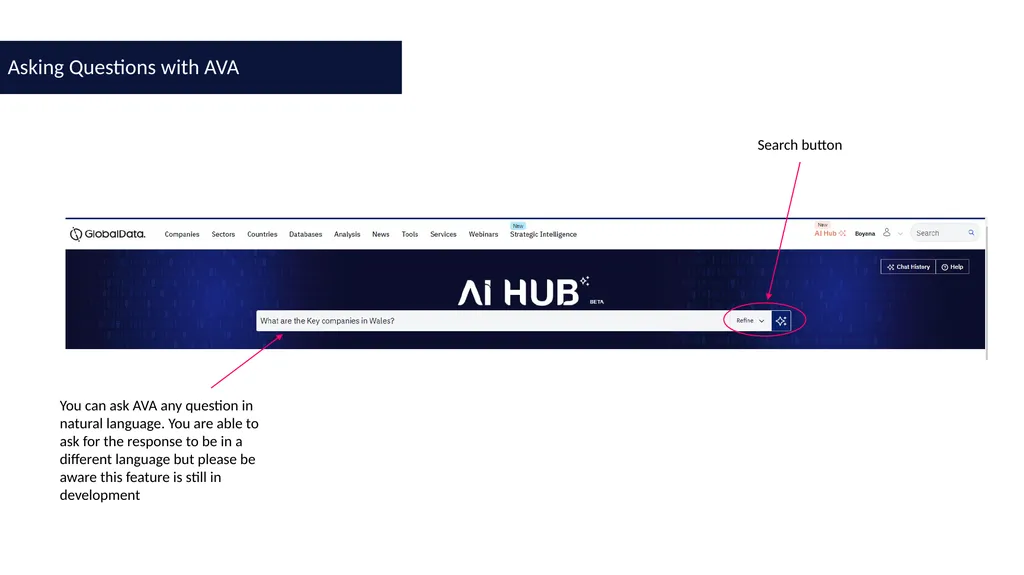
Search button You can ask AVA any question in natural language. You are able to ask for the response to be in a different language but please be aware this feature is still in development Asking Questions with AVA<br>
48
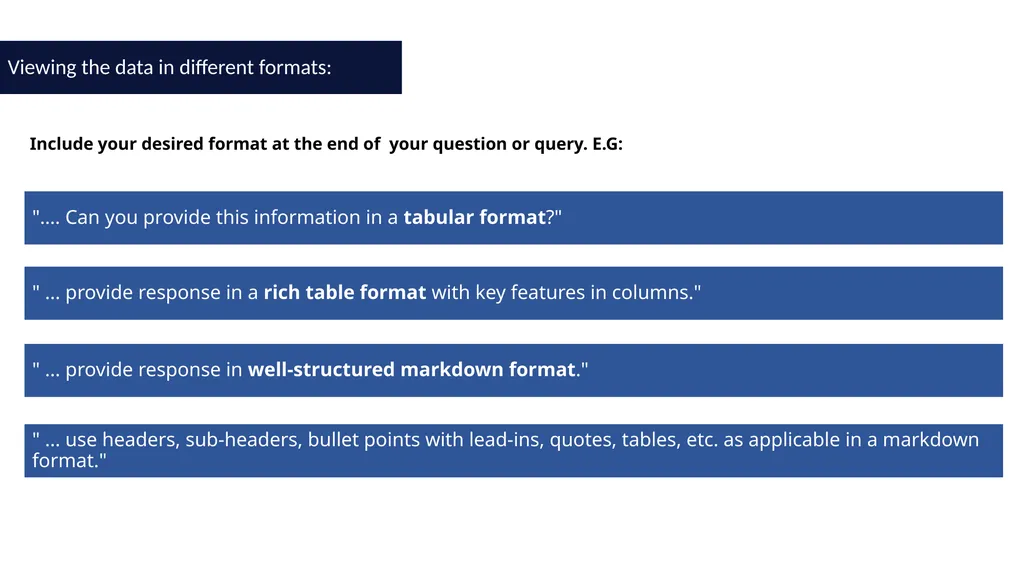
Include your desired format at the end of your question or query. E.G: Viewing the data in different formats: "…. Can you provide this information in a tabular format?" " ... provide response in a rich table format with key features in columns." " ... provide response in well-structured markdown format." " ... use headers, sub-headers, bullet points with lead-ins, quotes, tables, etc. as applicable in a markdown format."<br>
49
Add Favourite: This feature allows you to mark specific responses as your favourites. These chosen responses will be placed at the very top of your chat history, making them super easy to find whenever you need them.
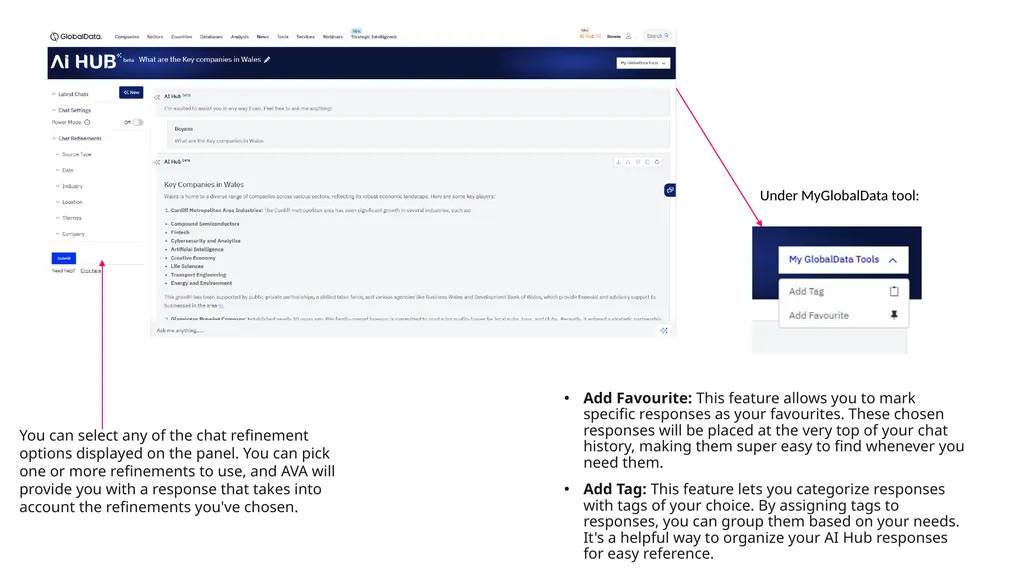
Add Tag: This feature lets you categorize responses with tags of your choice. By assigning tags to responses, you can group them based on your needs. It's a helpful way to organize your AI Hub responses for easy reference. Under MyGlobalData tool: You can select any of the chat refinement options displayed on the panel. You can pick one or more refinements to use, and AVA will provide you with a response that takes into account the refinements you've chosen.<br>
Add Tag: This feature lets you categorize responses with tags of your choice. By assigning tags to responses, you can group them based on your needs. It's a helpful way to organize your AI Hub responses for easy reference. Under MyGlobalData tool: You can select any of the chat refinement options displayed on the panel. You can pick one or more refinements to use, and AVA will provide you with a response that takes into account the refinements you've chosen.<br>
50
Prompt Questions you can be asking
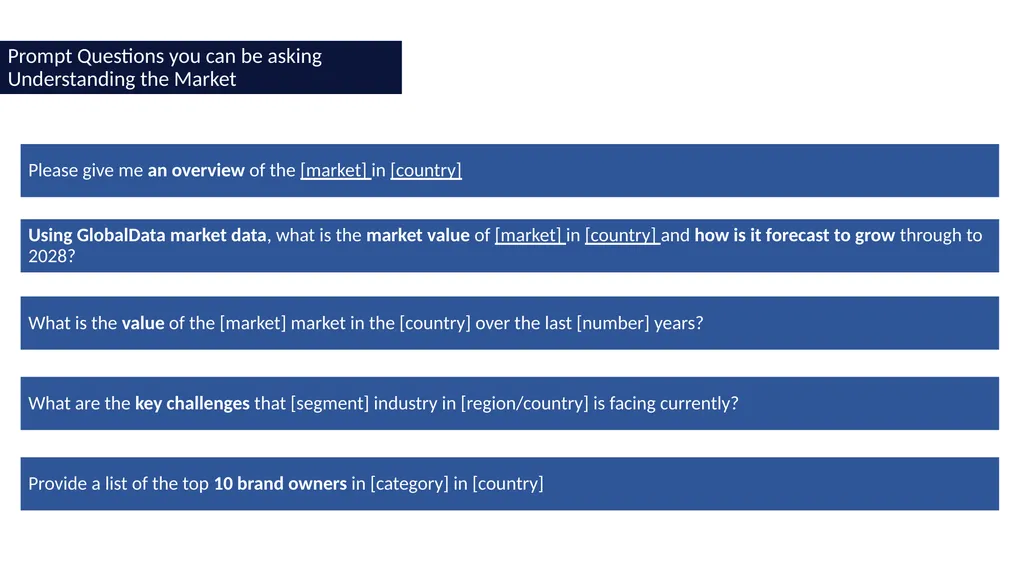
Understanding the Market Please give me an overview of the [market] in [country] Using GlobalData market data, what is the market value of [market] in [country] and how is it forecast to grow through to 2028? What is the value of the [market] market in the [country] over the last [number] years? What are the key challenges that [segment] industry in [region/country] is facing currently? Provide a list of the top 10 brand owners in [category] in [country]<br>
Understanding the Market Please give me an overview of the [market] in [country] Using GlobalData market data, what is the market value of [market] in [country] and how is it forecast to grow through to 2028? What is the value of the [market] market in the [country] over the last [number] years? What are the key challenges that [segment] industry in [region/country] is facing currently? Provide a list of the top 10 brand owners in [category] in [country]<br>
51
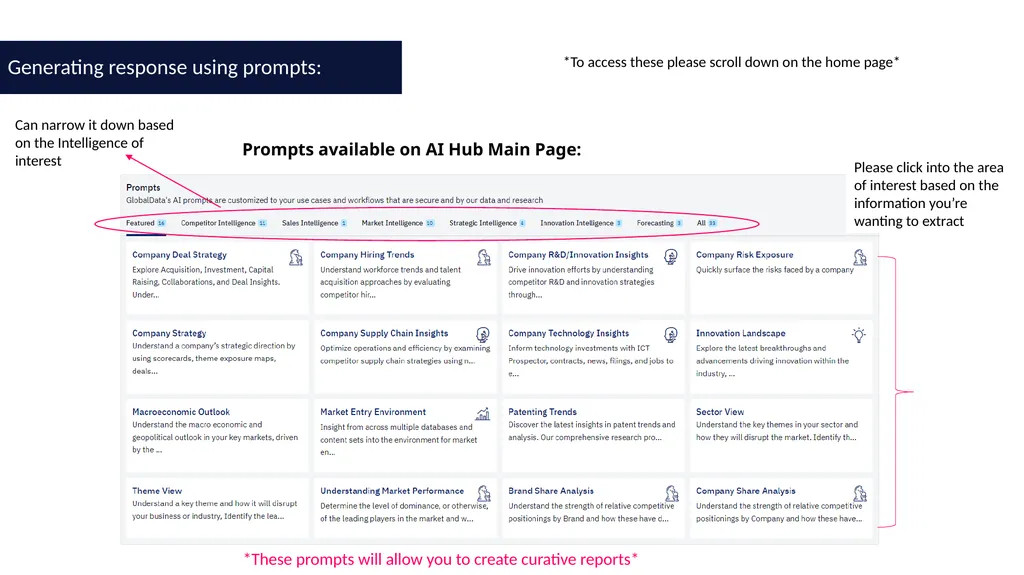
Prompts available on AI Hub Main Page: Please click into the area of interest based on the information you’re wanting to extract Can narrow it down based on the Intelligence of interest *To access these please scroll down on the home page* *These prompts will allow you to create curative reports* Generating response using prompts:<br>
52
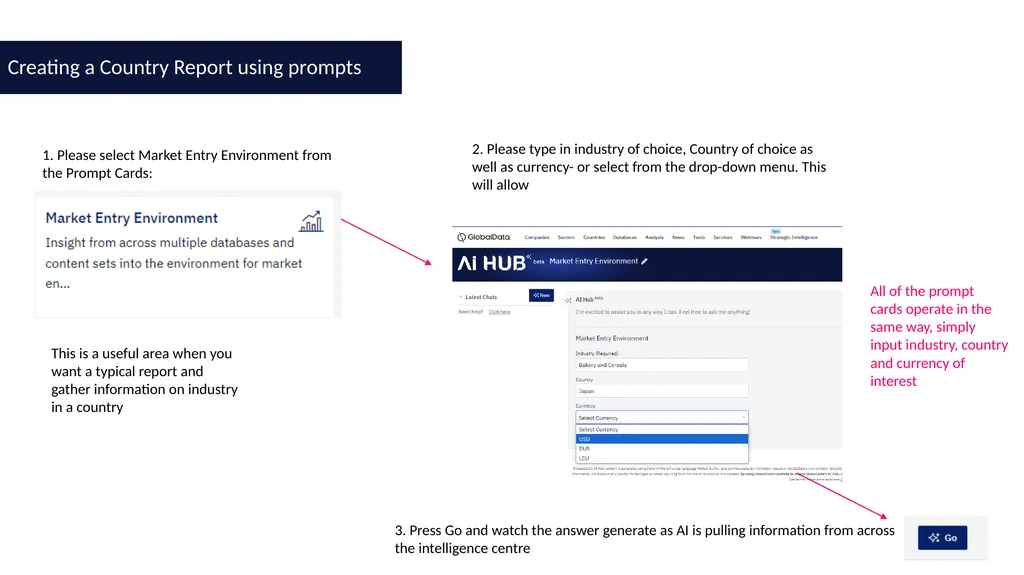
1. Please select Market Entry Environment from the Prompt Cards: 2. Please type in industry of choice, Country of choice as well as currency- or select from the drop-down menu. This will allow 3. Press Go and watch the answer generate as AI is pulling information from across the intelligence centre All of the prompt cards operate in the same way, simply input industry, country and currency of interest This is a useful area when you want a typical report and gather information on industry in a country Creating a Country Report using prompts<br>
53
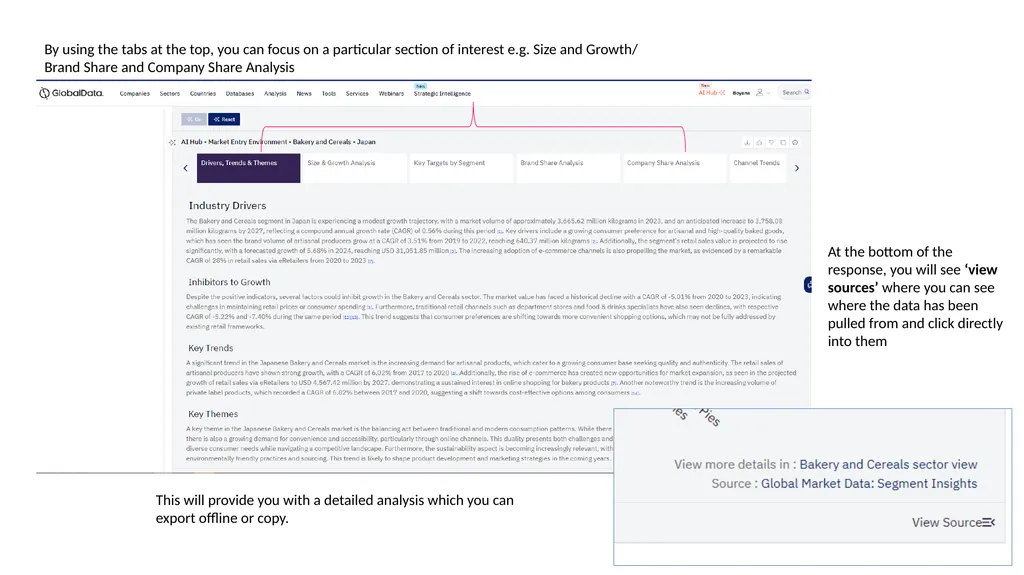
This will provide you with a detailed analysis which you can export offline or copy. By using the tabs at the top, you can focus on a particular section of interest e.g. Size and Growth/ Brand Share and Company Share Analysis At the bottom of the response, you will see ‘view sources’ where you can see where the data has been pulled from and click directly into them<br>
54
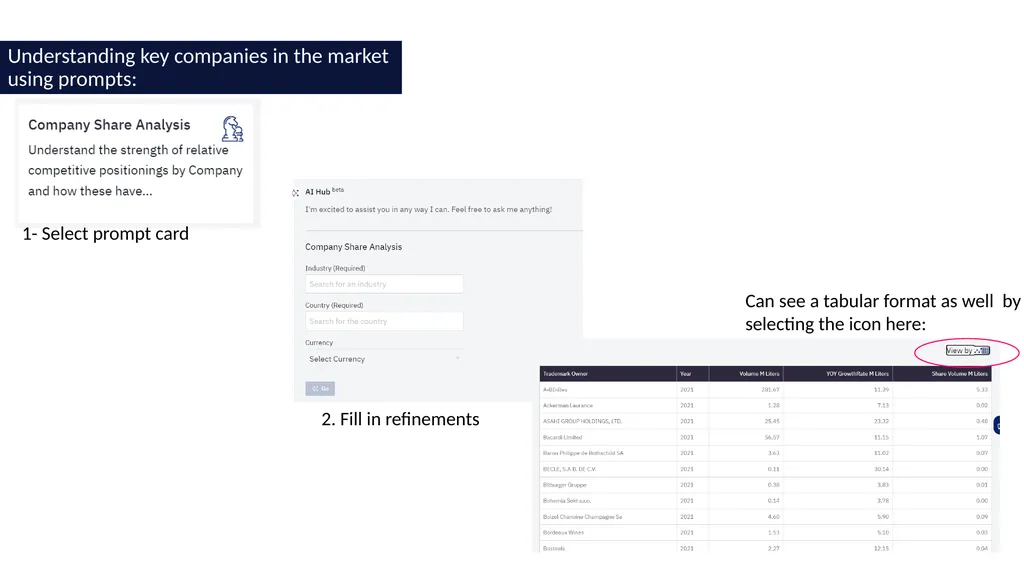
Understanding Key Retailers in a Country Can see a tabular format as well by selecting the icon here: Understanding key companies in the market using prompts: 1- Select prompt card 2. Fill in refinements<br>
55
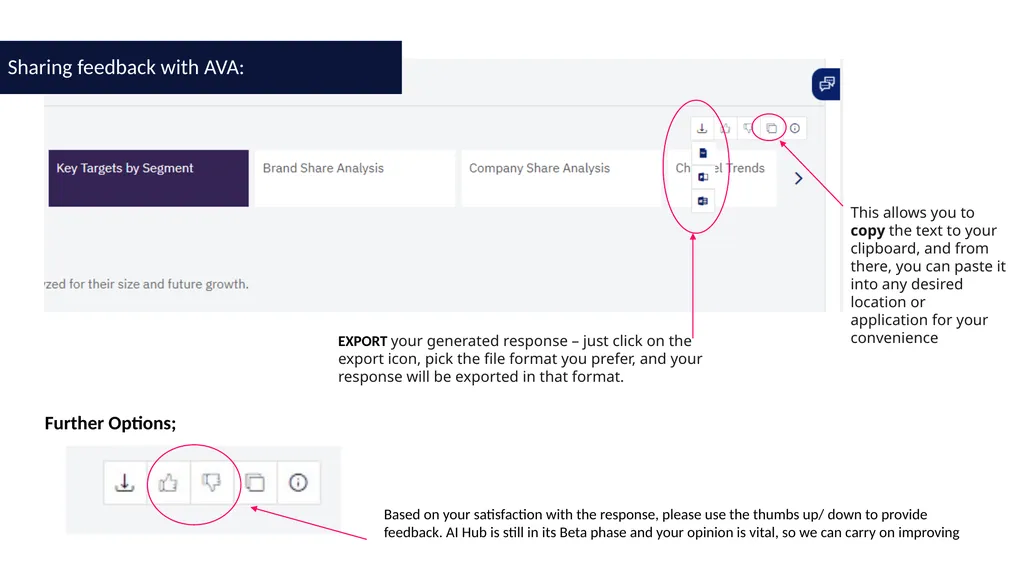
EXPORT your generated response – just click on the export icon, pick the file format you prefer, and your response will be exported in that format. This allows you to copy the text to your clipboard, and from there, you can paste it into any desired location or application for your convenience Further Options; Based on your satisfaction with the response, please use the thumbs up/ down to provide feedback. AI Hub is still in its Beta phase and your opinion is vital, so we can carry on improving Sharing feedback with AVA:<br>
56
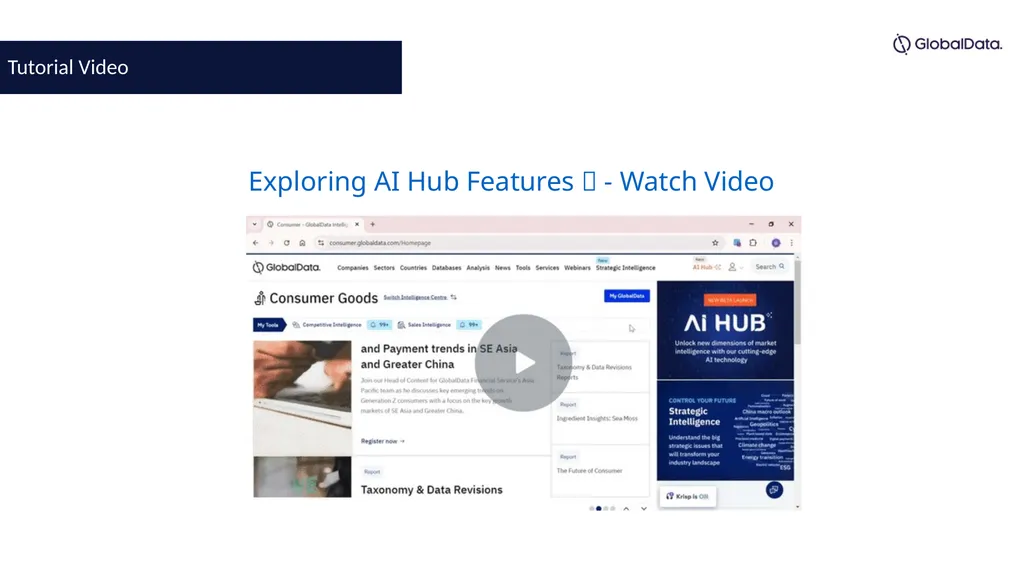
Tutorial Video Exploring AI Hub Features 🚀 - Watch Video<br>
57
6. EXTRA VIDEOS<br>
58
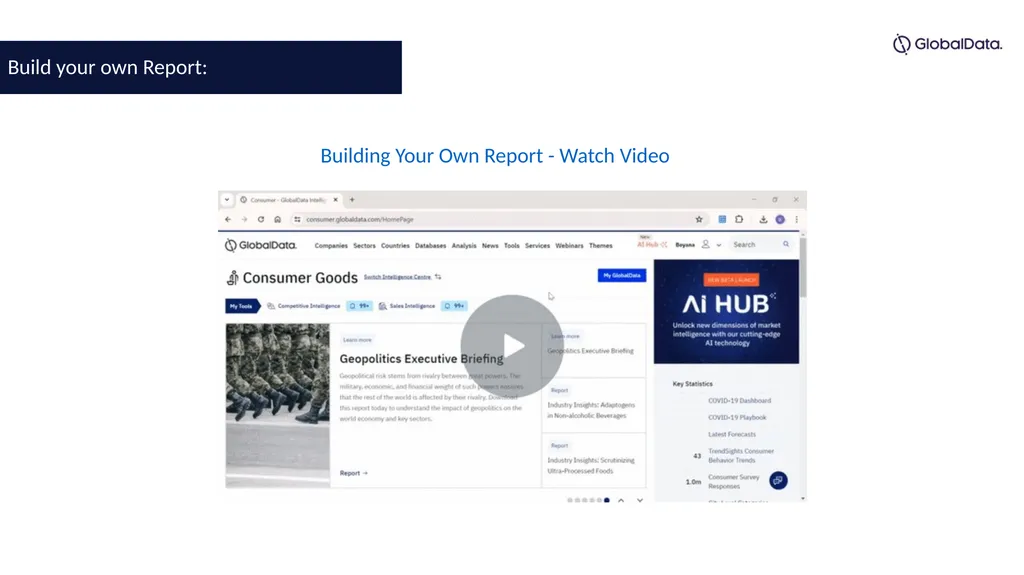
Building Your Own Report - Watch Video Build your own Report:<br>
59
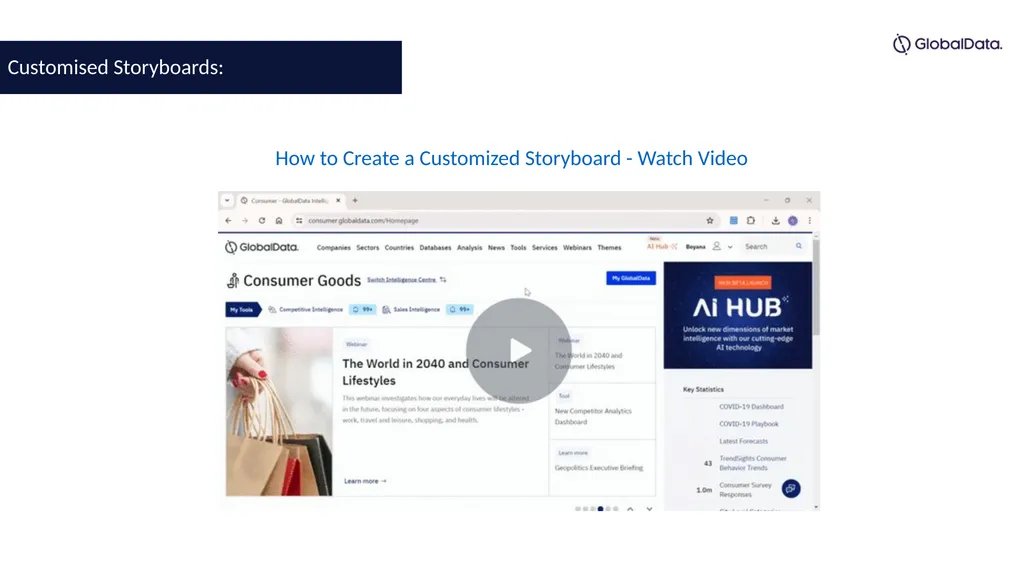
How to Create a Customized Storyboard - Watch Video Customised Storyboards:<br>