
Corporate Finance for Long-Term Value Chapter 6:


Description: Corporate Finance for Long-Term Value Chapter 6: Investment decision rules Chapter 6: Investment decision rules Part 2: Discount rates and valuation methods The BIG Picture 3 How to select investment projects? Traditional solution Calculate
Related Topics
Download Presentation
"Corporate Finance for Long-Term Value Chapter 6:" is the property of its rightful owner. Permission is granted to download and print the materials on this website for personal, non-commercial use only, and to display it on your personal computer provided you do not modify the materials and that you retain all copyright notices contained in the materials. By downloading content from our website, you accept the terms of this agreement.
Presentation Transcript
slide1. Corporate Finance for
Long-Term Value Chapter 6: Investment decision rules<br>
slide2. Chapter 6: Investment decision rules Part 2: Discount rates and valuation methods<br>
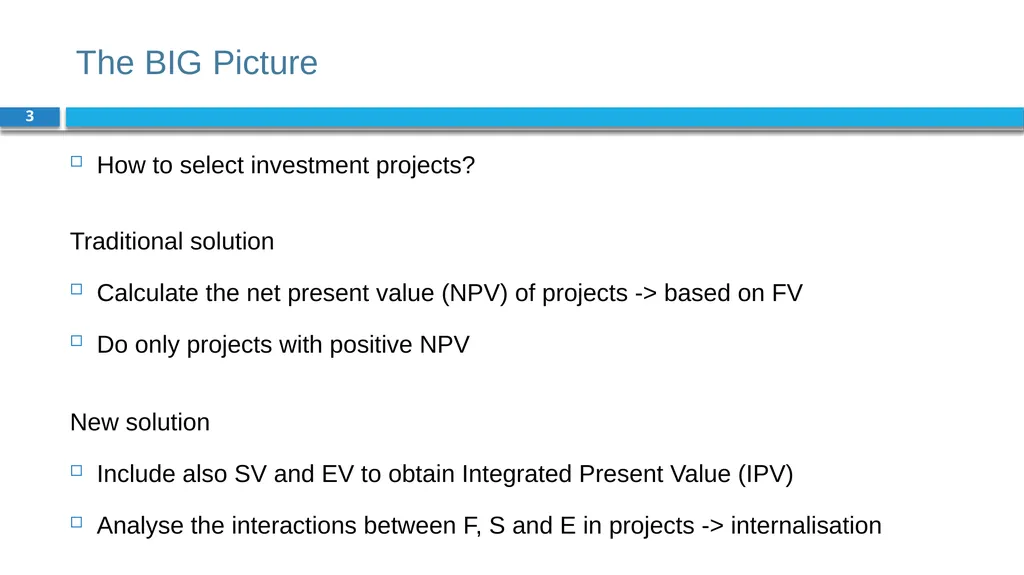
slide3. The BIG Picture 3 How to select investment projects?
Traditional solution
Calculate the net present value (NPV) of projects -> based on FV
Do only projects with positive NPV
New solution
Include also SV and EV to obtain Integrated Present Value (IPV)
Analyse the interactions between F, S and E in projects -> internalisation<br>
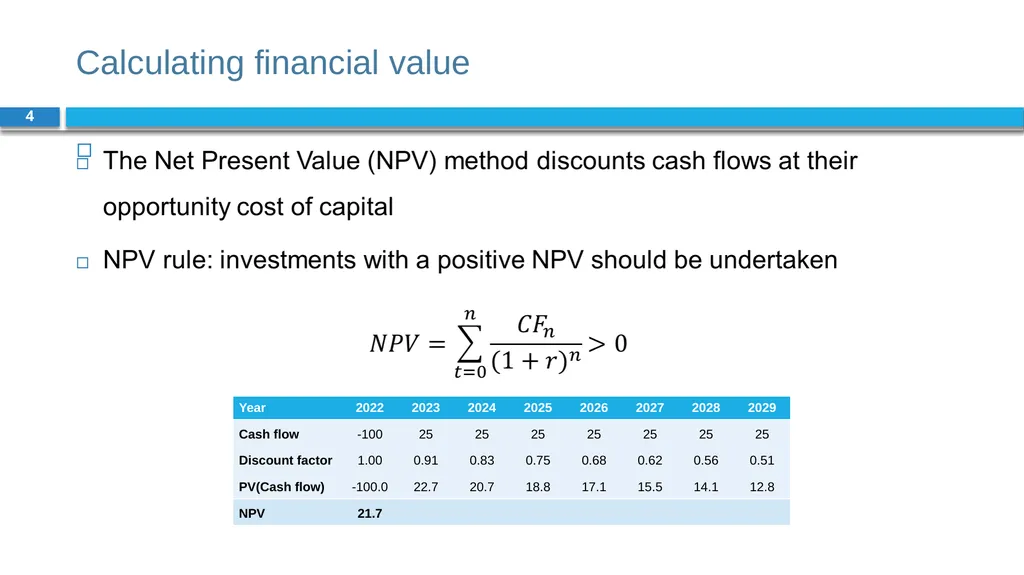
slide4. Calculating financial value 4<br>
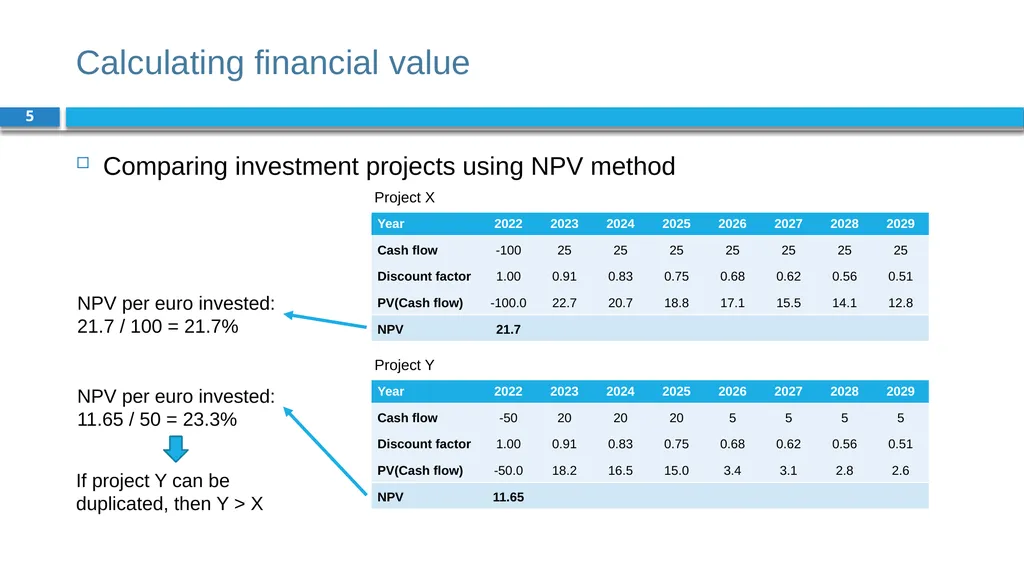
slide5. Calculating financial value 5 Comparing investment projects using NPV method NPV per euro invested:
21.7 / 100 = 21.7% NPV per euro invested:
11.65 / 50 = 23.3% If project Y can be duplicated, then Y > X Project Y Project X<br>
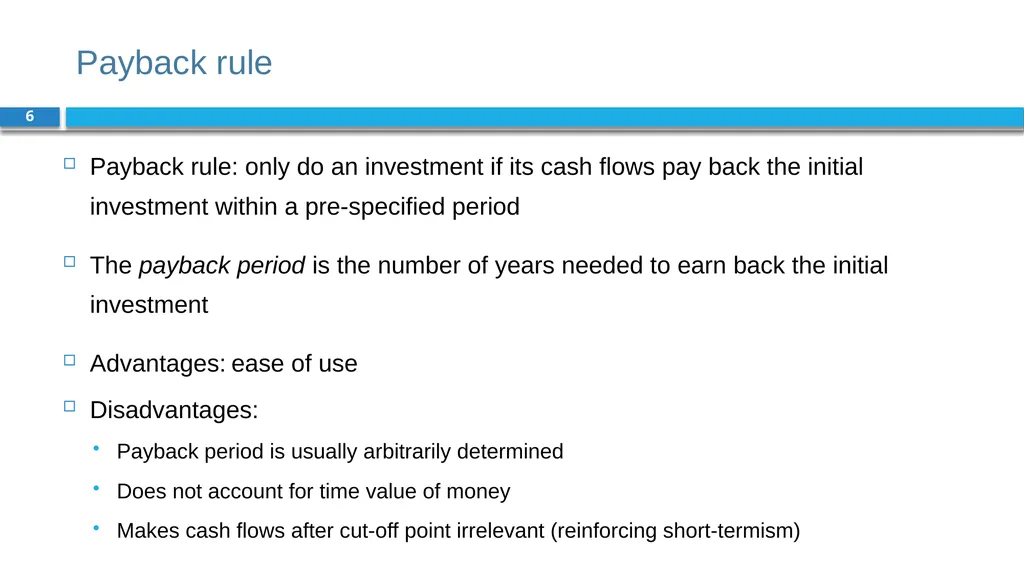
slide6. Payback rule 6 Payback rule: only do an investment if its cash flows pay back the initial investment within a pre-specified period
The payback period is the number of years needed to earn back the initial investment
Advantages: ease of use
Disadvantages:
Payback period is usually arbitrarily determined
Does not account for time value of money
Makes cash flows after cut-off point irrelevant (reinforcing short-termism)<br>
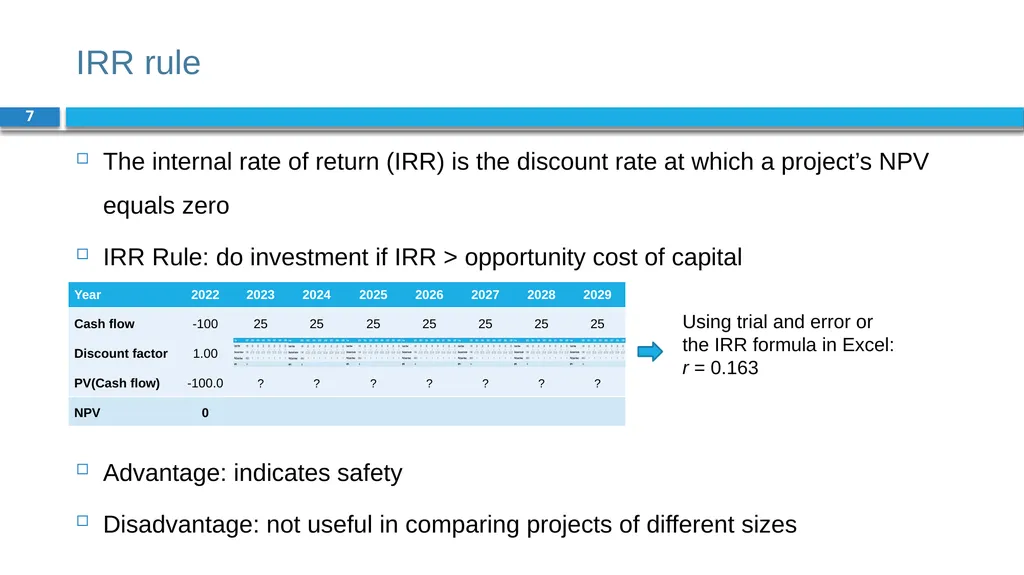
slide7. IRR rule 7 The internal rate of return (IRR) is the discount rate at which a project’s NPV equals zero
IRR Rule: do investment if IRR > opportunity cost of capital
Advantage: indicates safety
Disadvantage: not useful in comparing projects of different sizes Using trial and error or the IRR formula in Excel:
r = 0.163<br>
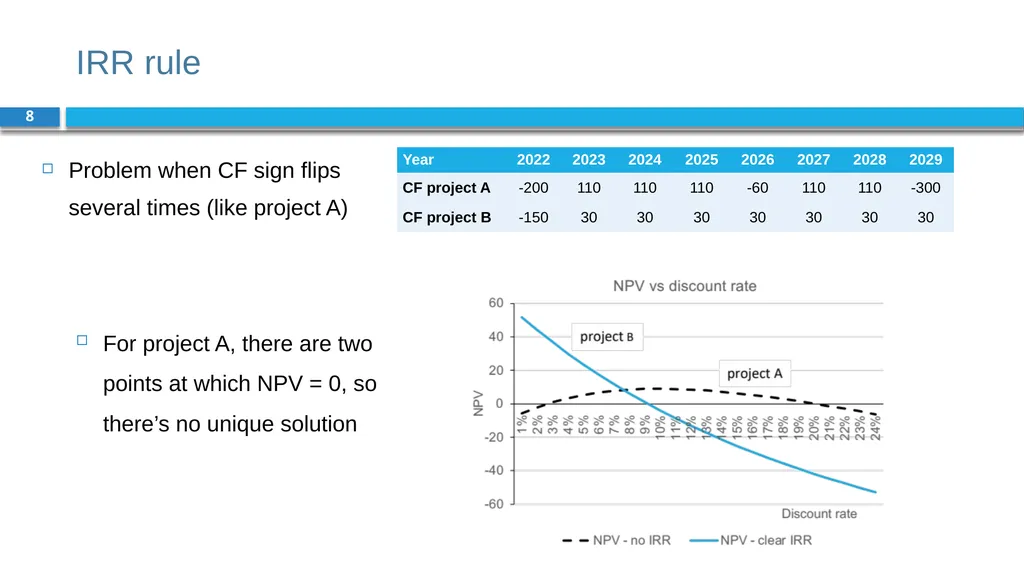
slide8. IRR rule 8 For project A, there are two points at which NPV = 0, so there’s no unique solution Problem when CF sign flips several times (like project A)<br>
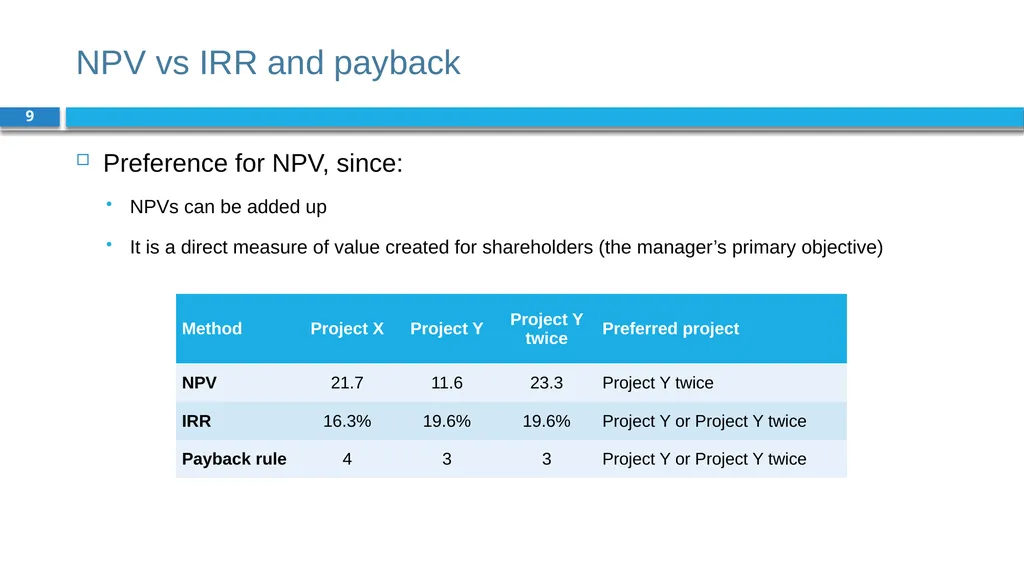
slide9. NPV vs IRR and payback 9 Preference for NPV, since:
NPVs can be added up
It is a direct measure of value created for shareholders (the manager’s primary objective)<br>
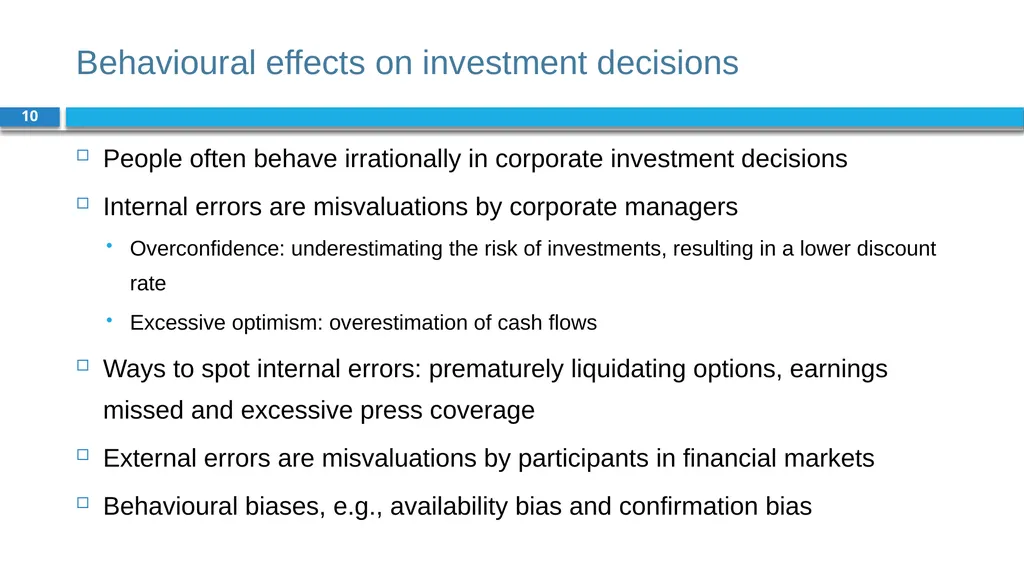
slide10. Behavioural effects on investment decisions 10 People often behave irrationally in corporate investment decisions
Internal errors are misvaluations by corporate managers
Overconfidence: underestimating the risk of investments, resulting in a lower discount rate
Excessive optimism: overestimation of cash flows
Ways to spot internal errors: prematurely liquidating options, earnings missed and excessive press coverage
External errors are misvaluations by participants in financial markets
Behavioural biases, e.g., availability bias and confirmation bias<br>
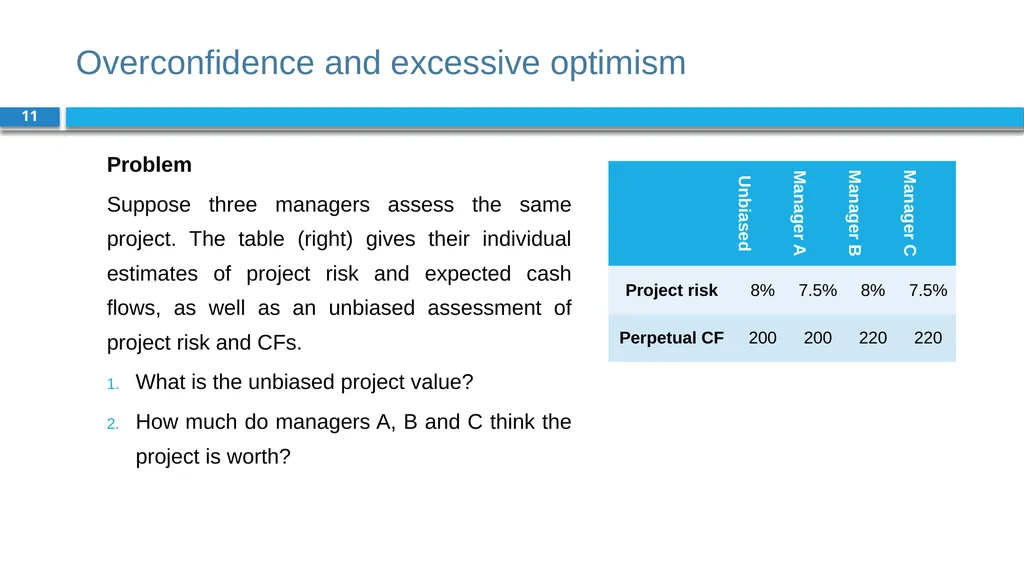
slide11. Overconfidence and excessive optimism 11 Problem
Suppose three managers assess the same project. The table (right) gives their individual estimates of project risk and expected cash flows, as well as an unbiased assessment of project risk and CFs.
What is the unbiased project value?
How much do managers A, B and C think the project is worth?<br>
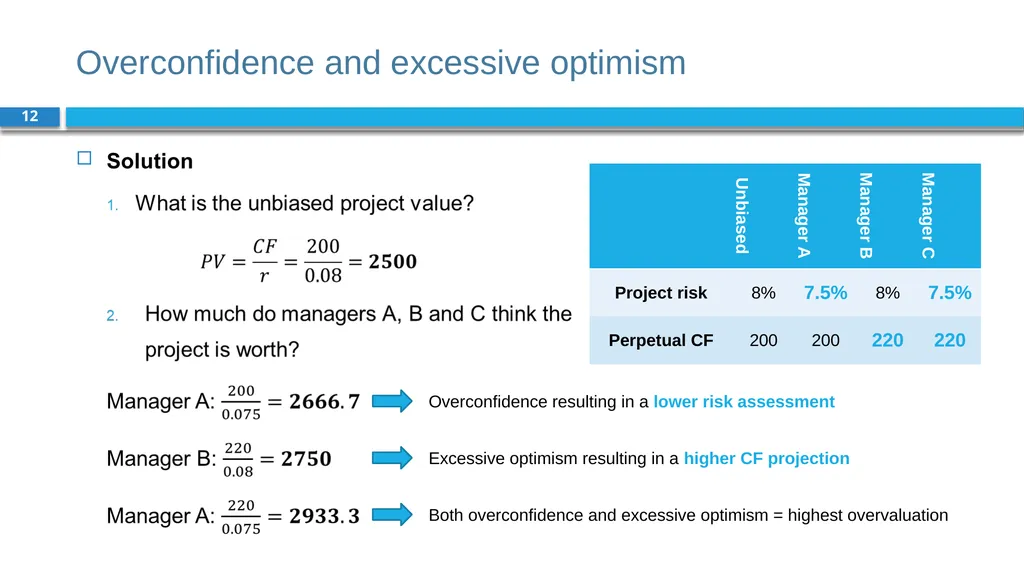
slide12. Overconfidence and excessive optimism 12 Overconfidence resulting in a lower risk assessment Excessive optimism resulting in a higher CF projection Both overconfidence and excessive optimism = highest overvaluation<br>
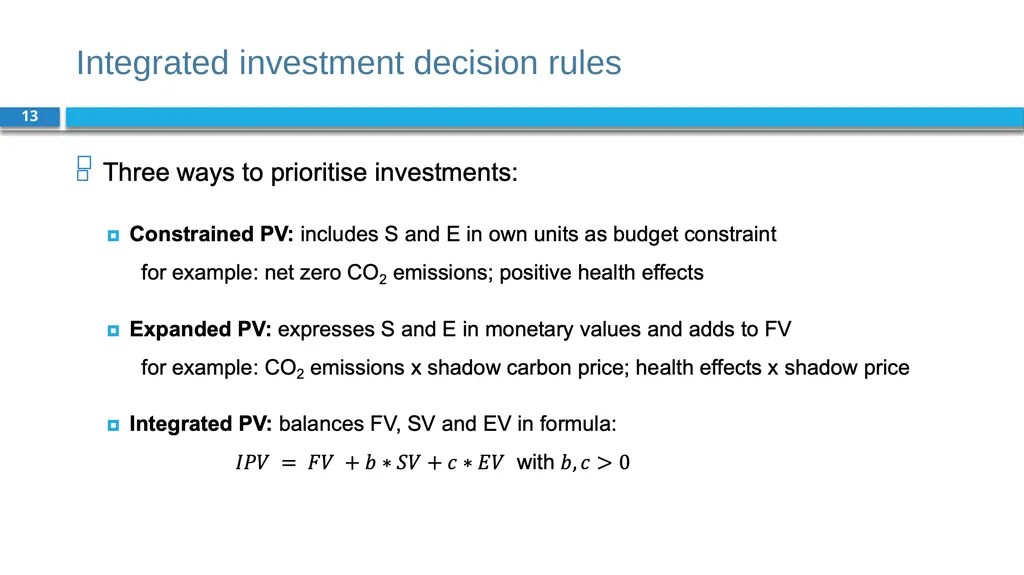
slide13. Integrated investment decision rules 13<br>
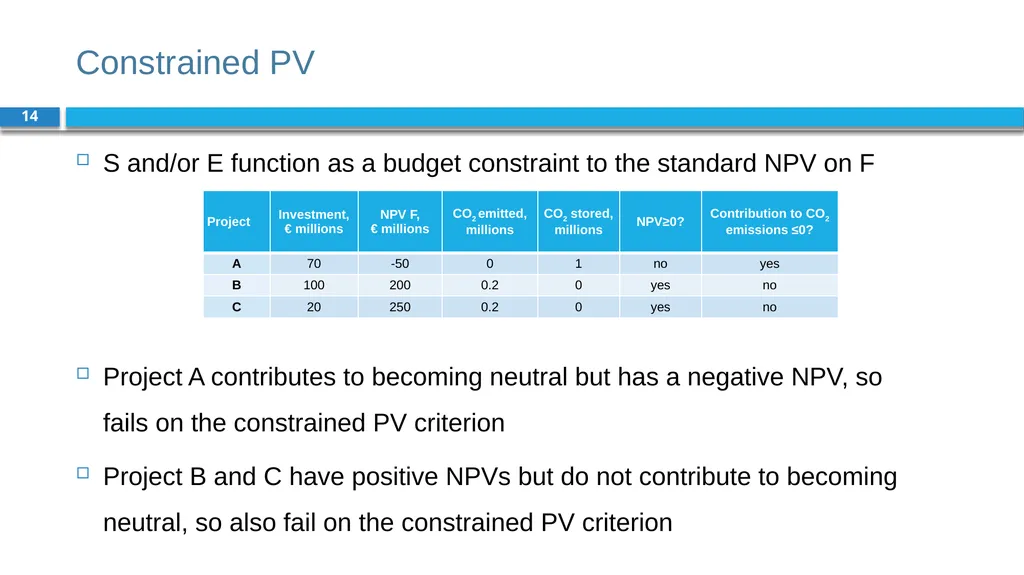
slide14. Constrained PV 14 S and/or E function as a budget constraint to the standard NPV on F
Project A contributes to becoming neutral but has a negative NPV, so fails on the constrained PV criterion
Project B and C have positive NPVs but do not contribute to becoming neutral, so also fail on the constrained PV criterion<br>
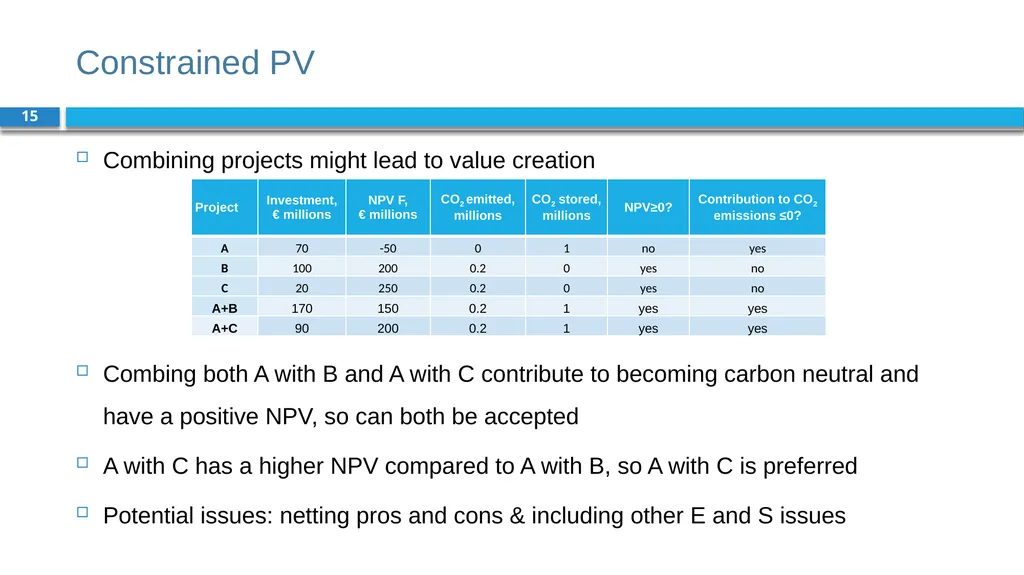
slide15. Constrained PV 15 Combining projects might lead to value creation
Combing both A with B and A with C contribute to becoming carbon neutral and have a positive NPV, so can both be accepted
A with C has a higher NPV compared to A with B, so A with C is preferred
Potential issues: netting pros and cons & including other E and S issues<br>
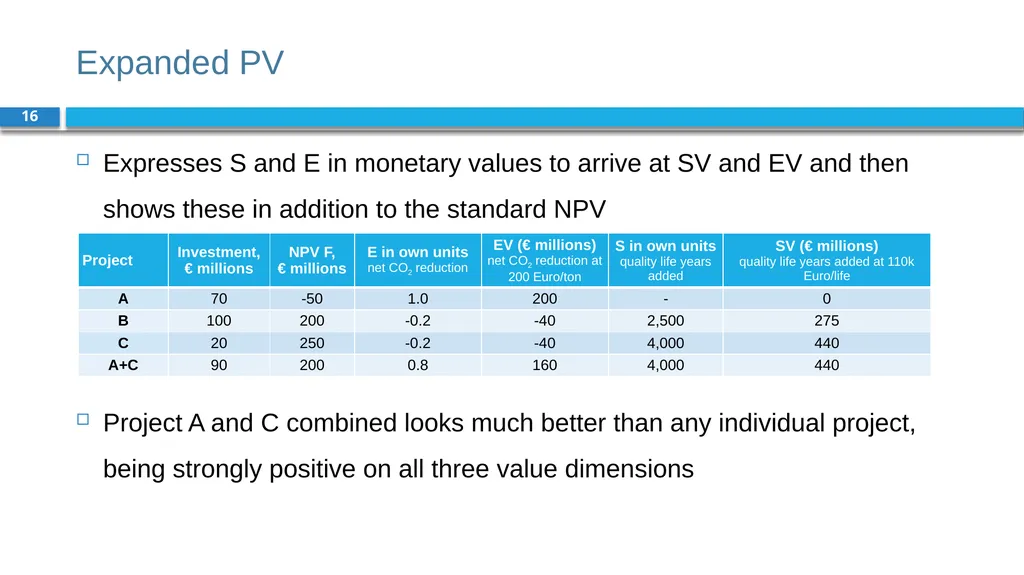
slide16. Expanded PV 16 Expresses S and E in monetary values to arrive at SV and EV and then shows these in addition to the standard NPV
Project A and C combined looks much better than any individual project, being strongly positive on all three value dimensions<br>
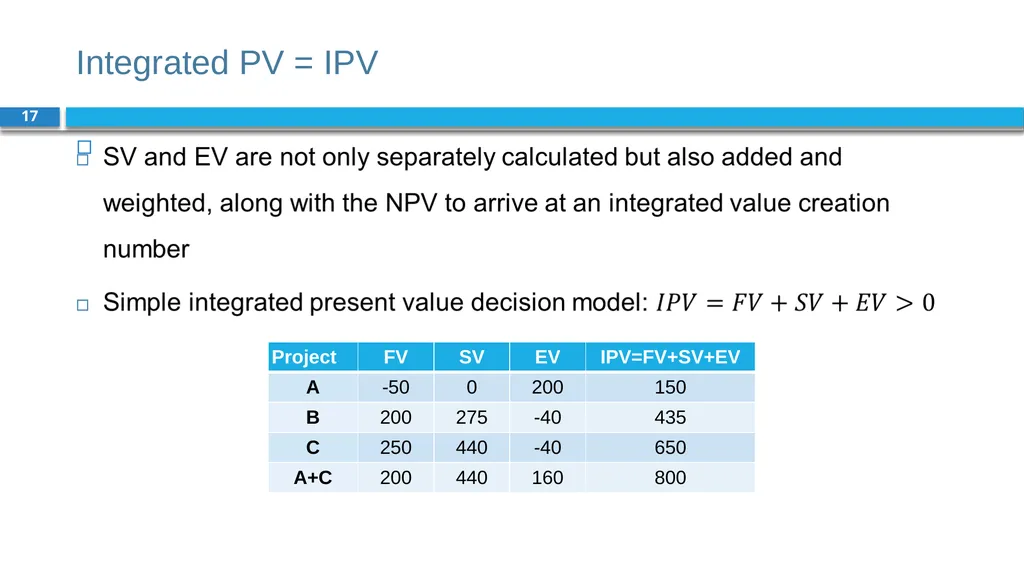
slide17. Integrated PV = IPV 17<br>
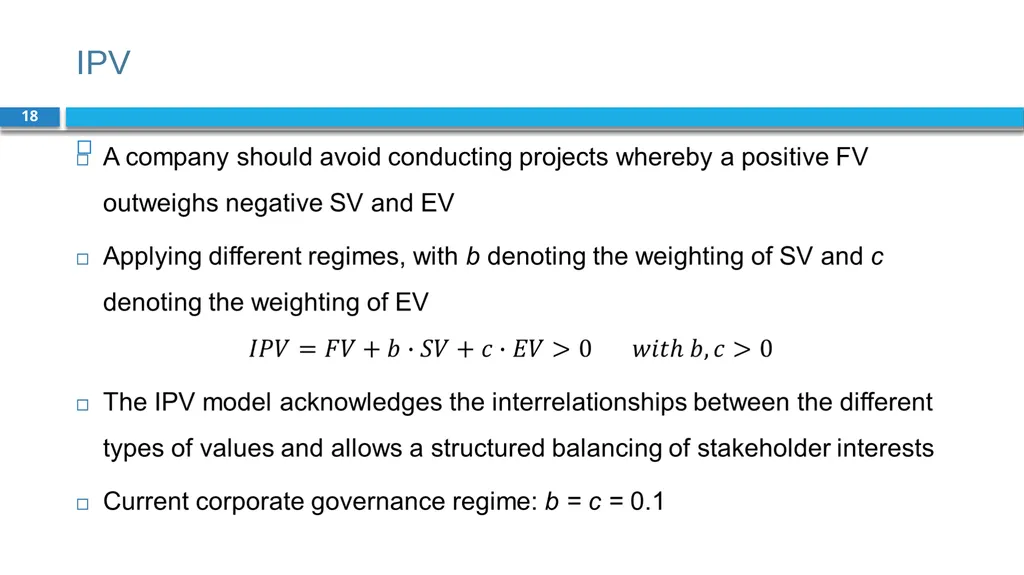
slide18. IPV 18<br>
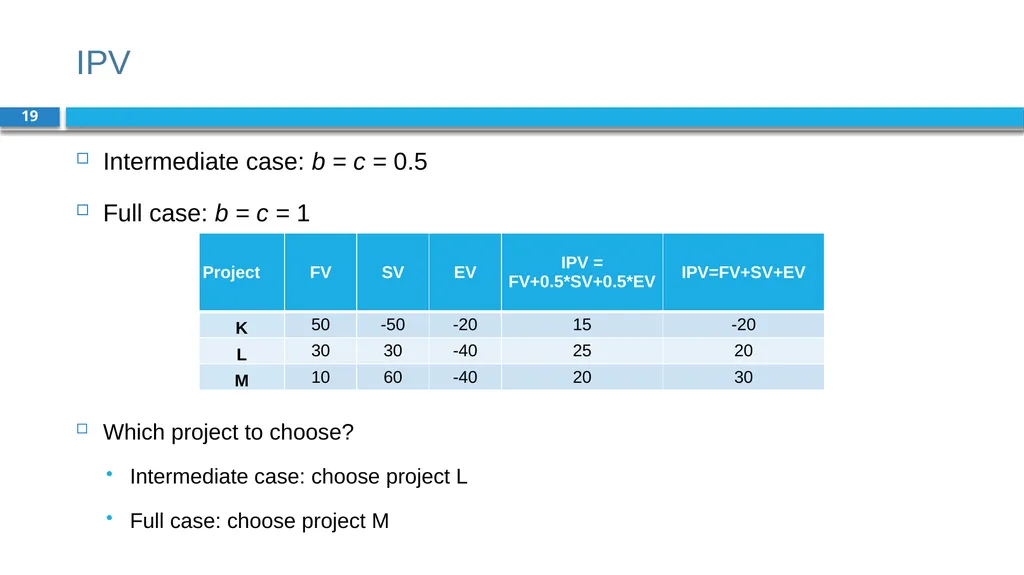
slide19. IPV 19 Intermediate case: b = c = 0.5
Full case: b = c = 1
Which project to choose?
Intermediate case: choose project L
Full case: choose project M<br>
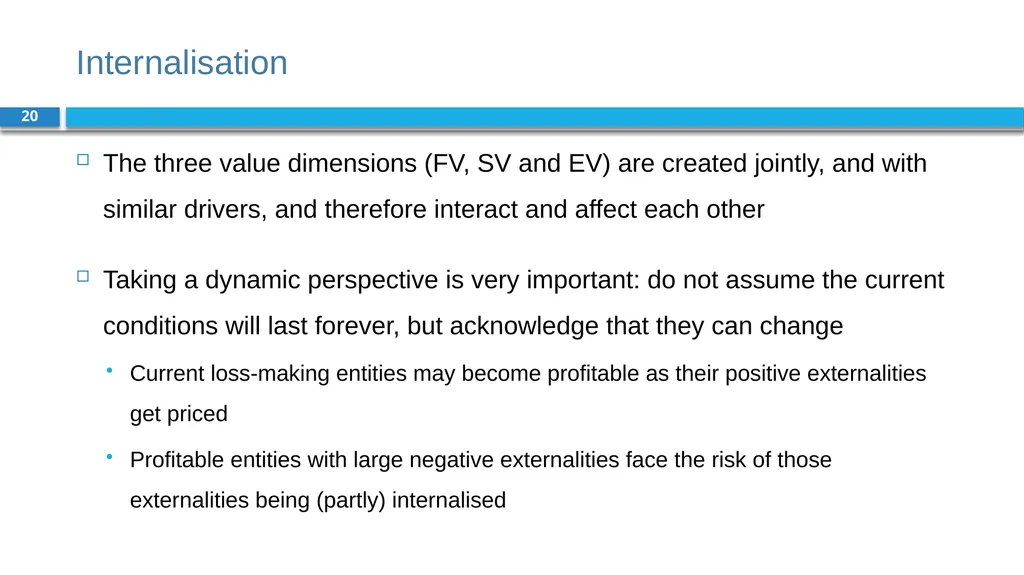
slide20. Internalisation 20 The three value dimensions (FV, SV and EV) are created jointly, and with similar drivers, and therefore interact and affect each other
Taking a dynamic perspective is very important: do not assume the current conditions will last forever, but acknowledge that they can change
Current loss-making entities may become profitable as their positive externalities get priced
Profitable entities with large negative externalities face the risk of those externalities being (partly) internalised<br>
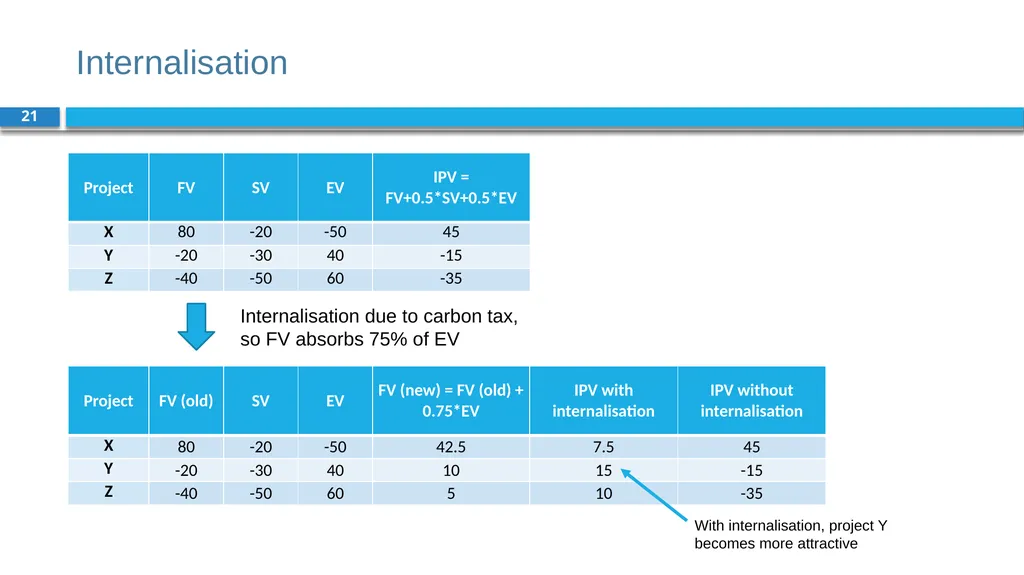
slide21. Internalisation 21 Internalisation due to carbon tax, so FV absorbs 75% of EV With internalisation, project Y becomes more attractive<br>
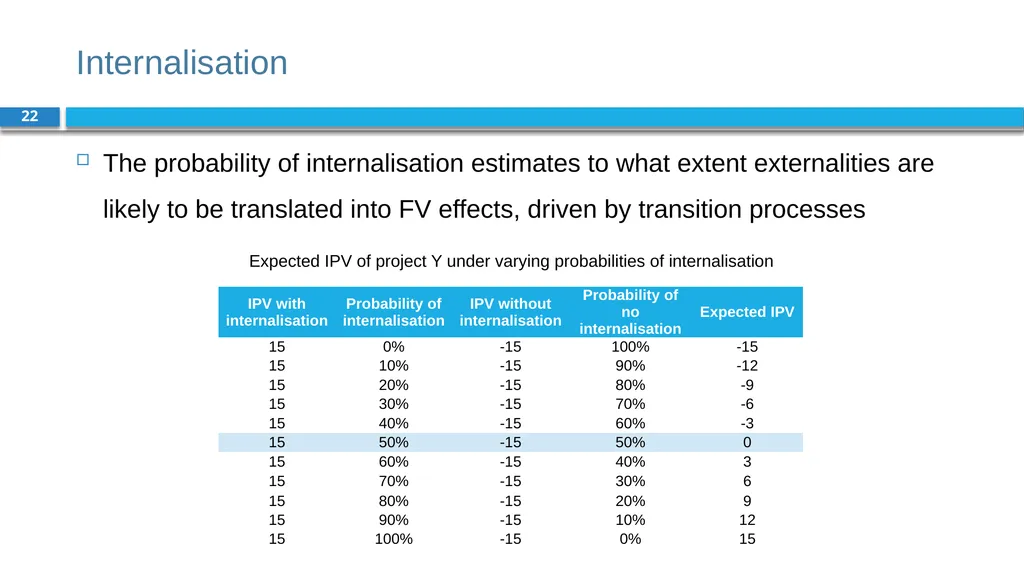
slide22. Internalisation 22 The probability of internalisation estimates to what extent externalities are likely to be translated into FV effects, driven by transition processes Expected IPV of project Y under varying probabilities of internalisation<br>
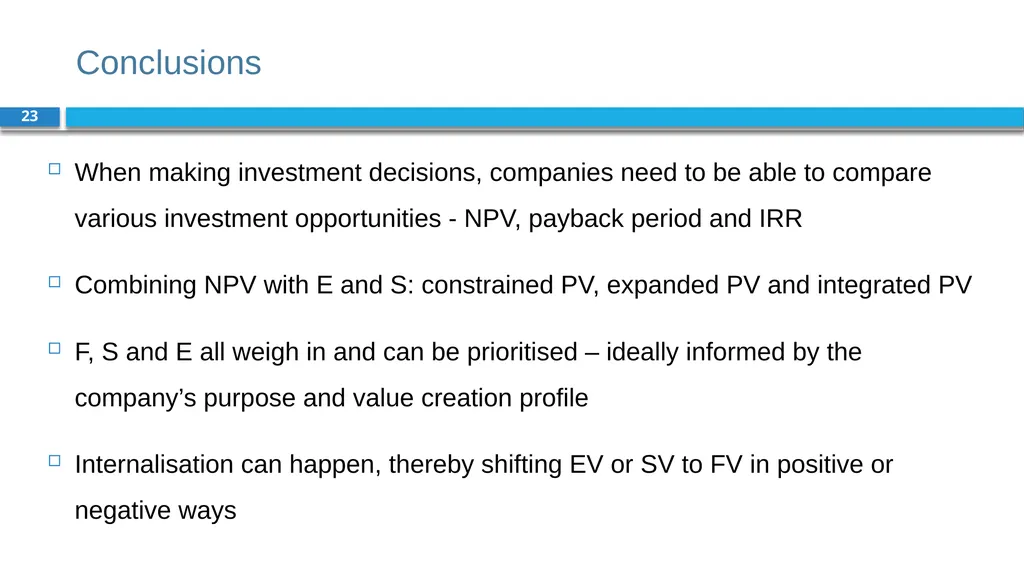
slide23. Conclusions 23 When making investment decisions, companies need to be able to compare various investment opportunities - NPV, payback period and IRR
Combining NPV with E and S: constrained PV, expanded PV and integrated PV
F, S and E all weigh in and can be prioritised – ideally informed by the company’s purpose and value creation profile
Internalisation can happen, thereby shifting EV or SV to FV in positive or negative ways<br>
slide2. Chapter 6: Investment decision rules Part 2: Discount rates and valuation methods<br>
slide3. The BIG Picture 3 How to select investment projects?
Traditional solution
Calculate the net present value (NPV) of projects -> based on FV
Do only projects with positive NPV
New solution
Include also SV and EV to obtain Integrated Present Value (IPV)
Analyse the interactions between F, S and E in projects -> internalisation<br>
slide4. Calculating financial value 4<br>
slide5. Calculating financial value 5 Comparing investment projects using NPV method NPV per euro invested:
21.7 / 100 = 21.7% NPV per euro invested:
11.65 / 50 = 23.3% If project Y can be duplicated, then Y > X Project Y Project X<br>
slide6. Payback rule 6 Payback rule: only do an investment if its cash flows pay back the initial investment within a pre-specified period
The payback period is the number of years needed to earn back the initial investment
Advantages: ease of use
Disadvantages:
Payback period is usually arbitrarily determined
Does not account for time value of money
Makes cash flows after cut-off point irrelevant (reinforcing short-termism)<br>
slide7. IRR rule 7 The internal rate of return (IRR) is the discount rate at which a project’s NPV equals zero
IRR Rule: do investment if IRR > opportunity cost of capital
Advantage: indicates safety
Disadvantage: not useful in comparing projects of different sizes Using trial and error or the IRR formula in Excel:
r = 0.163<br>
slide8. IRR rule 8 For project A, there are two points at which NPV = 0, so there’s no unique solution Problem when CF sign flips several times (like project A)<br>
slide9. NPV vs IRR and payback 9 Preference for NPV, since:
NPVs can be added up
It is a direct measure of value created for shareholders (the manager’s primary objective)<br>
slide10. Behavioural effects on investment decisions 10 People often behave irrationally in corporate investment decisions
Internal errors are misvaluations by corporate managers
Overconfidence: underestimating the risk of investments, resulting in a lower discount rate
Excessive optimism: overestimation of cash flows
Ways to spot internal errors: prematurely liquidating options, earnings missed and excessive press coverage
External errors are misvaluations by participants in financial markets
Behavioural biases, e.g., availability bias and confirmation bias<br>
slide11. Overconfidence and excessive optimism 11 Problem
Suppose three managers assess the same project. The table (right) gives their individual estimates of project risk and expected cash flows, as well as an unbiased assessment of project risk and CFs.
What is the unbiased project value?
How much do managers A, B and C think the project is worth?<br>
slide12. Overconfidence and excessive optimism 12 Overconfidence resulting in a lower risk assessment Excessive optimism resulting in a higher CF projection Both overconfidence and excessive optimism = highest overvaluation<br>
slide13. Integrated investment decision rules 13<br>
slide14. Constrained PV 14 S and/or E function as a budget constraint to the standard NPV on F
Project A contributes to becoming neutral but has a negative NPV, so fails on the constrained PV criterion
Project B and C have positive NPVs but do not contribute to becoming neutral, so also fail on the constrained PV criterion<br>
slide15. Constrained PV 15 Combining projects might lead to value creation
Combing both A with B and A with C contribute to becoming carbon neutral and have a positive NPV, so can both be accepted
A with C has a higher NPV compared to A with B, so A with C is preferred
Potential issues: netting pros and cons & including other E and S issues<br>
slide16. Expanded PV 16 Expresses S and E in monetary values to arrive at SV and EV and then shows these in addition to the standard NPV
Project A and C combined looks much better than any individual project, being strongly positive on all three value dimensions<br>
slide17. Integrated PV = IPV 17<br>
slide18. IPV 18<br>
slide19. IPV 19 Intermediate case: b = c = 0.5
Full case: b = c = 1
Which project to choose?
Intermediate case: choose project L
Full case: choose project M<br>
slide20. Internalisation 20 The three value dimensions (FV, SV and EV) are created jointly, and with similar drivers, and therefore interact and affect each other
Taking a dynamic perspective is very important: do not assume the current conditions will last forever, but acknowledge that they can change
Current loss-making entities may become profitable as their positive externalities get priced
Profitable entities with large negative externalities face the risk of those externalities being (partly) internalised<br>
slide21. Internalisation 21 Internalisation due to carbon tax, so FV absorbs 75% of EV With internalisation, project Y becomes more attractive<br>
slide22. Internalisation 22 The probability of internalisation estimates to what extent externalities are likely to be translated into FV effects, driven by transition processes Expected IPV of project Y under varying probabilities of internalisation<br>
slide23. Conclusions 23 When making investment decisions, companies need to be able to compare various investment opportunities - NPV, payback period and IRR
Combining NPV with E and S: constrained PV, expanded PV and integrated PV
F, S and E all weigh in and can be prioritised – ideally informed by the company’s purpose and value creation profile
Internalisation can happen, thereby shifting EV or SV to FV in positive or negative ways<br>