
Corrective Action Board Overview Updated: 26 April
OM
Published · 28 slides · 0 views
1 / 1


Description
Corrective Action Board Overview Updated: 26 April 2016 1 What is a Corrective Action Board? A Corrective Action Board or CAB is the forum to communicate, enable, facilitate, and provide oversight and direction for preventive and corrective
Related Topics
Share
Embed code
Download this presentation From Below
"Corrective Action Board Overview Updated: 26 April" is the property of its rightful owner. Permission is granted to download and print the materials on this website for personal, non-commercial use only, and to display it on your personal computer provided you do not modify the materials and that you retain all copyright notices contained in the materials. By downloading content from our website, you accept the terms of this agreement.
Presentation Transcript
01
Corrective Action Board
Overview Updated: 26 April 2016 1<br>
02
What is a Corrective Action Board? A Corrective Action Board or CAB is the forum to communicate, enable, facilitate, and provide oversight and direction for preventive and corrective action activities in order to resolve issues, support improved service and/or product quality, and promote Customer satisfaction. 2<br>
03
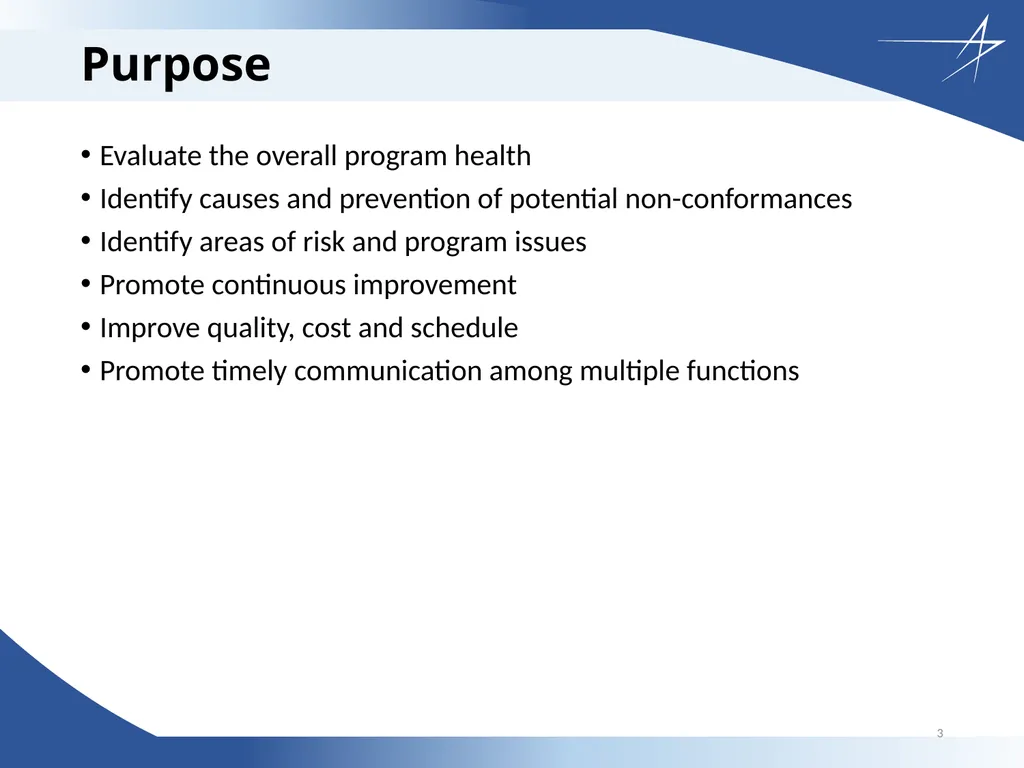
Purpose Evaluate the overall program health
Identify causes and prevention of potential non-conformances
Identify areas of risk and program issues
Promote continuous improvement
Improve quality, cost and schedule
Promote timely communication among multiple functions 3<br>
Identify causes and prevention of potential non-conformances
Identify areas of risk and program issues
Promote continuous improvement
Improve quality, cost and schedule
Promote timely communication among multiple functions 3<br>
04
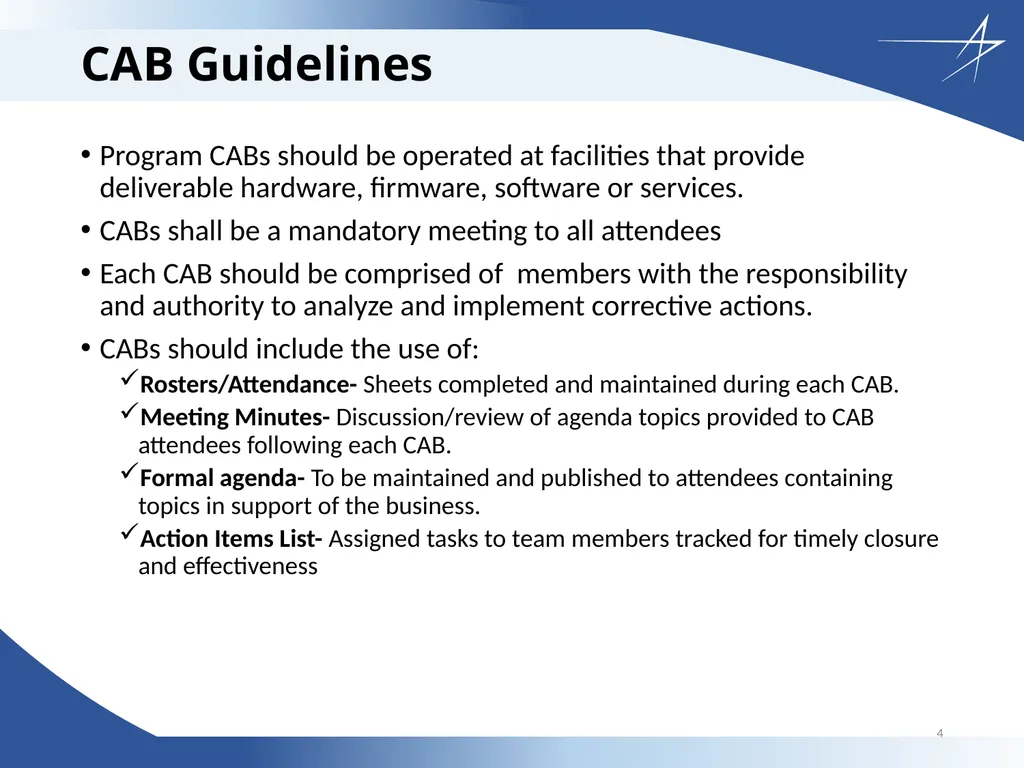
CAB Guidelines Program CABs should be operated at facilities that provide deliverable hardware, firmware, software or services.
CABs shall be a mandatory meeting to all attendees
Each CAB should be comprised of members with the responsibility and authority to analyze and implement corrective actions.
CABs should include the use of:
Rosters/Attendance- Sheets completed and maintained during each CAB.
Meeting Minutes- Discussion/review of agenda topics provided to CAB attendees following each CAB.
Formal agenda- To be maintained and published to attendees containing topics in support of the business.
Action Items List- Assigned tasks to team members tracked for timely closure and effectiveness 4<br>
CABs shall be a mandatory meeting to all attendees
Each CAB should be comprised of members with the responsibility and authority to analyze and implement corrective actions.
CABs should include the use of:
Rosters/Attendance- Sheets completed and maintained during each CAB.
Meeting Minutes- Discussion/review of agenda topics provided to CAB attendees following each CAB.
Formal agenda- To be maintained and published to attendees containing topics in support of the business.
Action Items List- Assigned tasks to team members tracked for timely closure and effectiveness 4<br>
05
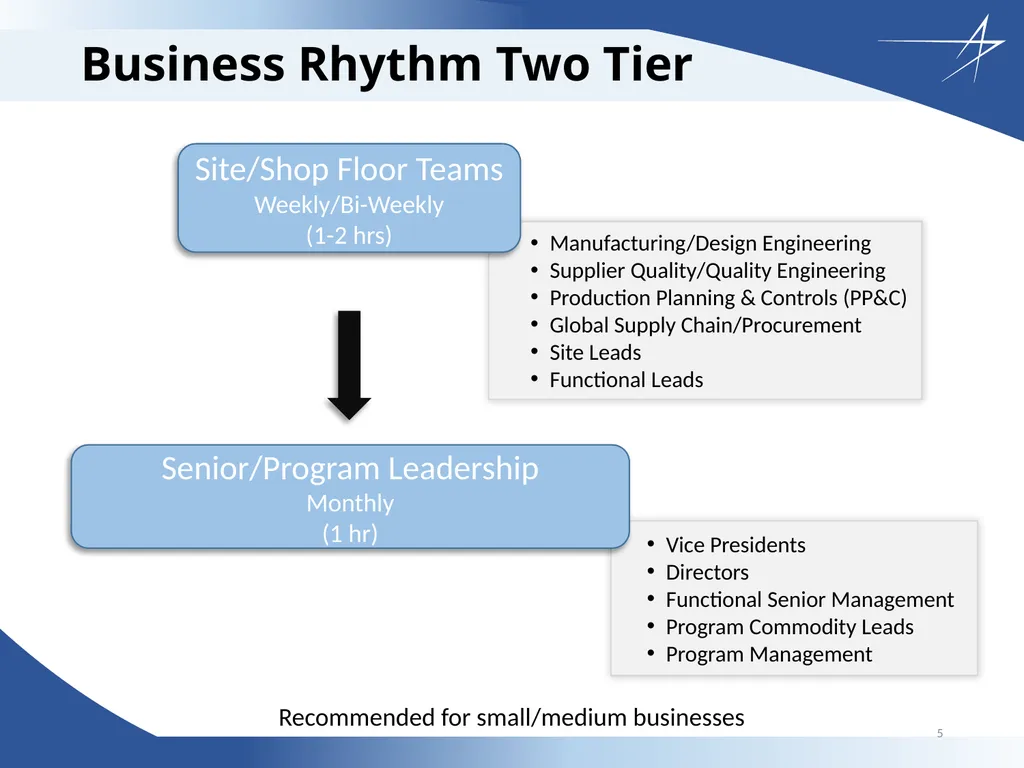
Business Rhythm Two Tier Vice Presidents
Directors
Functional Senior Management
Program Commodity Leads
Program Management Manufacturing/Design Engineering
Supplier Quality/Quality Engineering
Production Planning & Controls (PP&C)
Global Supply Chain/Procurement
Site Leads
Functional Leads Senior/Program Leadership
Monthly
(1 hr) Site/Shop Floor Teams
Weekly/Bi-Weekly
(1-2 hrs) Recommended for small/medium businesses 5<br>
Directors
Functional Senior Management
Program Commodity Leads
Program Management Manufacturing/Design Engineering
Supplier Quality/Quality Engineering
Production Planning & Controls (PP&C)
Global Supply Chain/Procurement
Site Leads
Functional Leads Senior/Program Leadership
Monthly
(1 hr) Site/Shop Floor Teams
Weekly/Bi-Weekly
(1-2 hrs) Recommended for small/medium businesses 5<br>
06
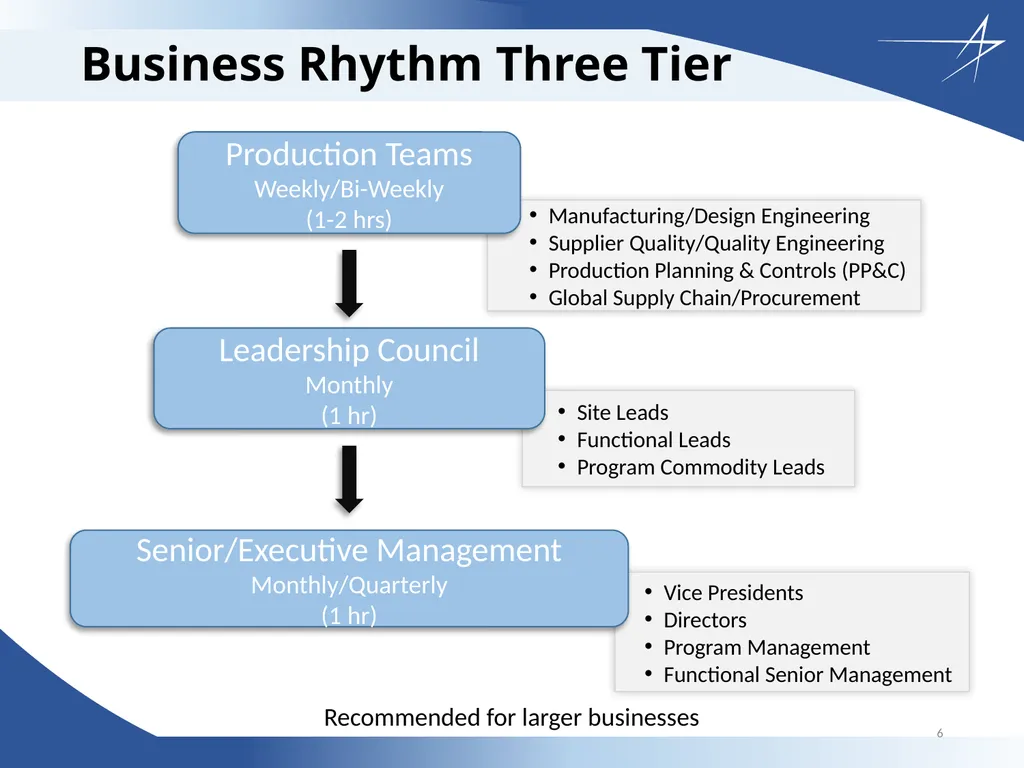
Business Rhythm Three Tier Vice Presidents
Directors
Program Management
Functional Senior Management Site Leads
Functional Leads
Program Commodity Leads Manufacturing/Design Engineering
Supplier Quality/Quality Engineering
Production Planning & Controls (PP&C)
Global Supply Chain/Procurement Leadership Council
Monthly
(1 hr) Senior/Executive Management
Monthly/Quarterly
(1 hr) Production Teams
Weekly/Bi-Weekly
(1-2 hrs) Recommended for larger businesses 6<br>
Directors
Program Management
Functional Senior Management Site Leads
Functional Leads
Program Commodity Leads Manufacturing/Design Engineering
Supplier Quality/Quality Engineering
Production Planning & Controls (PP&C)
Global Supply Chain/Procurement Leadership Council
Monthly
(1 hr) Senior/Executive Management
Monthly/Quarterly
(1 hr) Production Teams
Weekly/Bi-Weekly
(1-2 hrs) Recommended for larger businesses 6<br>
07
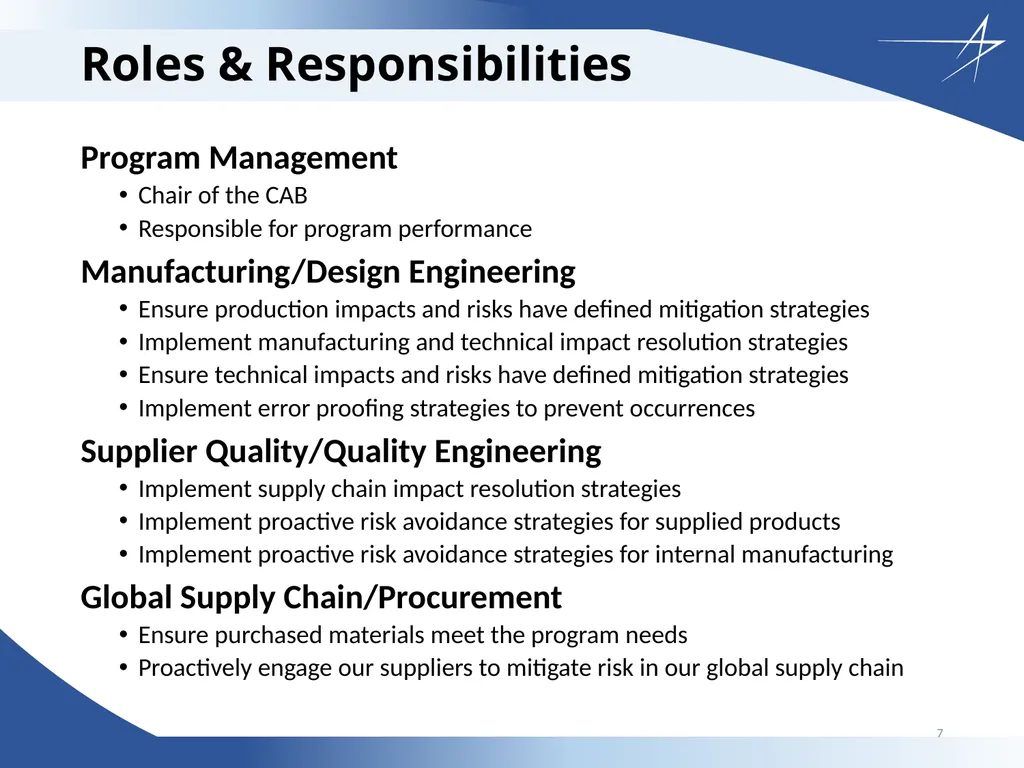
Roles & Responsibilities Program Management
Chair of the CAB
Responsible for program performance
Manufacturing/Design Engineering
Ensure production impacts and risks have defined mitigation strategies
Implement manufacturing and technical impact resolution strategies
Ensure technical impacts and risks have defined mitigation strategies
Implement error proofing strategies to prevent occurrences
Supplier Quality/Quality Engineering
Implement supply chain impact resolution strategies
Implement proactive risk avoidance strategies for supplied products
Implement proactive risk avoidance strategies for internal manufacturing
Global Supply Chain/Procurement
Ensure purchased materials meet the program needs
Proactively engage our suppliers to mitigate risk in our global supply chain 7<br>
Chair of the CAB
Responsible for program performance
Manufacturing/Design Engineering
Ensure production impacts and risks have defined mitigation strategies
Implement manufacturing and technical impact resolution strategies
Ensure technical impacts and risks have defined mitigation strategies
Implement error proofing strategies to prevent occurrences
Supplier Quality/Quality Engineering
Implement supply chain impact resolution strategies
Implement proactive risk avoidance strategies for supplied products
Implement proactive risk avoidance strategies for internal manufacturing
Global Supply Chain/Procurement
Ensure purchased materials meet the program needs
Proactively engage our suppliers to mitigate risk in our global supply chain 7<br>
08
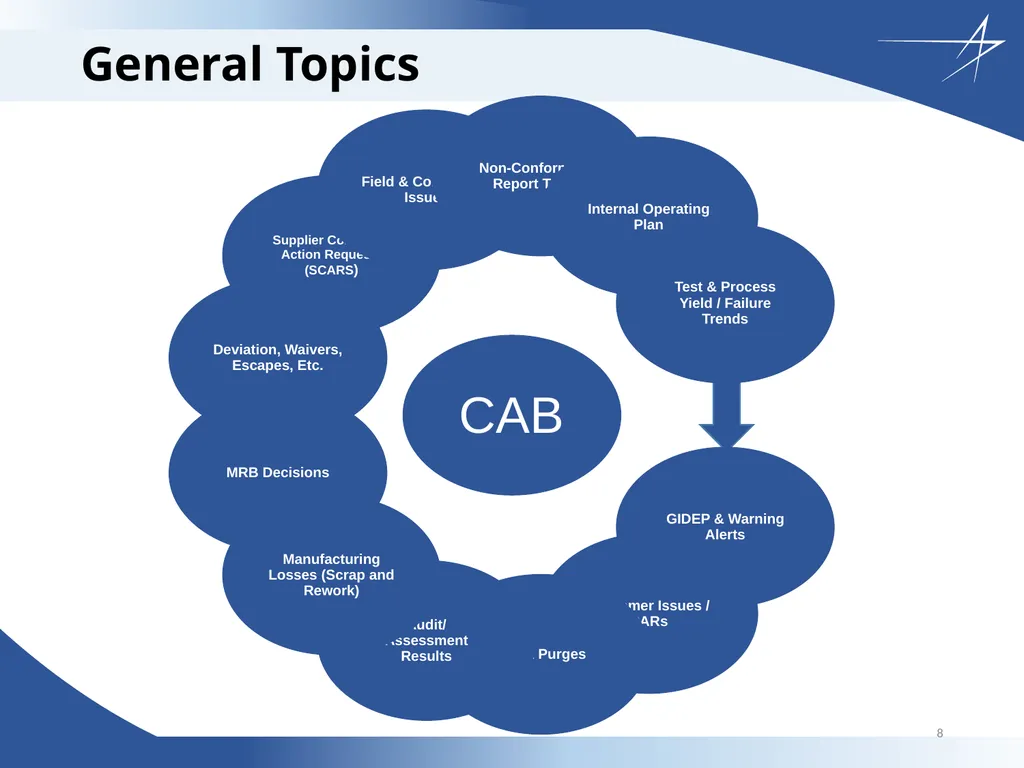
General Topics 8<br>
09
Suggested Agenda Items By CAB Level 9<br>
10
Suggested Agenda Items By CAB Level 10<br>
11
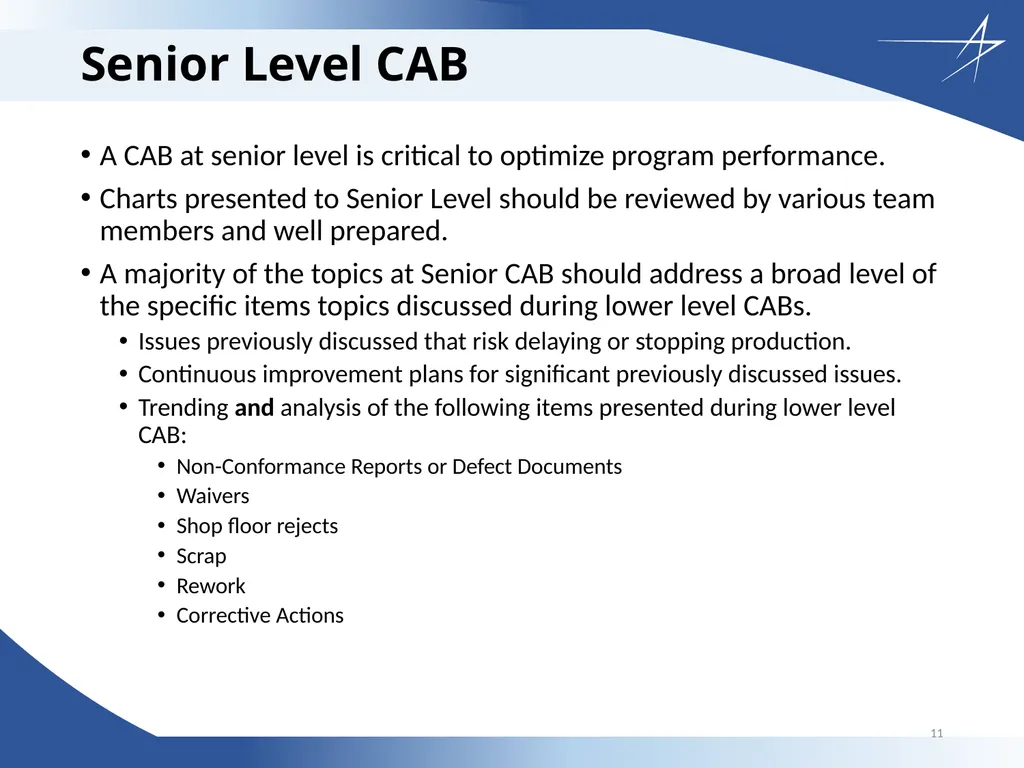
Senior Level CAB A CAB at senior level is critical to optimize program performance.
Charts presented to Senior Level should be reviewed by various team members and well prepared.
A majority of the topics at Senior CAB should address a broad level of the specific items topics discussed during lower level CABs.
Issues previously discussed that risk delaying or stopping production.
Continuous improvement plans for significant previously discussed issues.
Trending and analysis of the following items presented during lower level CAB:
Non-Conformance Reports or Defect Documents
Waivers
Shop floor rejects
Scrap
Rework
Corrective Actions 11<br>
Charts presented to Senior Level should be reviewed by various team members and well prepared.
A majority of the topics at Senior CAB should address a broad level of the specific items topics discussed during lower level CABs.
Issues previously discussed that risk delaying or stopping production.
Continuous improvement plans for significant previously discussed issues.
Trending and analysis of the following items presented during lower level CAB:
Non-Conformance Reports or Defect Documents
Waivers
Shop floor rejects
Scrap
Rework
Corrective Actions 11<br>
12
Examples of Charts for CAB 12<br>
13
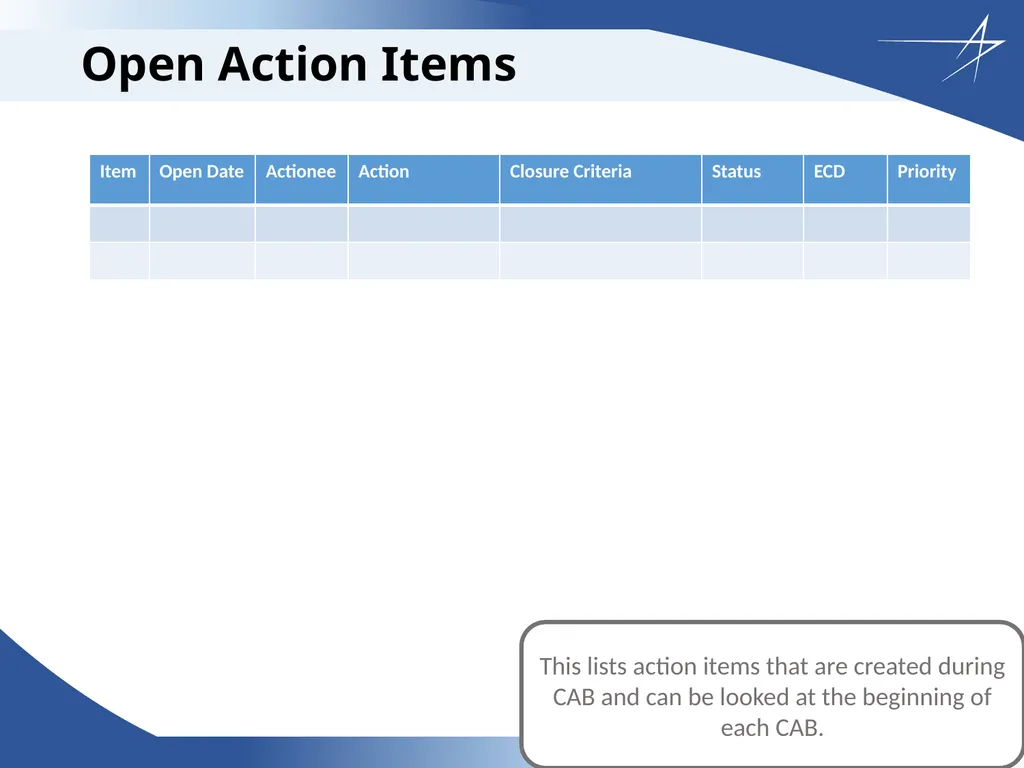
Open Action Items This lists action items that are created during CAB and can be looked at the beginning of each CAB. 13<br>
14
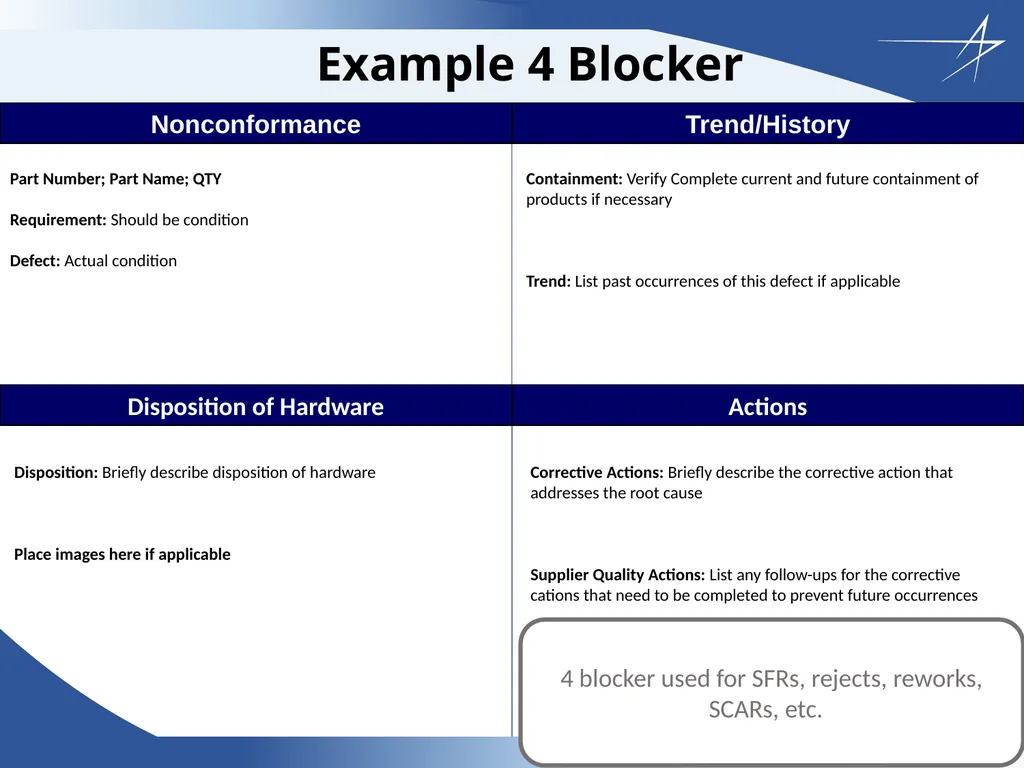
Nonconformance Example 4 Blocker Trend/History Disposition of Hardware Actions Part Number; Part Name; QTY
Requirement: Should be condition
Defect: Actual condition Containment: Verify Complete current and future containment of products if necessary
Trend: List past occurrences of this defect if applicable Disposition: Briefly describe disposition of hardware
Place images here if applicable Corrective Actions: Briefly describe the corrective action that addresses the root cause
Supplier Quality Actions: List any follow-ups for the corrective cations that need to be completed to prevent future occurrences 4 blocker used for SFRs, rejects, reworks, SCARs, etc. 14<br>
Requirement: Should be condition
Defect: Actual condition Containment: Verify Complete current and future containment of products if necessary
Trend: List past occurrences of this defect if applicable Disposition: Briefly describe disposition of hardware
Place images here if applicable Corrective Actions: Briefly describe the corrective action that addresses the root cause
Supplier Quality Actions: List any follow-ups for the corrective cations that need to be completed to prevent future occurrences 4 blocker used for SFRs, rejects, reworks, SCARs, etc. 14<br>
15
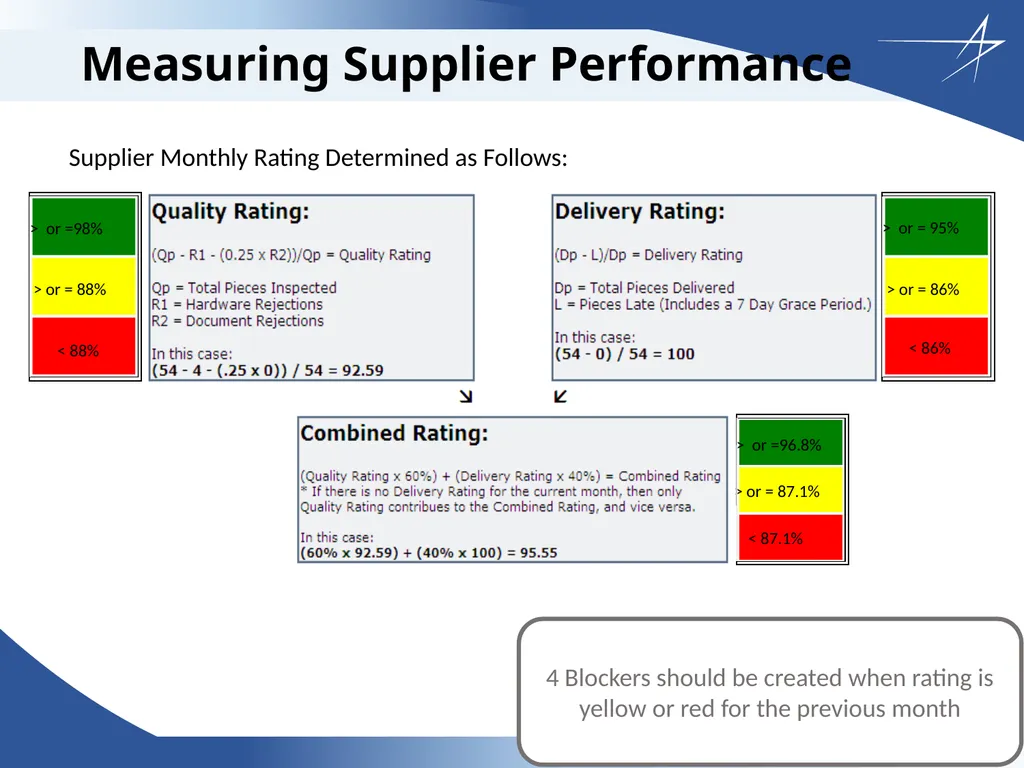
Measuring Supplier Performance Supplier Monthly Rating Determined as Follows: 4 Blockers should be created when rating is yellow or red for the previous month 15<br>
16
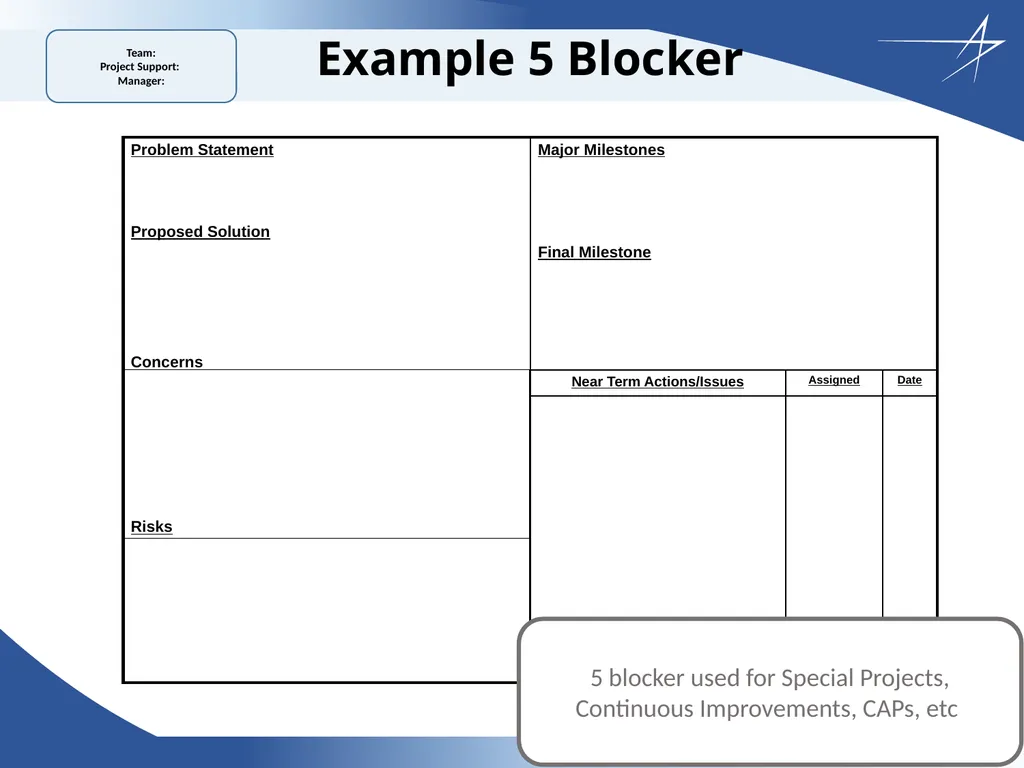
Team:
Project Support:
Manager: Example 5 Blocker 5 blocker used for Special Projects, Continuous Improvements, CAPs, etc. 16<br>
Project Support:
Manager: Example 5 Blocker 5 blocker used for Special Projects, Continuous Improvements, CAPs, etc. 16<br>
17
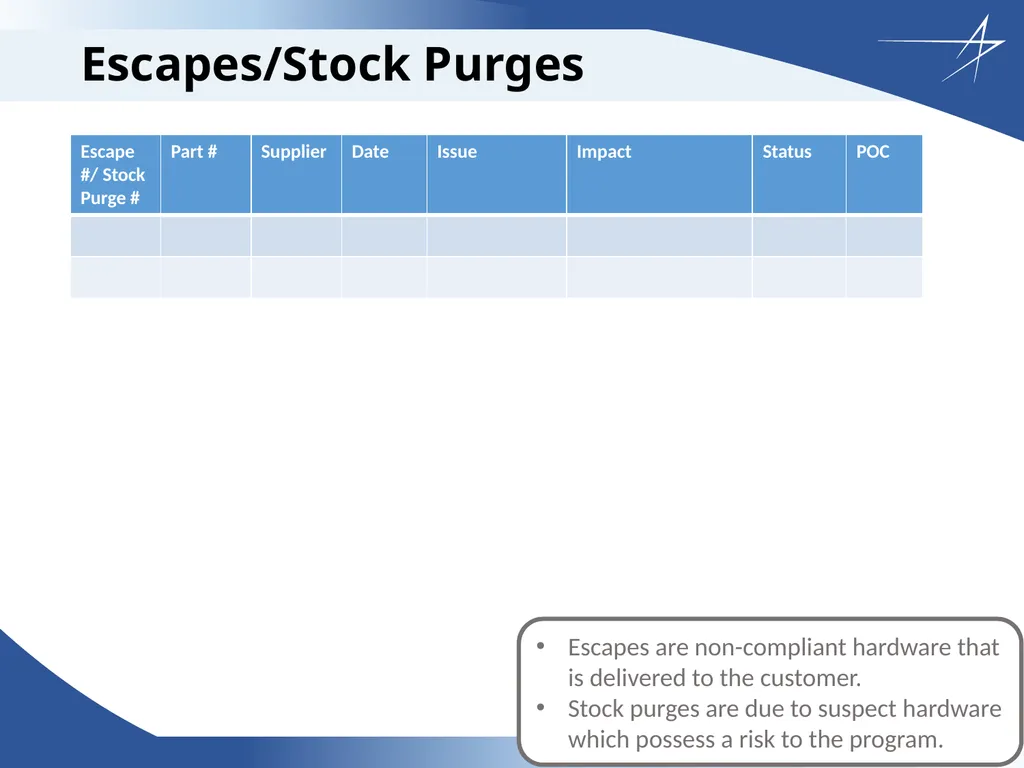
Escapes/Stock Purges Escapes are non-compliant hardware that is delivered to the customer.
Stock purges are due to suspect hardware which possess a risk to the program. 17<br>
Stock purges are due to suspect hardware which possess a risk to the program. 17<br>
18
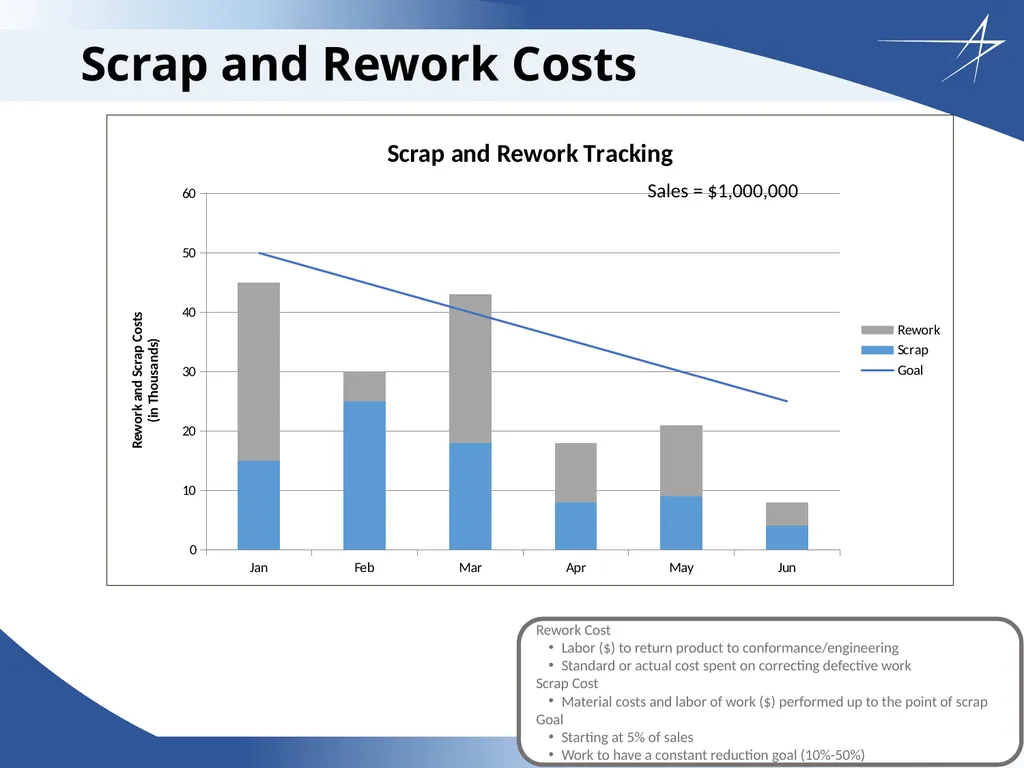
Scrap and Rework Costs Sales = $1,000,000 Rework Cost
Labor ($) to return product to conformance/engineering
Standard or actual cost spent on correcting defective work
Scrap Cost
Material costs and labor of work ($) performed up to the point of scrap
Goal
Starting at 5% of sales
Work to have a constant reduction goal (10%-50%) 18<br>
Labor ($) to return product to conformance/engineering
Standard or actual cost spent on correcting defective work
Scrap Cost
Material costs and labor of work ($) performed up to the point of scrap
Goal
Starting at 5% of sales
Work to have a constant reduction goal (10%-50%) 18<br>
19
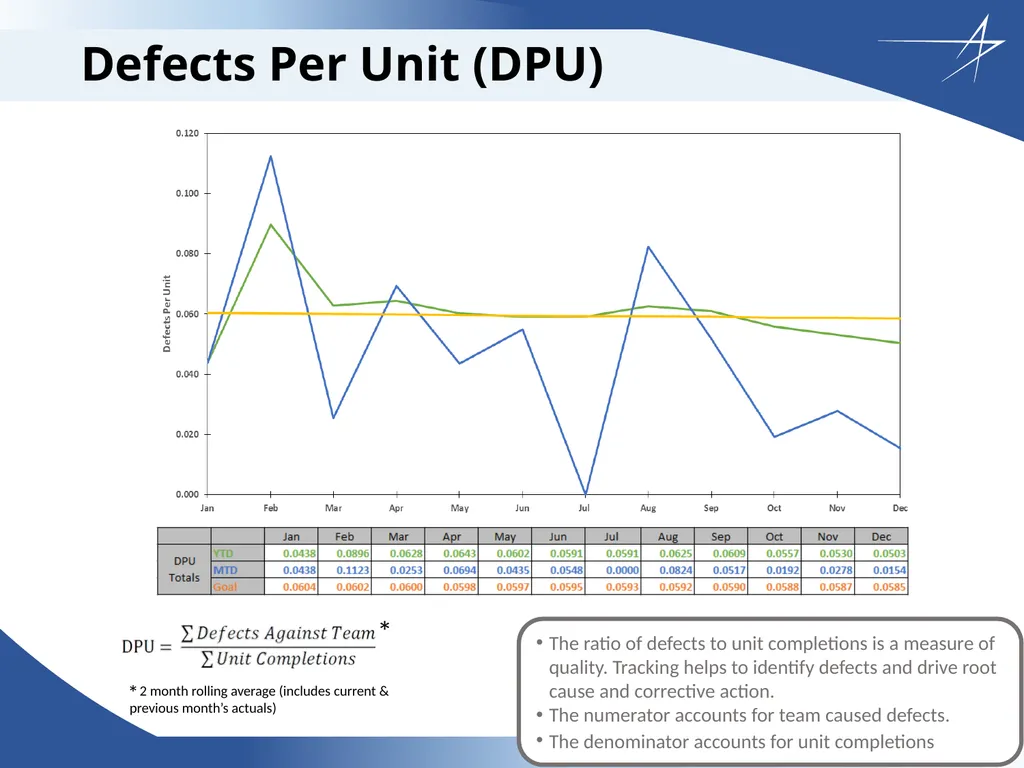
Defects Per Unit (DPU) * * 2 month rolling average (includes current & previous month’s actuals) The ratio of defects to unit completions is a measure of quality. Tracking helps to identify defects and drive root cause and corrective action.
The numerator accounts for team caused defects.
The denominator accounts for unit completions. 19<br>
The numerator accounts for team caused defects.
The denominator accounts for unit completions. 19<br>
20
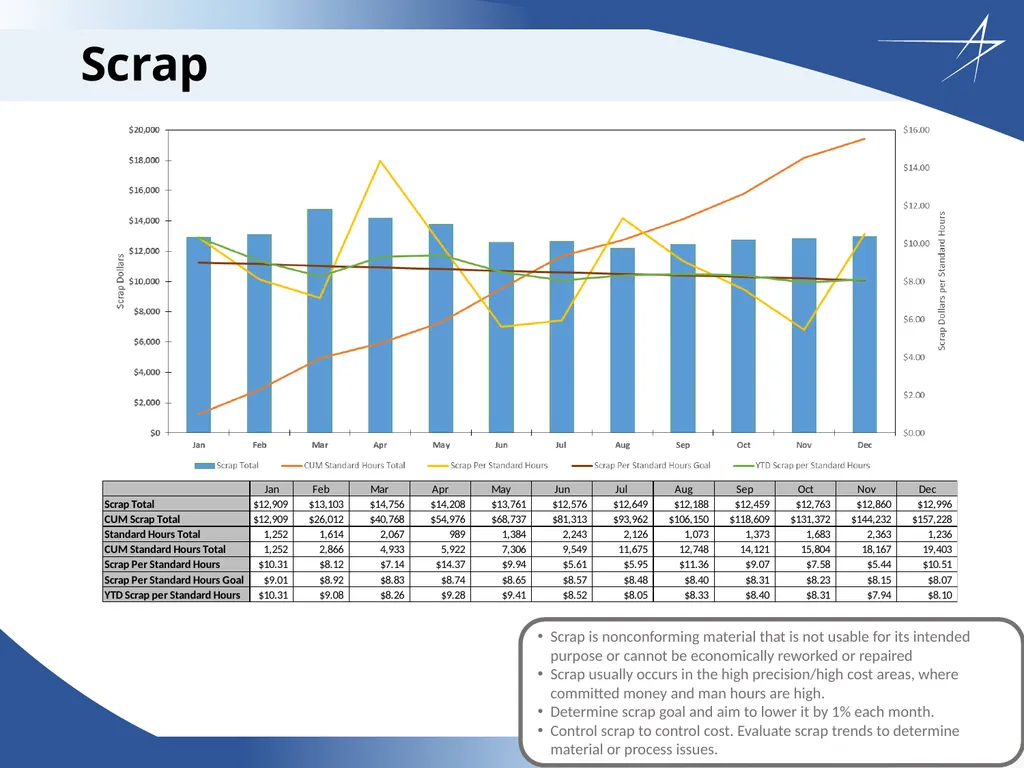
Scrap Scrap is nonconforming material that is not usable for its intended purpose or cannot be economically reworked or repaired
Scrap usually occurs in the high precision/high cost areas, where committed money and man hours are high.
Determine scrap goal and aim to lower it by 1% each month.
Control scrap to control cost. Evaluate scrap trends to determine material or process issues. 20<br>
Scrap usually occurs in the high precision/high cost areas, where committed money and man hours are high.
Determine scrap goal and aim to lower it by 1% each month.
Control scrap to control cost. Evaluate scrap trends to determine material or process issues. 20<br>
21
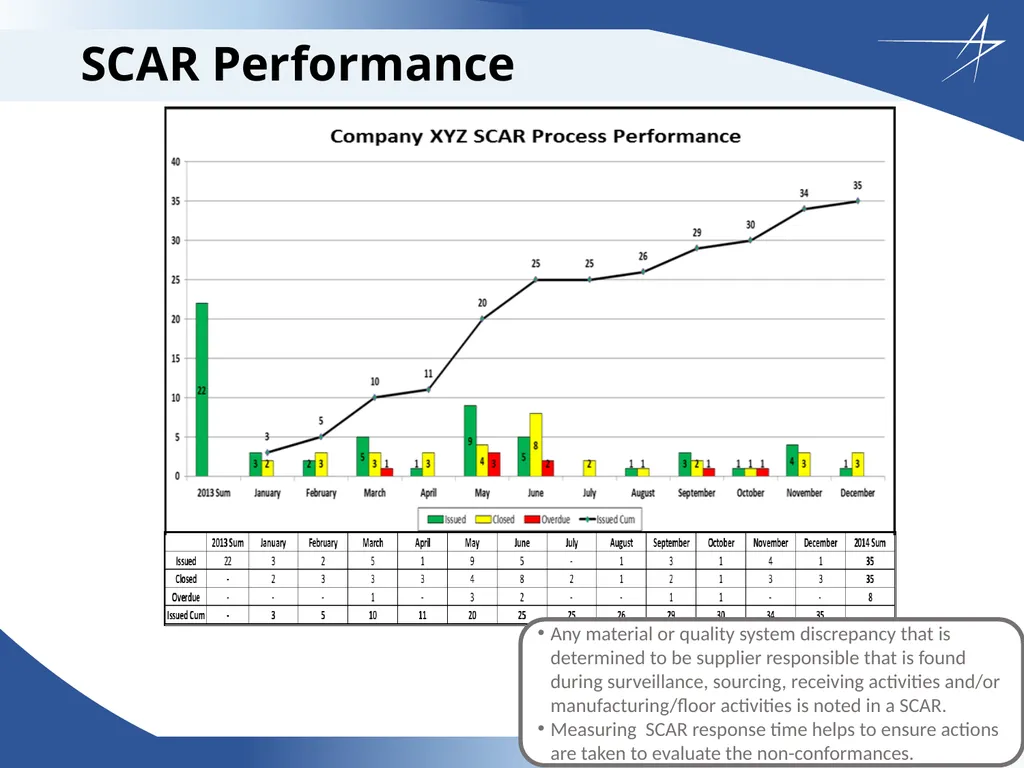
SCAR Performance Any material or quality system discrepancy that is determined to be supplier responsible that is found during surveillance, sourcing, receiving activities and/or manufacturing/floor activities is noted in a SCAR.
Measuring SCAR response time helps to ensure actions are taken to evaluate the non-conformances. 21<br>
Measuring SCAR response time helps to ensure actions are taken to evaluate the non-conformances. 21<br>
22
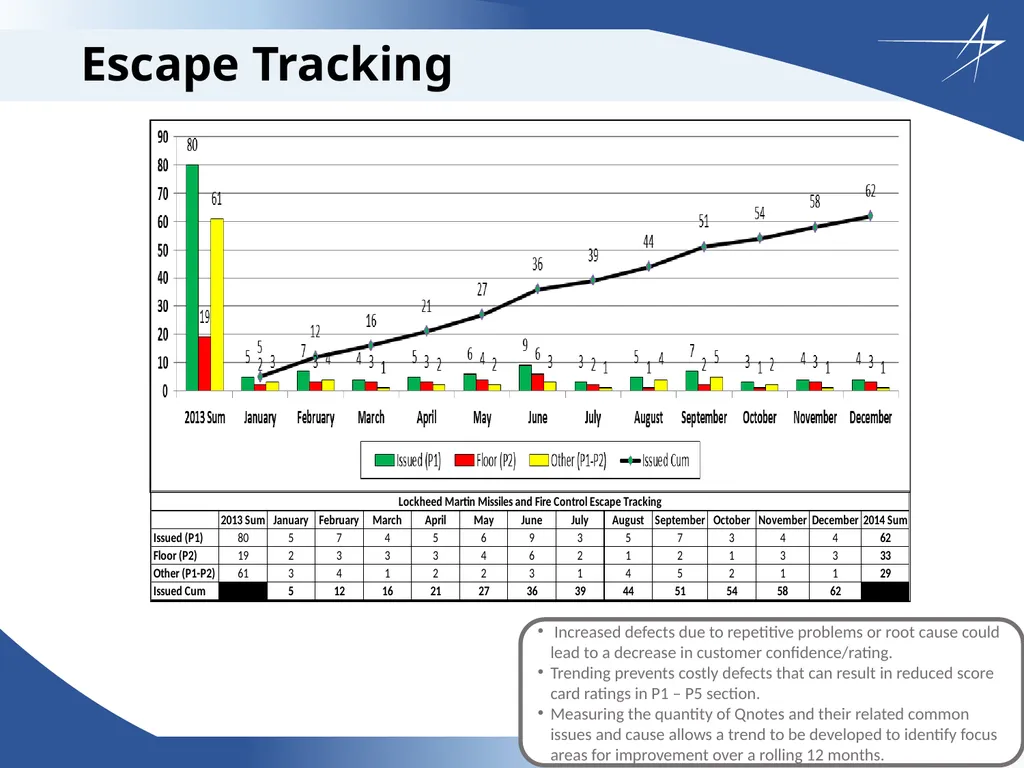
Escape Tracking Increased defects due to repetitive problems or root cause could lead to a decrease in customer confidence/rating.
Trending prevents costly defects that can result in reduced score card ratings in P1 – P5 section.
Measuring the quantity of Qnotes and their related common issues and cause allows a trend to be developed to identify focus areas for improvement over a rolling 12 months. 22<br>
Trending prevents costly defects that can result in reduced score card ratings in P1 – P5 section.
Measuring the quantity of Qnotes and their related common issues and cause allows a trend to be developed to identify focus areas for improvement over a rolling 12 months. 22<br>
23
Additional Slides The following slides are useful for root cause/corrective action analysis for significant issues. These are not presented during CAB, however, issues that require analysis are often related to various other topics that are discussed (i.e. trending, stock purges, open quality notes, etc.). 23<br>
24
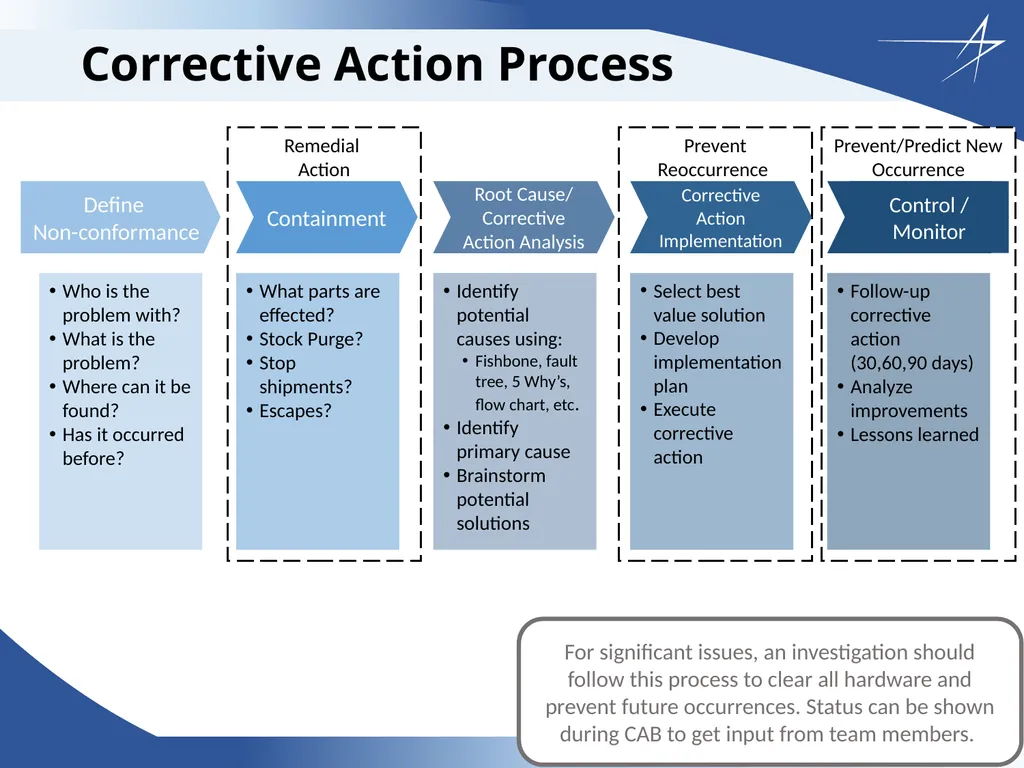
Prevent/Predict New Occurrence Prevent Reoccurrence Remedial
Action Corrective Action Process For significant issues, an investigation should follow this process to clear all hardware and prevent future occurrences. Status can be shown during CAB to get input from team members. 24<br>
Action Corrective Action Process For significant issues, an investigation should follow this process to clear all hardware and prevent future occurrences. Status can be shown during CAB to get input from team members. 24<br>
25
Fishbone Analysis Method Potential
Contributor Color Key
Conclusive Refuting Evidence Exists
No Evidence to Support Cause of Issue
Potential Issue Contributor/Cause
Evidence to support Issue Cause
In-progress test/analysis Problem Potential
Contributor
(major category) Potential
Contributor
(major category) Potential
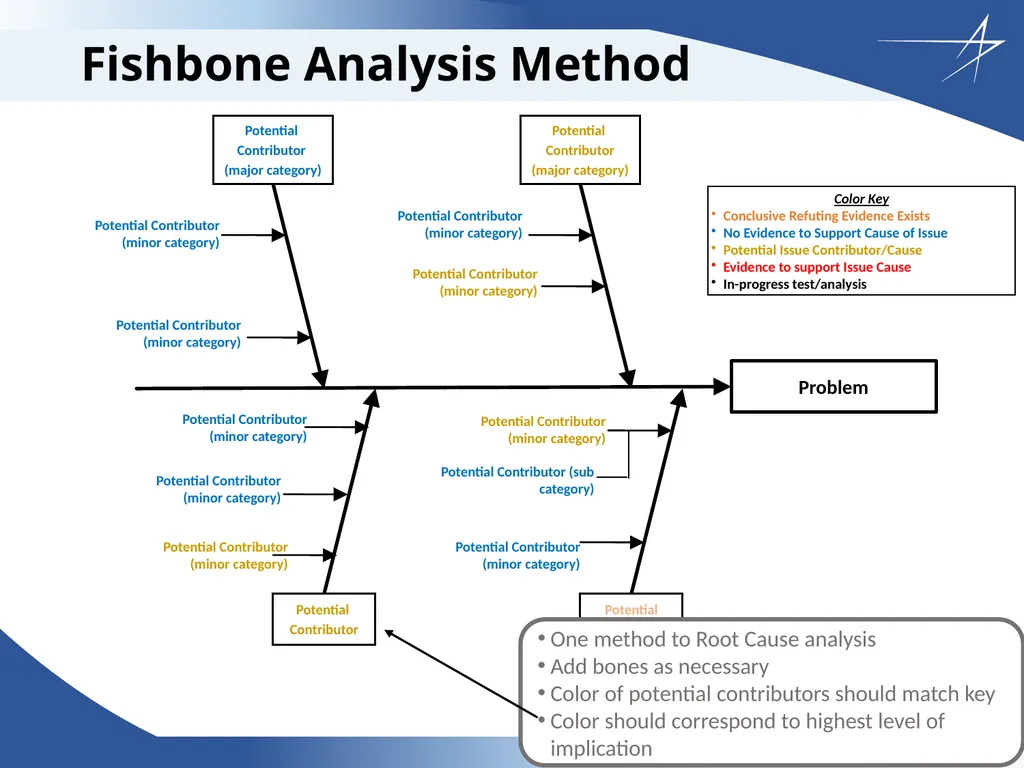
Contributor Potential Contributor (minor category) Potential Contributor (minor category) Potential Contributor (minor category) Potential Contributor (minor category) Potential Contributor (minor category) Potential Contributor (sub category) Potential Contributor (minor category) Potential Contributor (minor category) Potential Contributor (minor category) Potential Contributor (minor category) One method to Root Cause analysis
Add bones as necessary
Color of potential contributors should match key
Color should correspond to highest level of implication 25<br>
Contributor Color Key
Conclusive Refuting Evidence Exists
No Evidence to Support Cause of Issue
Potential Issue Contributor/Cause
Evidence to support Issue Cause
In-progress test/analysis Problem Potential
Contributor
(major category) Potential
Contributor
(major category) Potential
Contributor Potential Contributor (minor category) Potential Contributor (minor category) Potential Contributor (minor category) Potential Contributor (minor category) Potential Contributor (minor category) Potential Contributor (sub category) Potential Contributor (minor category) Potential Contributor (minor category) Potential Contributor (minor category) Potential Contributor (minor category) One method to Root Cause analysis
Add bones as necessary
Color of potential contributors should match key
Color should correspond to highest level of implication 25<br>
26
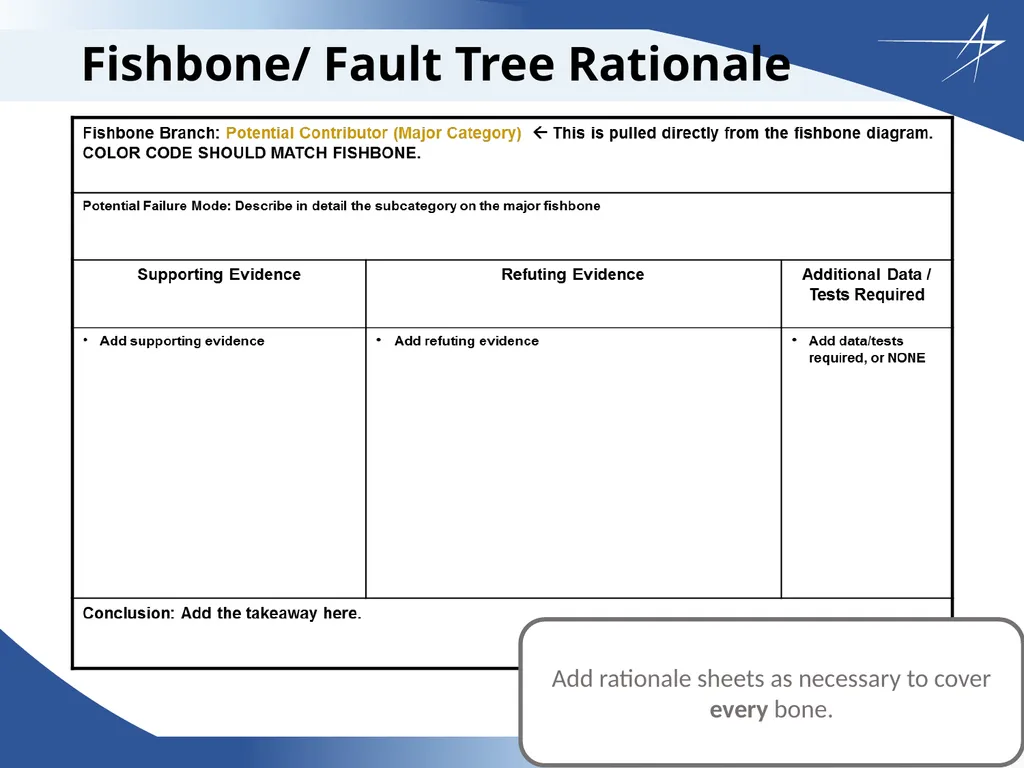
Fishbone/ Fault Tree Rationale Add rationale sheets as necessary to cover every bone. 26<br>
27
5-Why’s Method 1.Why?
Too much washing
2. Why?
Excess bird droppings
3. Why?
A lot of spiders to eat
4. Why?
A lot of gnats to eat
5. Why?
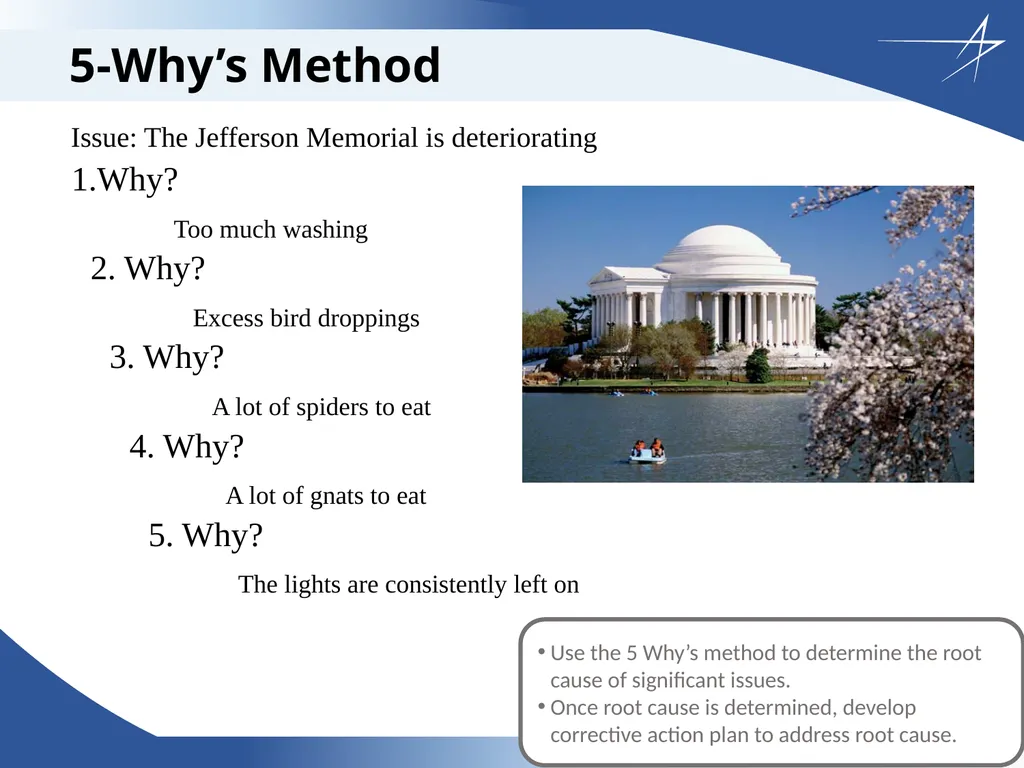
The lights are consistently left on Issue: The Jefferson Memorial is deteriorating Use the 5 Why’s method to determine the root cause of significant issues.
Once root cause is determined, develop corrective action plan to address root cause. 27<br>
Too much washing
2. Why?
Excess bird droppings
3. Why?
A lot of spiders to eat
4. Why?
A lot of gnats to eat
5. Why?
The lights are consistently left on Issue: The Jefferson Memorial is deteriorating Use the 5 Why’s method to determine the root cause of significant issues.
Once root cause is determined, develop corrective action plan to address root cause. 27<br>
28
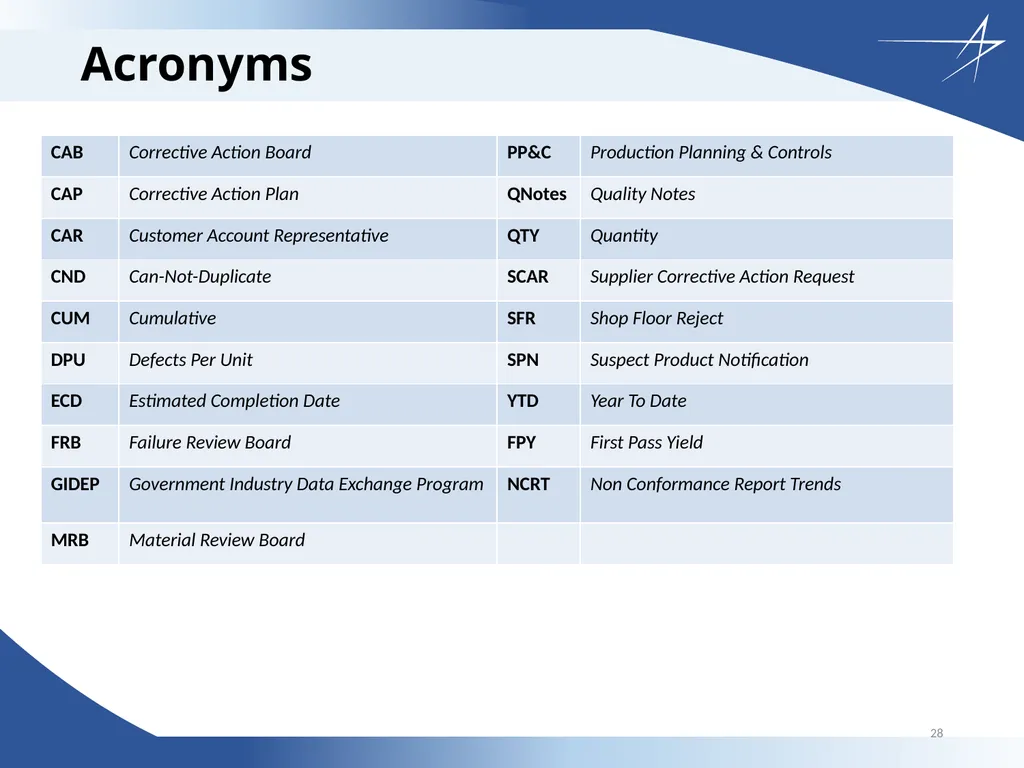
Acronyms 28<br>