04
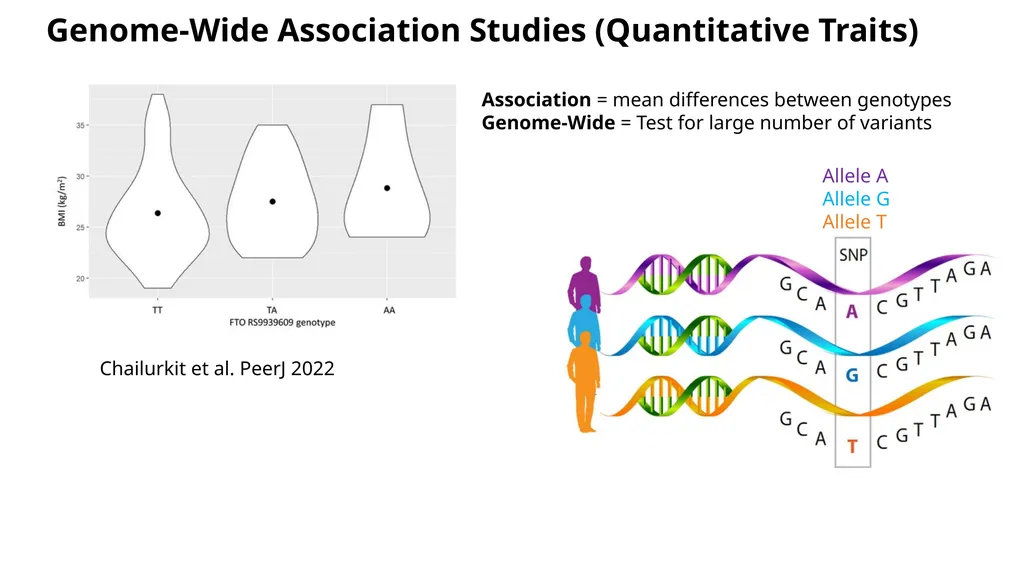
Chailurkit et al. PeerJ 2022 Association = mean differences between genotypes
Genome-Wide = Test for large number of variants Genome-Wide Association Studies (Quantitative Traits) Allele A
Allele G
Allele T<br>
05
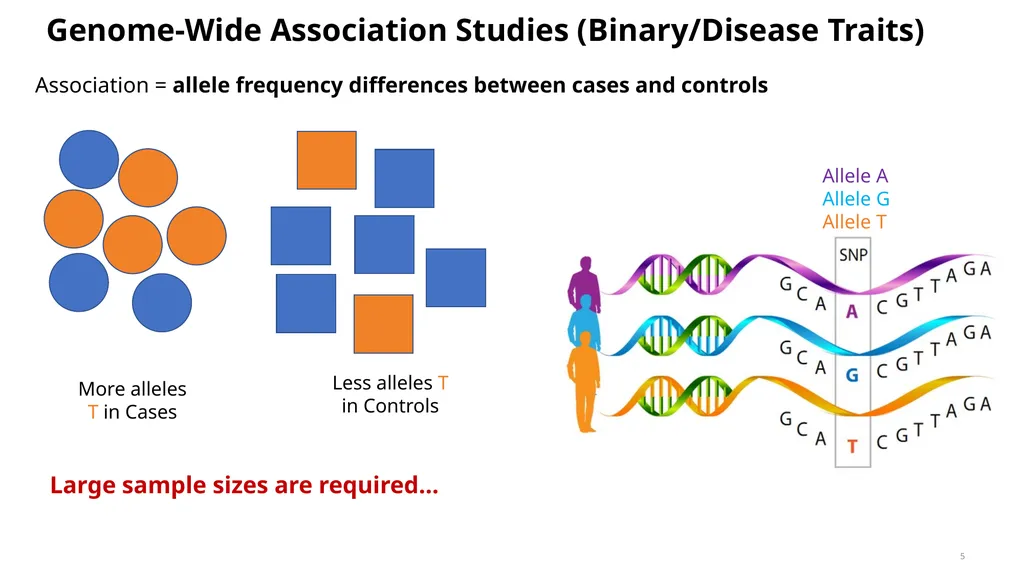
5 Allele A
Allele G
Allele T Association = allele frequency differences between cases and controls Large sample sizes are required… Genome-Wide Association Studies (Binary/Disease Traits)<br>
06
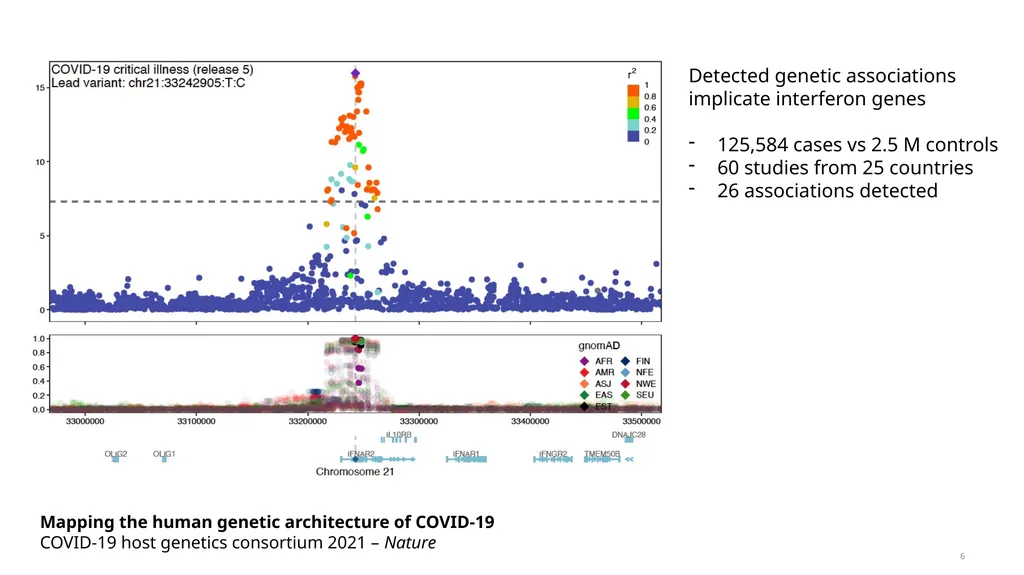
6 Manhattan plot Mapping the human genetic architecture of COVID-19
COVID-19 host genetics consortium 2021 – Nature Detected genetic associations implicate interferon genes
125,584 cases vs 2.5 M controls
60 studies from 25 countries
26 associations detected<br>
07
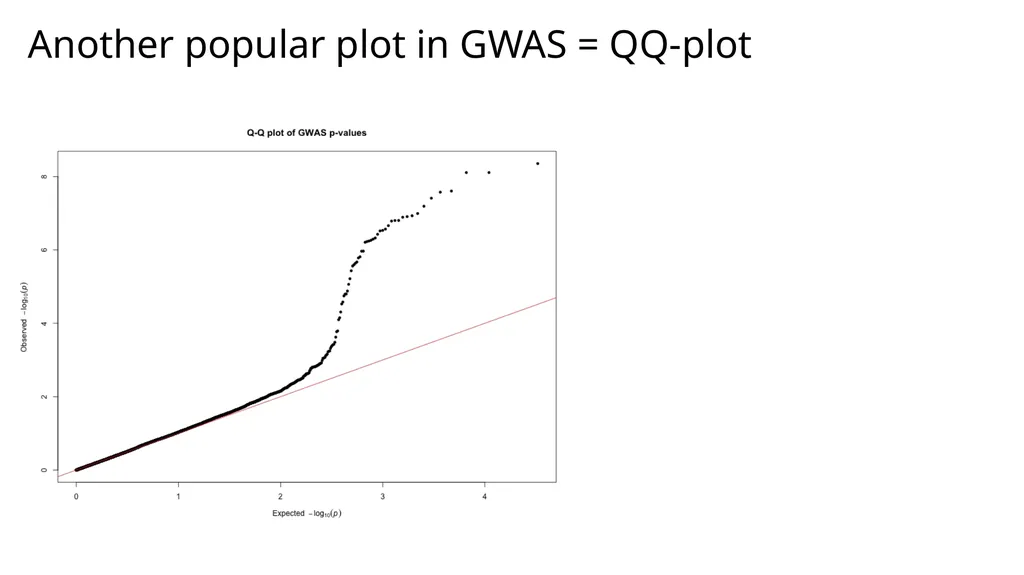
Another popular plot in GWAS = QQ-plot<br>
08
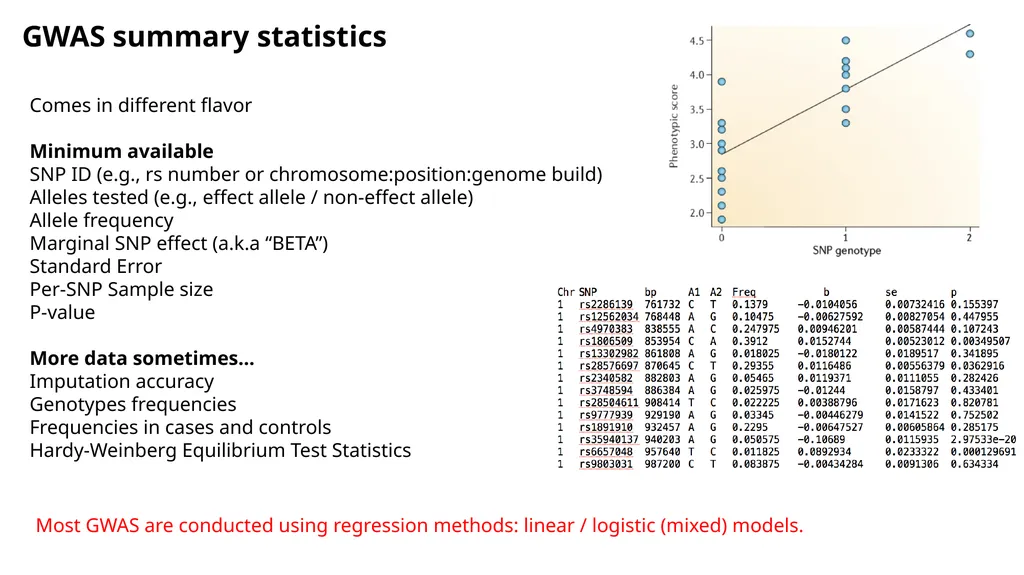
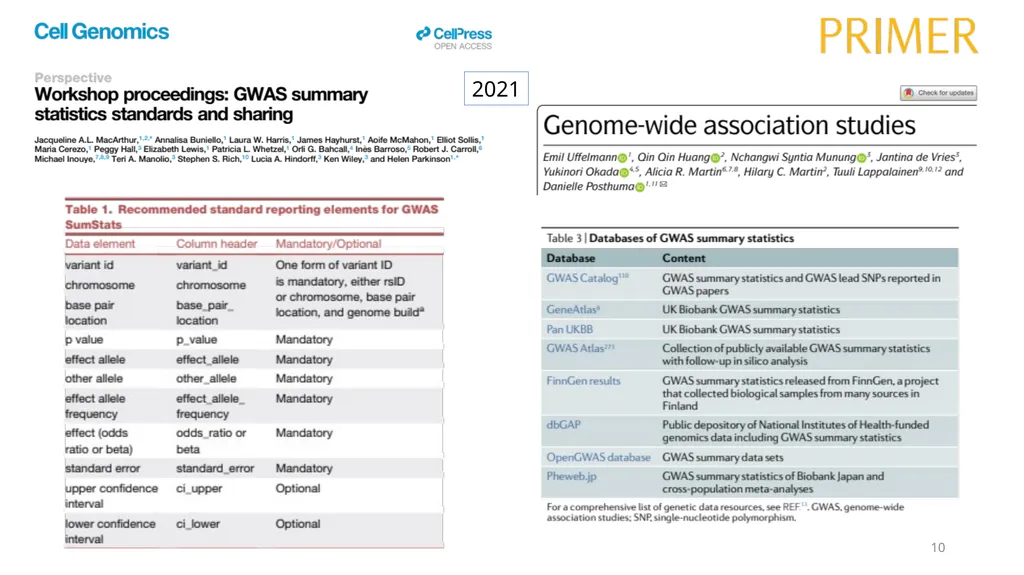
GWAS summary statistics Comes in different flavor
Minimum available
SNP ID (e.g., rs number or chromosome:position:genome build)
Alleles tested (e.g., effect allele / non-effect allele)
Allele frequency
Marginal SNP effect (a.k.a “BETA”)
Standard Error
Per-SNP Sample size
P-value
More data sometimes…
Imputation accuracy
Genotypes frequencies
Frequencies in cases and controls
Hardy-Weinberg Equilibrium Test Statistics Most GWAS are conducted using regression methods: linear / logistic (mixed) models.<br>
09
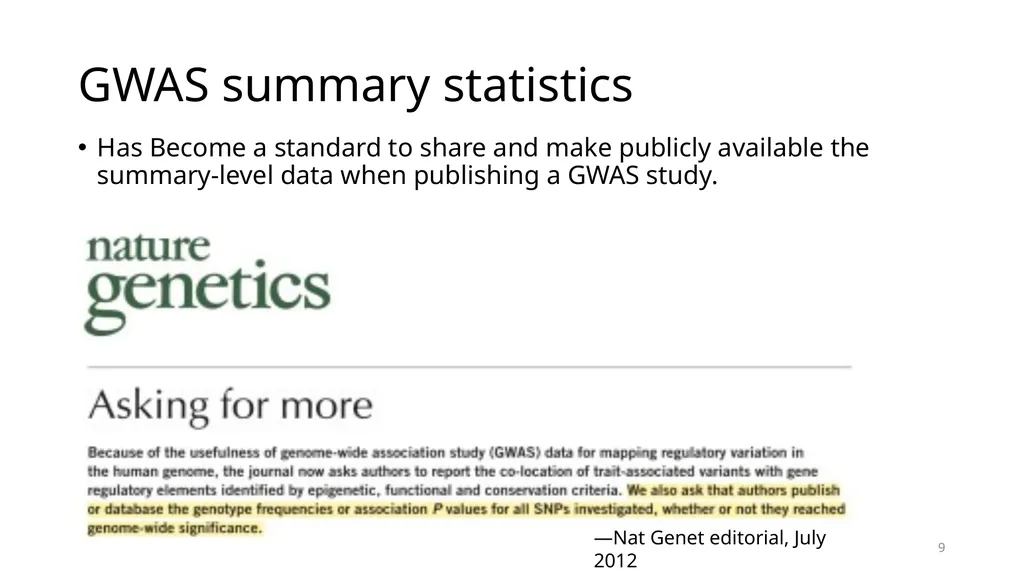
GWAS summary statistics Has Become a standard to share and make publicly available the summary-level data when publishing a GWAS study. 9<br>
11
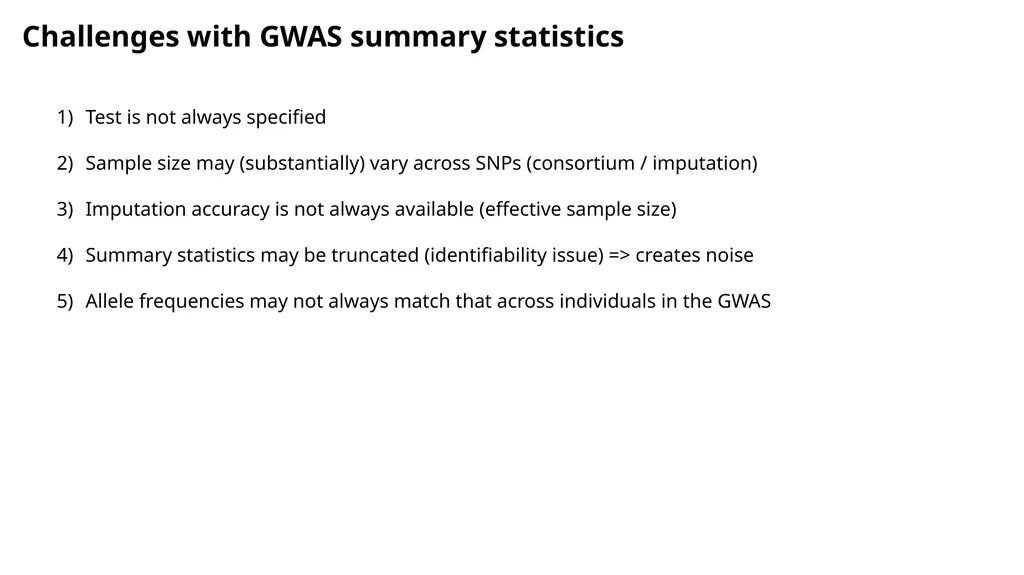
Challenges with GWAS summary statistics Test is not always specified
Sample size may (substantially) vary across SNPs (consortium / imputation)
Imputation accuracy is not always available (effective sample size)
Summary statistics may be truncated (identifiability issue) => creates noise
Allele frequencies may not always match that across individuals in the GWAS<br>
12
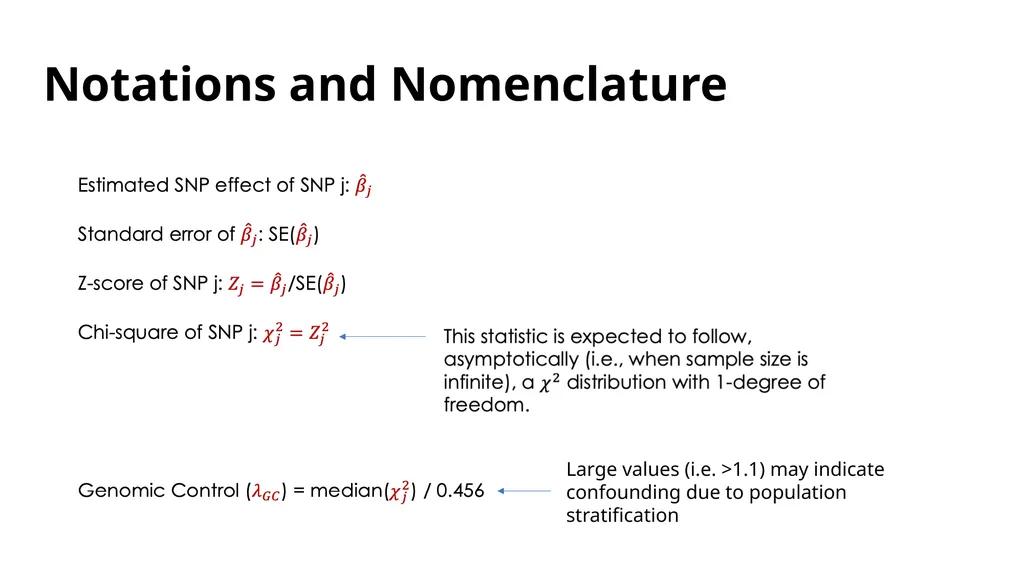
Notations and Nomenclature Large values (i.e. >1.1) may indicate confounding due to population stratification<br>
13
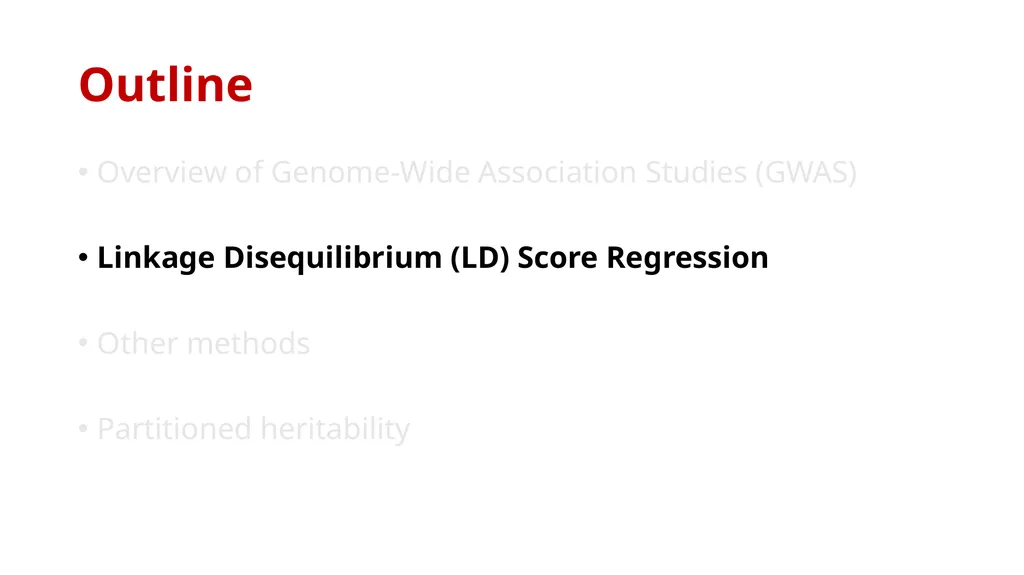
Outline Overview of Genome-Wide Association Studies (GWAS)
Linkage Disequilibrium (LD) Score Regression
Other methods
Partitioned heritability<br>
14
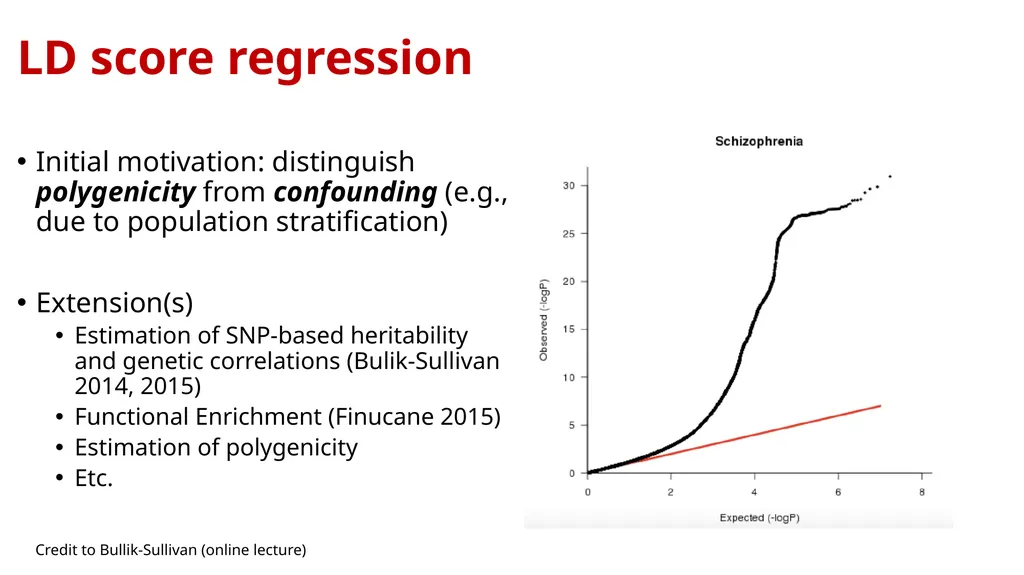
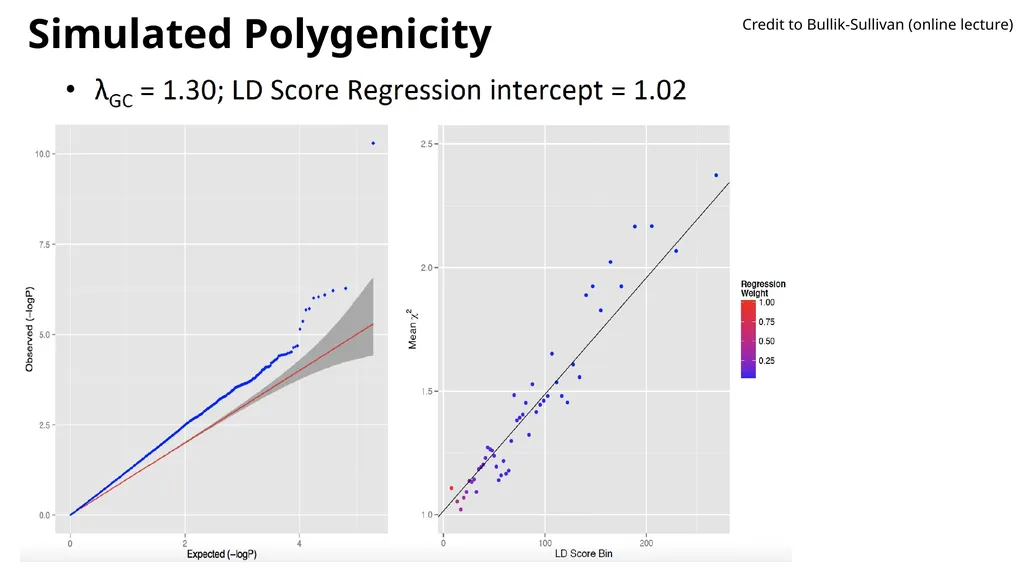
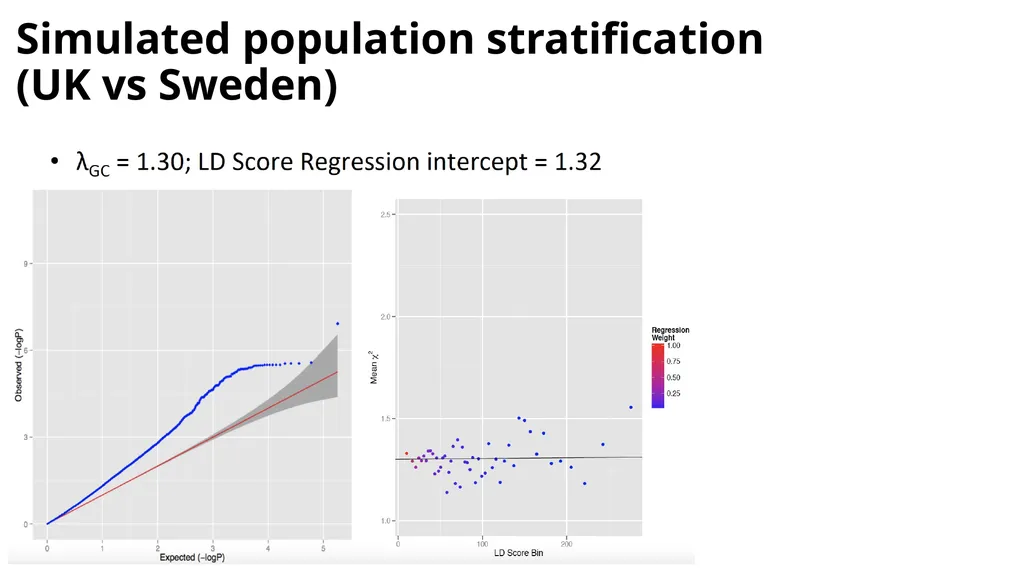
LD score regression Initial motivation: distinguish polygenicity from confounding (e.g., due to population stratification)
Extension(s)
Estimation of SNP-based heritability and genetic correlations (Bulik-Sullivan 2014, 2015)
Functional Enrichment (Finucane 2015)
Estimation of polygenicity
Etc. Credit to Bullik-Sullivan (online lecture)<br>
15
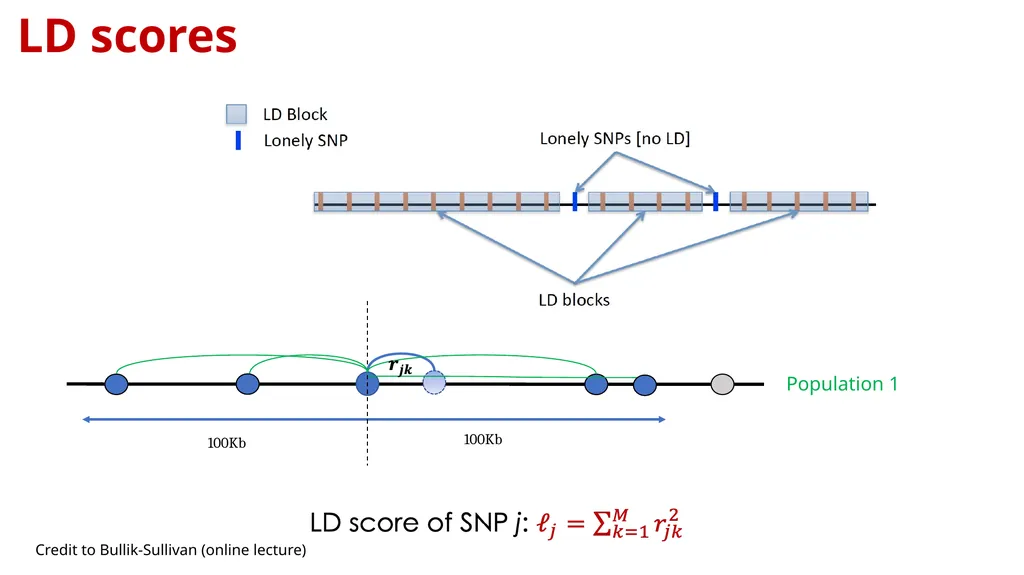
LD scores Credit to Bullik-Sullivan (online lecture)<br>
16
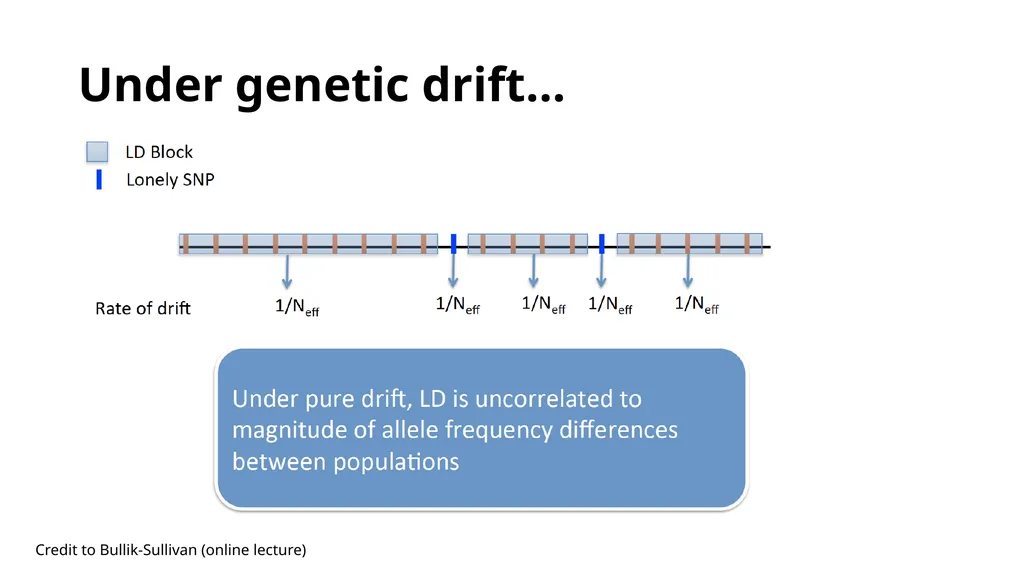
Under genetic drift… Credit to Bullik-Sullivan (online lecture)<br>
17
…the more you tag, the more likely you are to tag a causal variant! Key assumption
Each SNP explains the same amount of trait variance Credit to Bullik-Sullivan (online lecture)<br>
18
Simulated Polygenicity Credit to Bullik-Sullivan (online lecture)<br>
19
Simulated population stratification �(UK vs Sweden)<br>
20
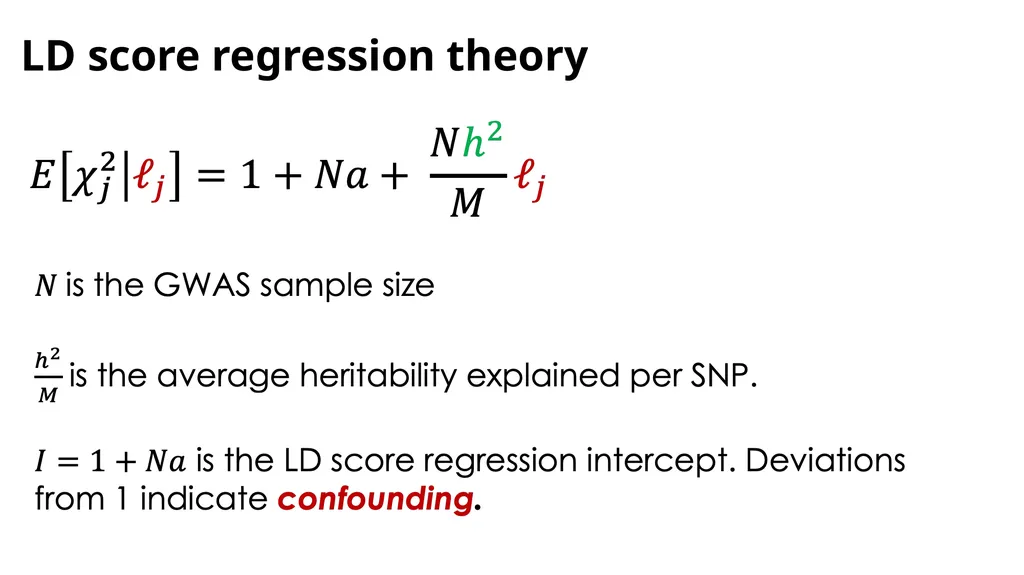
LD score regression theory<br>
21
Proof (More details in Supplementary Note of Bulik-Sullivan et al. 2014)<br>
22
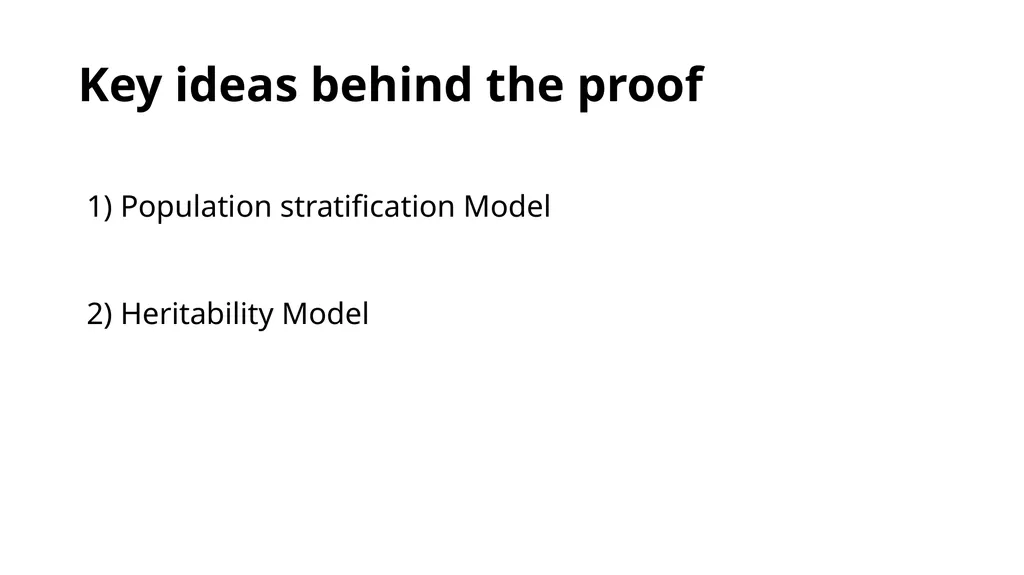
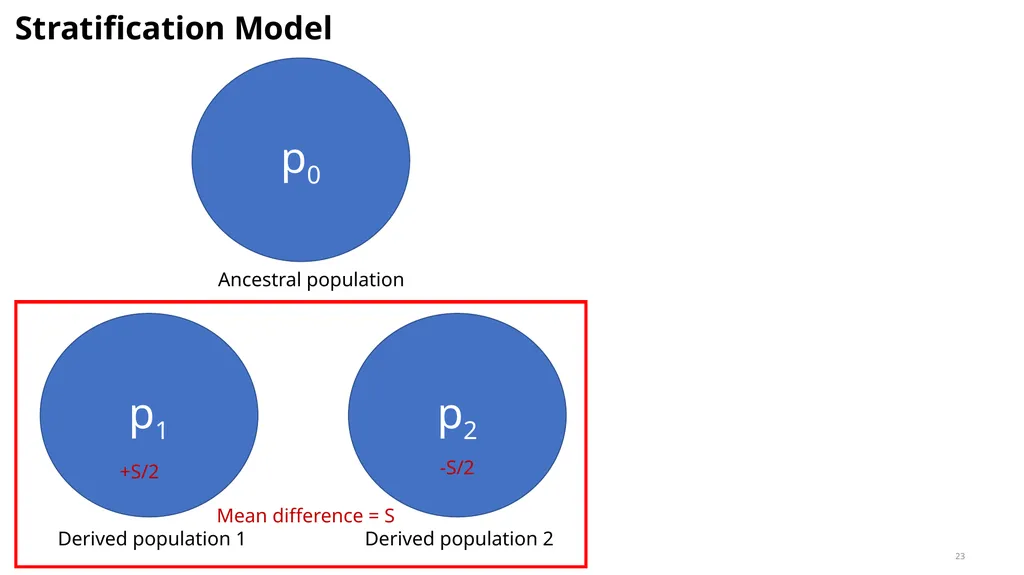
Key ideas behind the proof 1) Population stratification Model
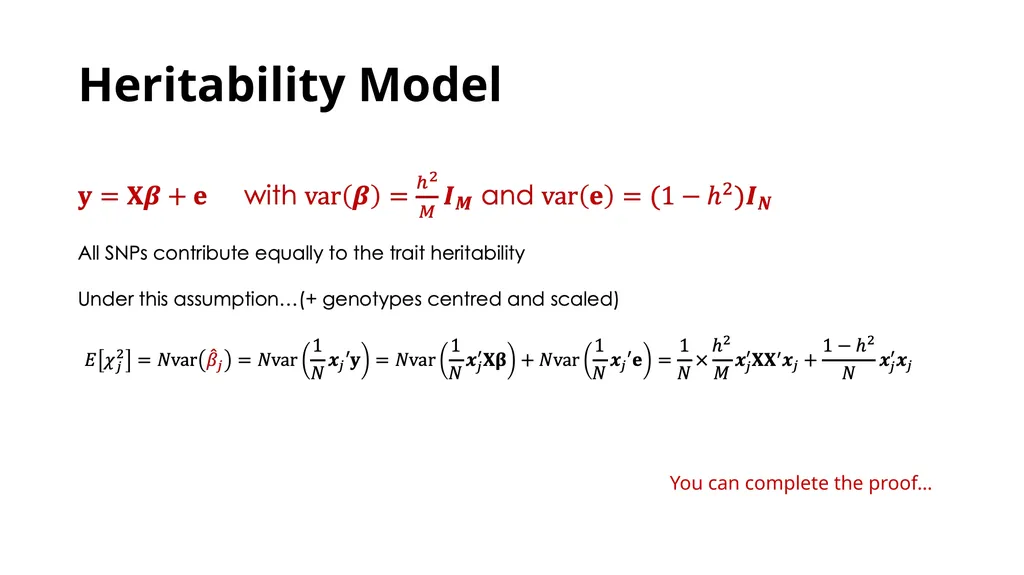
2) Heritability Model<br>
23
FST model: Balding-Nichols 23 p1 p2 p0 Ancestral population Derived population 1 Derived population 2 Stratification Model +S/2 -S/2 Mean difference = S<br>
24
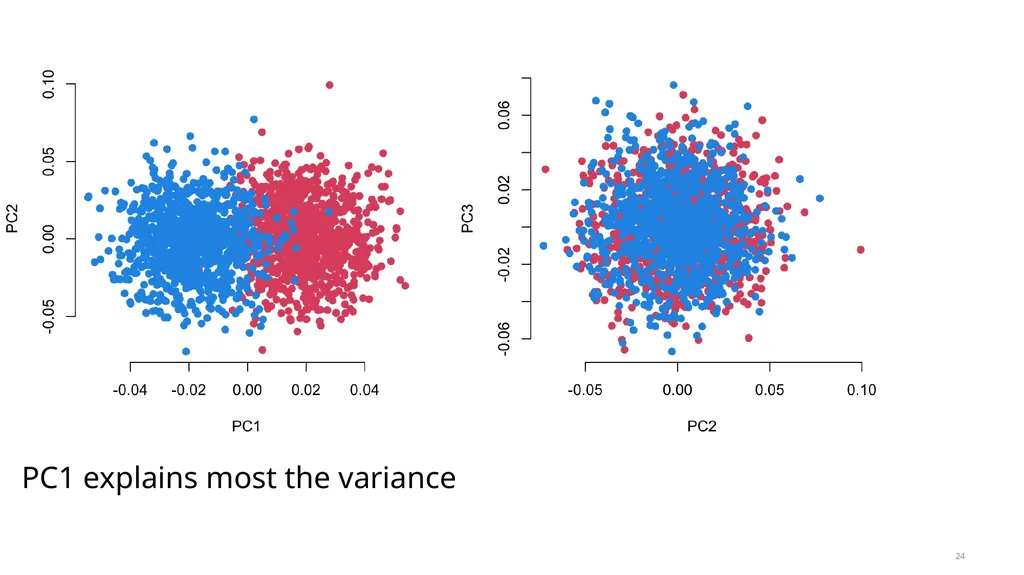
How does it look like? 24 PC1 explains most the variance<br>
25
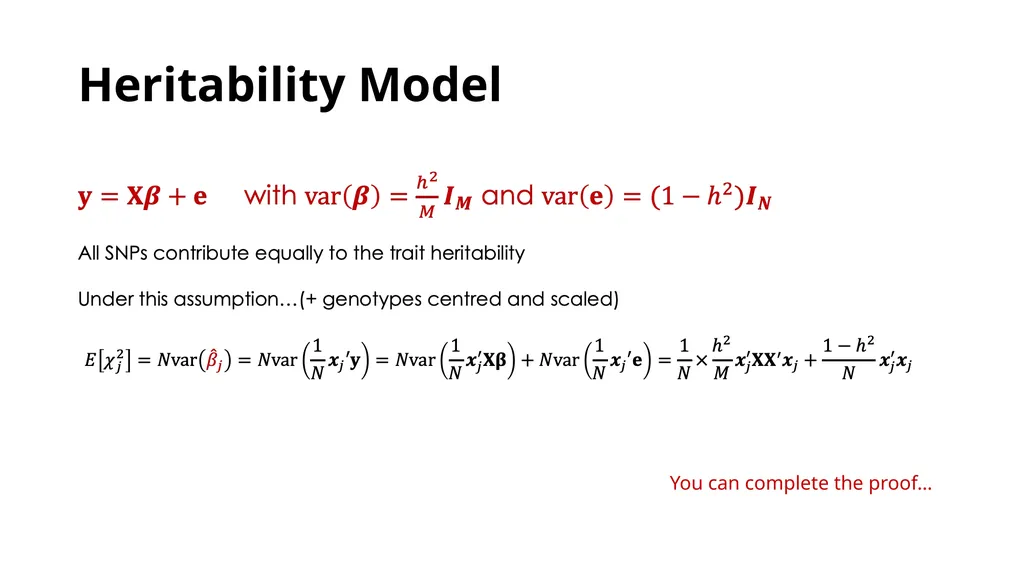
Heritability Model You can complete the proof…<br>
26
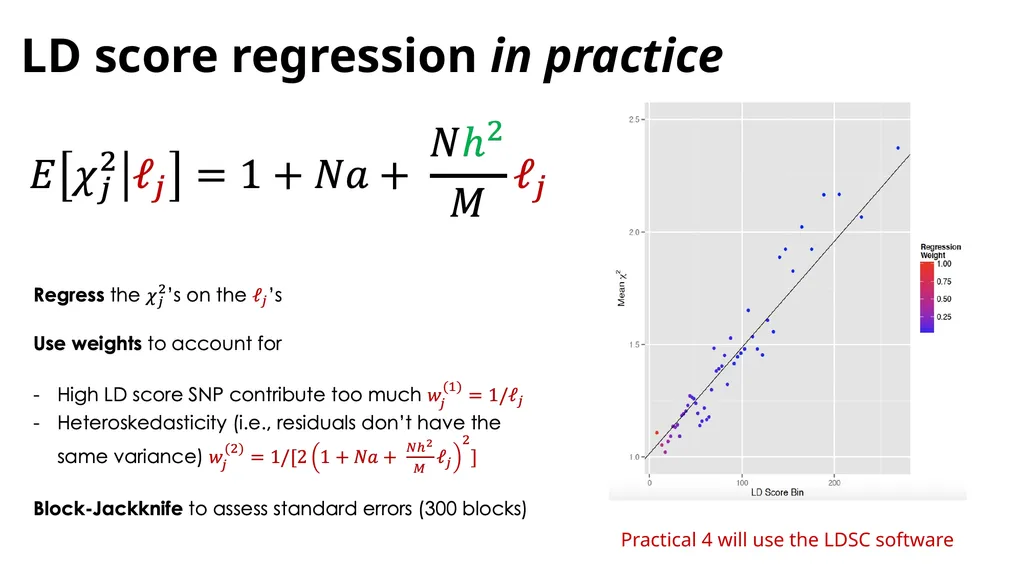
LD score regression in practice Practical 4 will use the LDSC software<br>
27
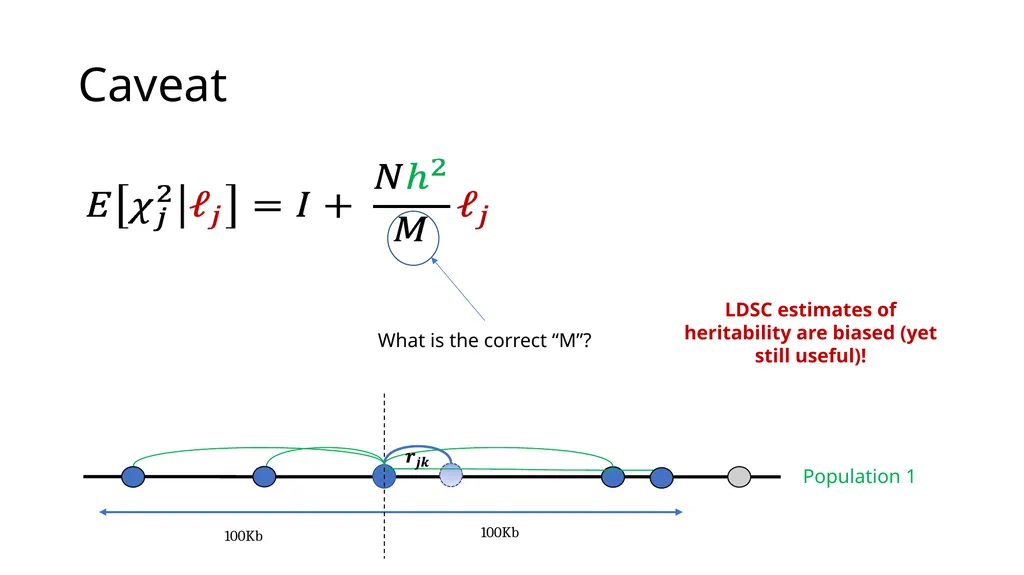
Caveat What is the correct “M”? LDSC estimates of heritability are biased (yet still useful)!<br>
28
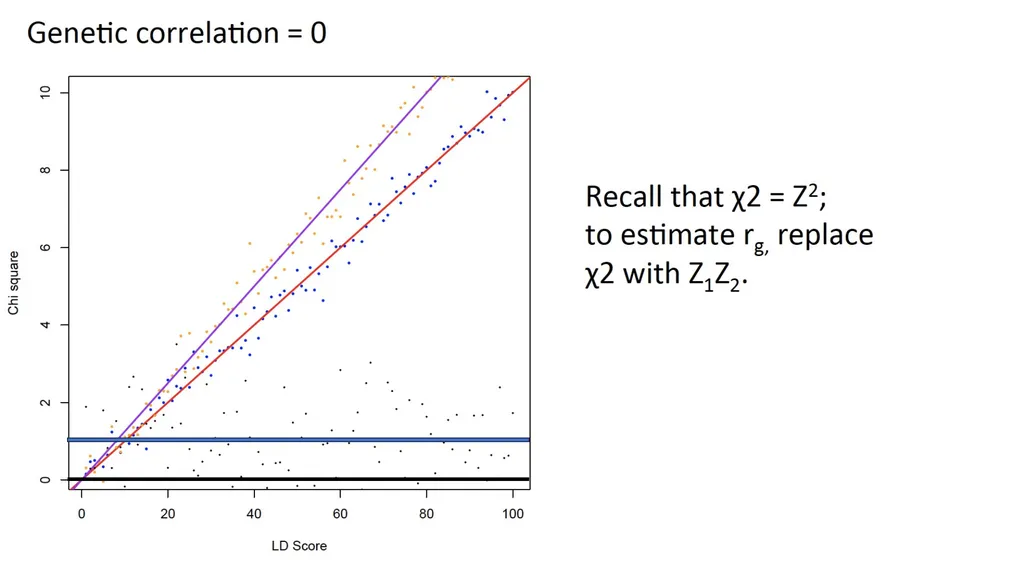
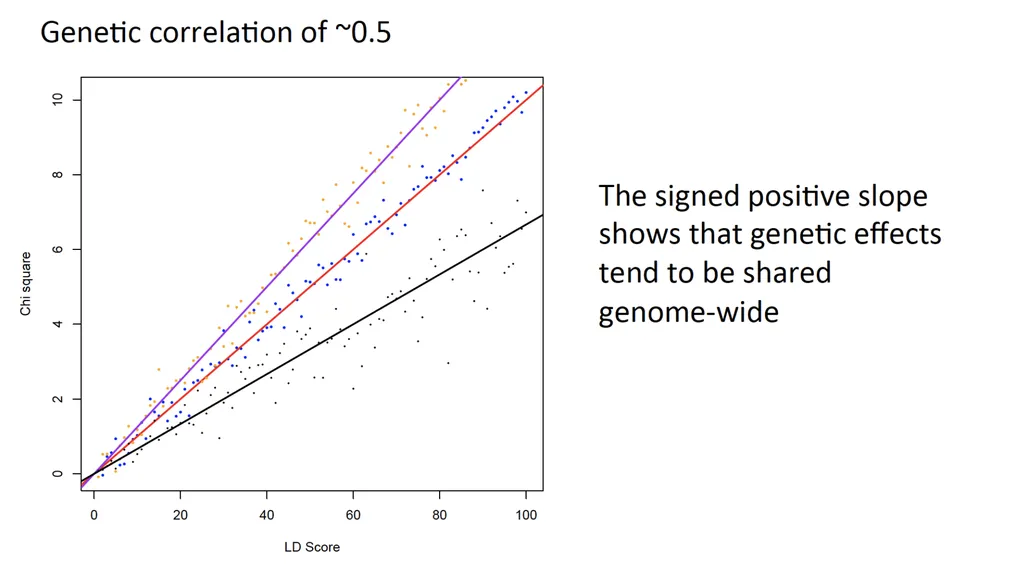
Estimation of genetic correlations (More details in Supplementary Note of Bulik-Sullivan et al. 2014)<br>
29
Heritability Model You can complete the proof…<br>
30
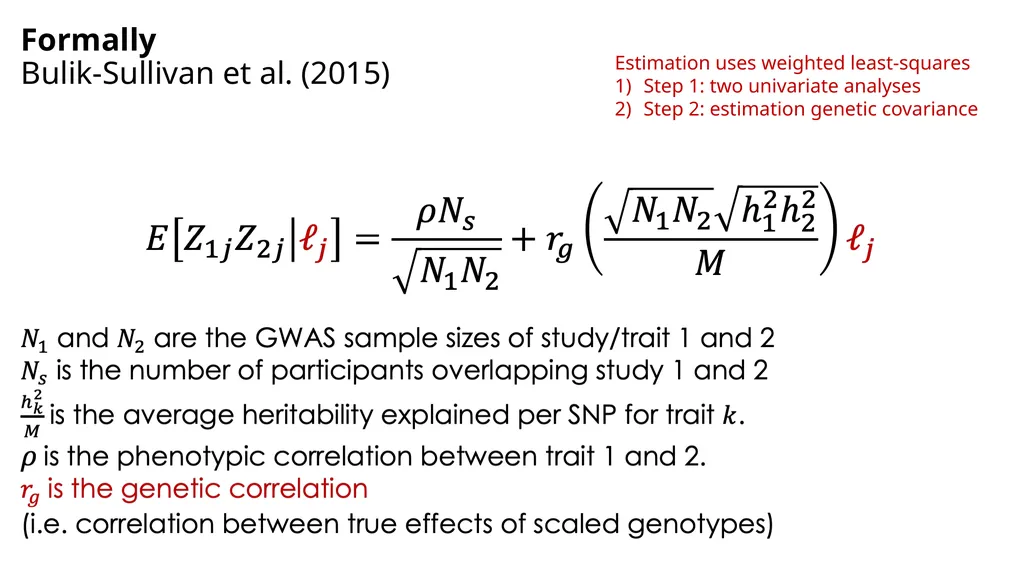
Formally �Bulik-Sullivan et al. (2015) Estimation uses weighted least-squares
Step 1: two univariate analyses
Step 2: estimation genetic covariance<br>
31
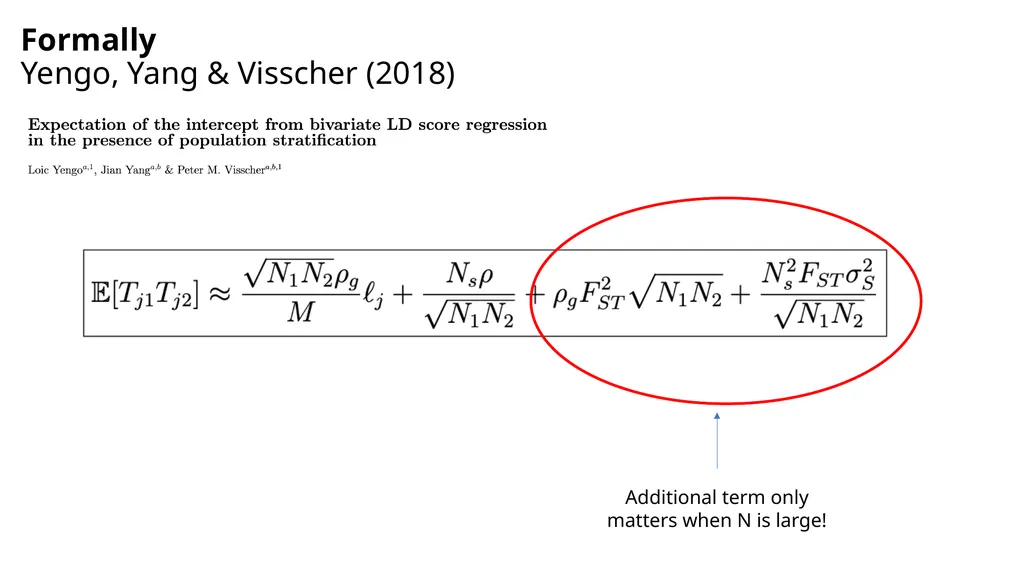
Formally �Yengo, Yang & Visscher (2018) Additional term only matters when N is large!<br>
32
Browsing genetic correlation in �UK Biobank��https://ukbb-rg.hail.is/<br>
34
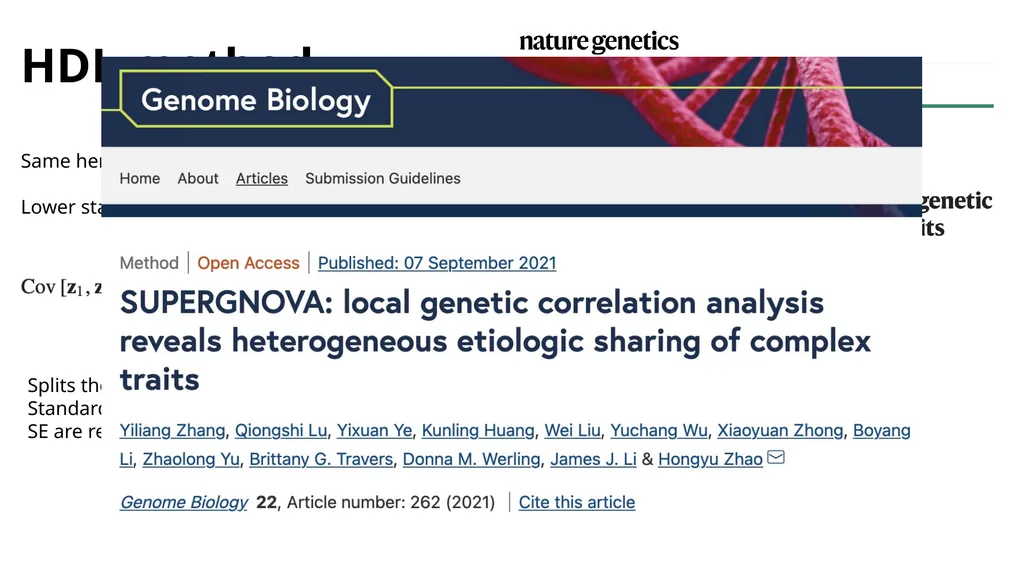
HDL method Same heritability model as LD score regression
Lower standard errors Splits the genome into 1700 independent LD blocks
Standard errors (SE) are still estimated using block jackknife
SE are reduced by ~3-fold!<br>
35
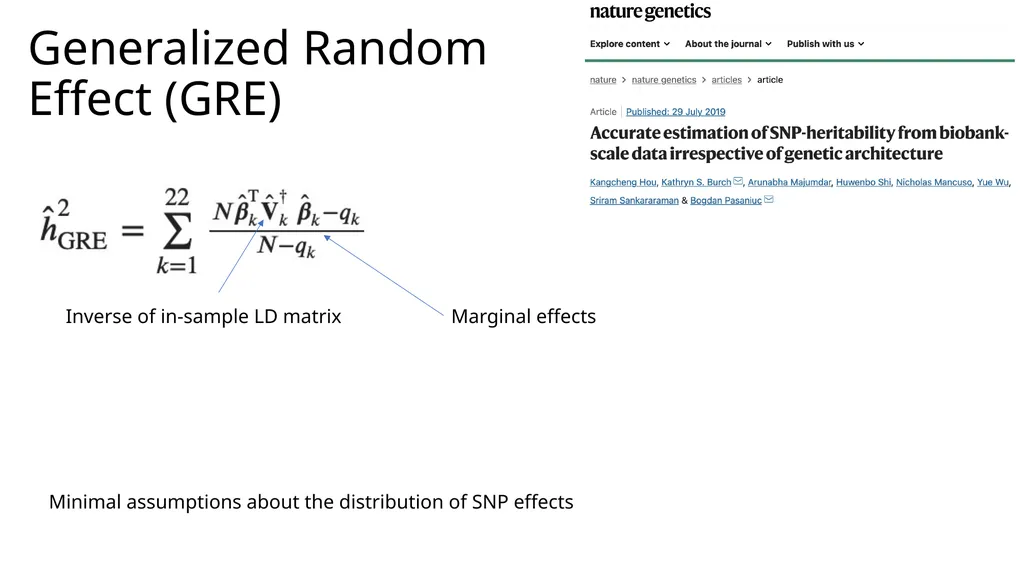
Generalized Random �Effect (GRE) Minimal assumptions about the distribution of SNP effects Marginal effects Inverse of in-sample LD matrix<br>
36
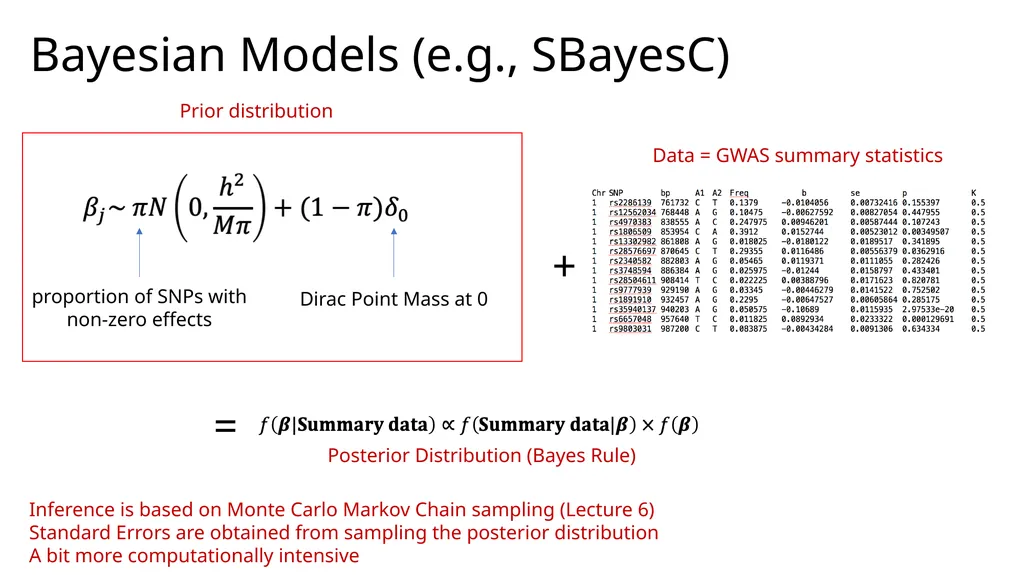
Bayesian Models (e.g., SBayesC) proportion of SNPs with non-zero effects Dirac Point Mass at 0 Inference is based on Monte Carlo Markov Chain sampling (Lecture 6)
Standard Errors are obtained from sampling the posterior distribution
A bit more computationally intensive Prior distribution + Data = GWAS summary statistics = Posterior Distribution (Bayes Rule)<br>
37
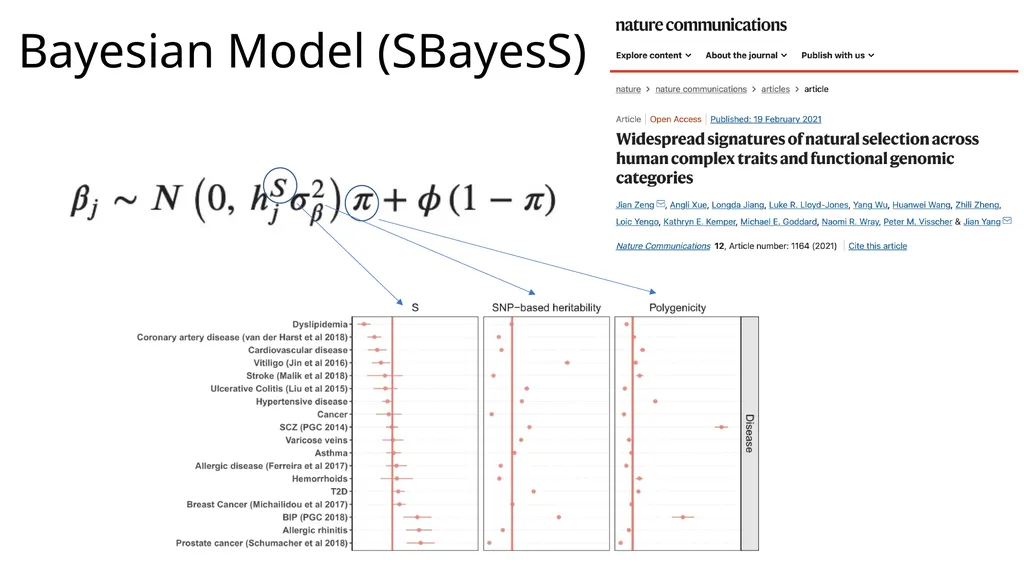
Bayesian Model (SBayesS)<br>
38
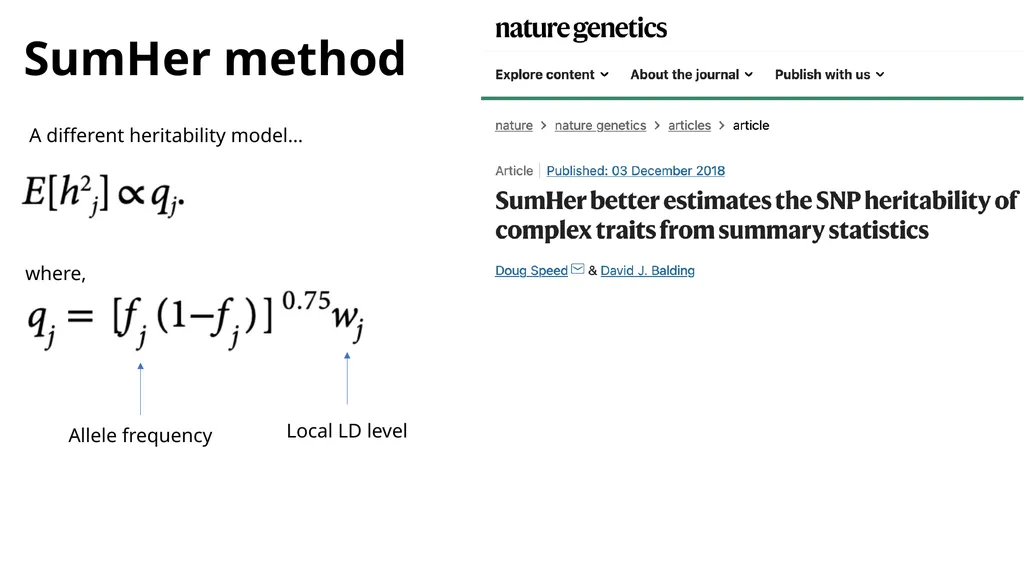
SumHer method A different heritability model… where, Allele frequency Local LD level<br>
39
Extensions of LD score regression<br>
40
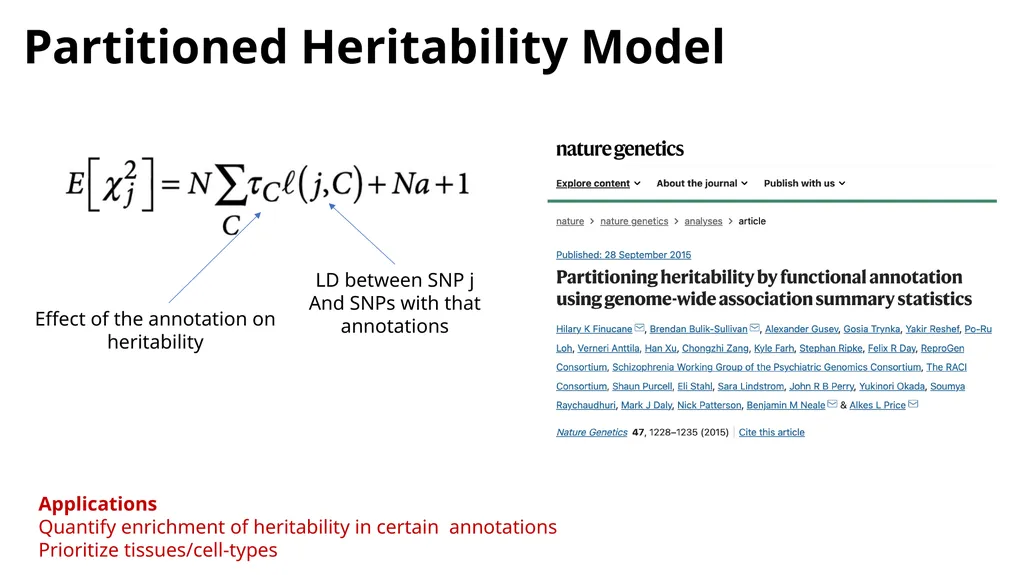
Partitioned Heritability Model Effect of the annotation on heritability LD between SNP j
And SNPs with that annotations Applications
Quantify enrichment of heritability in certain annotations
Prioritize tissues/cell-types<br>
41
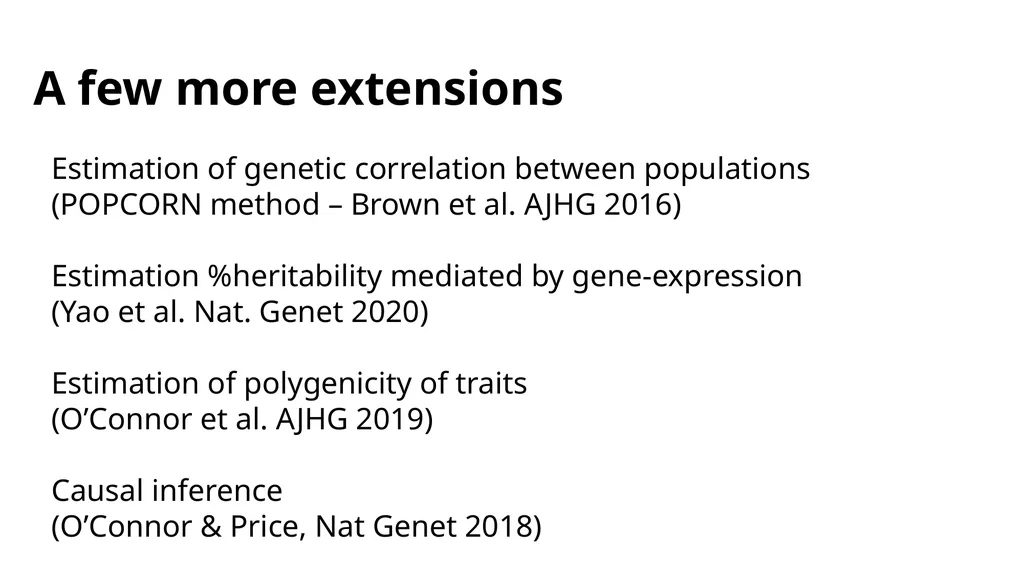
A few more extensions Estimation of genetic correlation between populations
(POPCORN method – Brown et al. AJHG 2016)
Estimation %heritability mediated by gene-expression
(Yao et al. Nat. Genet 2020)
Estimation of polygenicity of traits
(O’Connor et al. AJHG 2019)
Causal inference
(O’Connor & Price, Nat Genet 2018)<br>
42
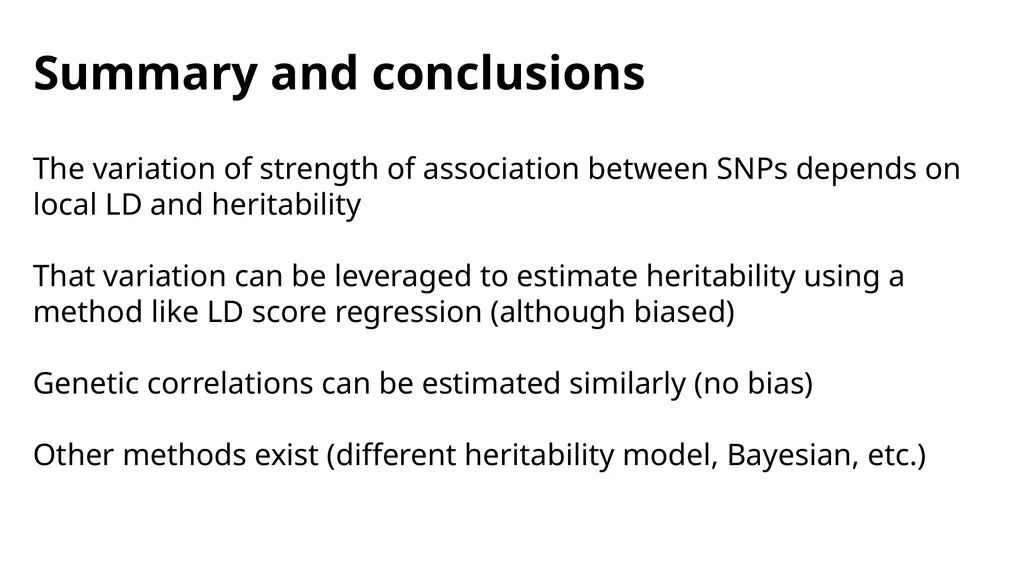
Summary and conclusions The variation of strength of association between SNPs depends on local LD and heritability
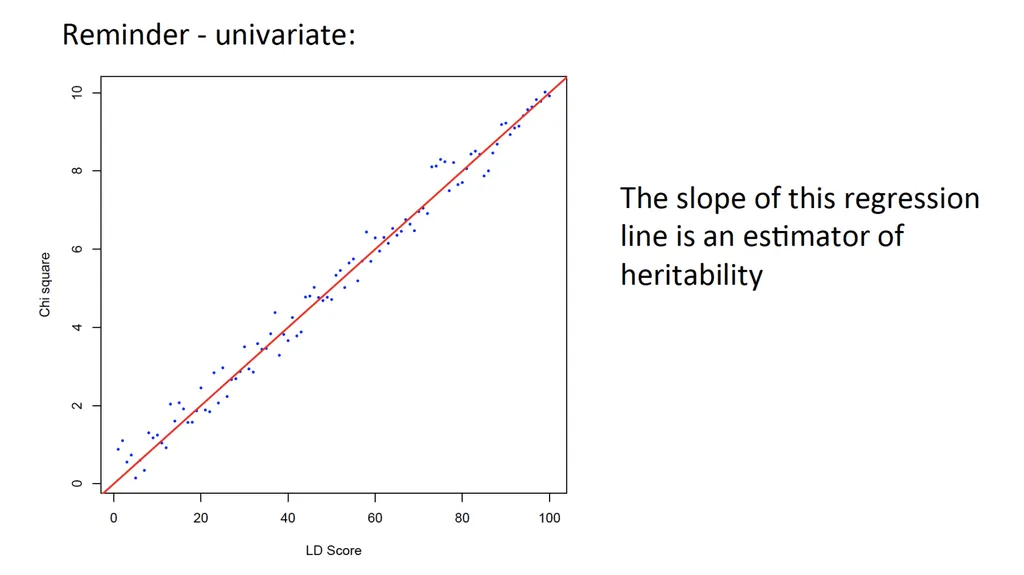
That variation can be leveraged to estimate heritability using a method like LD score regression (although biased)
Genetic correlations can be estimated similarly (no bias)
Other methods exist (different heritability model, Bayesian, etc.)<br>