
In preparing this research, we did not take into

Description: In preparing this research, we did not take into account the investment objectives, financial situation and particular needs of the reader. Before making an investment decision on the basis of this research, the reader needs to consider,
Related Topics
Download Presentation
"In preparing this research, we did not take into" is the property of its rightful owner. Permission is granted to download and print the materials on this website for personal, non-commercial use only, and to display it on your personal computer provided you do not modify the materials and that you retain all copyright notices contained in the materials. By downloading content from our website, you accept the terms of this agreement.
Presentation Transcript
slide1. In preparing this research, we did not take into account the investment objectives, financial situation and particular needs of the reader. Before making an investment decision on the basis of this research, the reader needs to consider, with or without the assistance of an adviser, whether the advice is appropriate in light of their particular investment needs, objectives and financial circumstances. Please see disclaimer. Palm oil price outlook China International Oils and Oilseeds Conference 2014 Sunaina Dhanuka
Macquarie Capital Securities (Malaysia) Sdn Bhd
+603 20598993
sunaina.dhanuka@macquarie.com
6th November 2014<br>
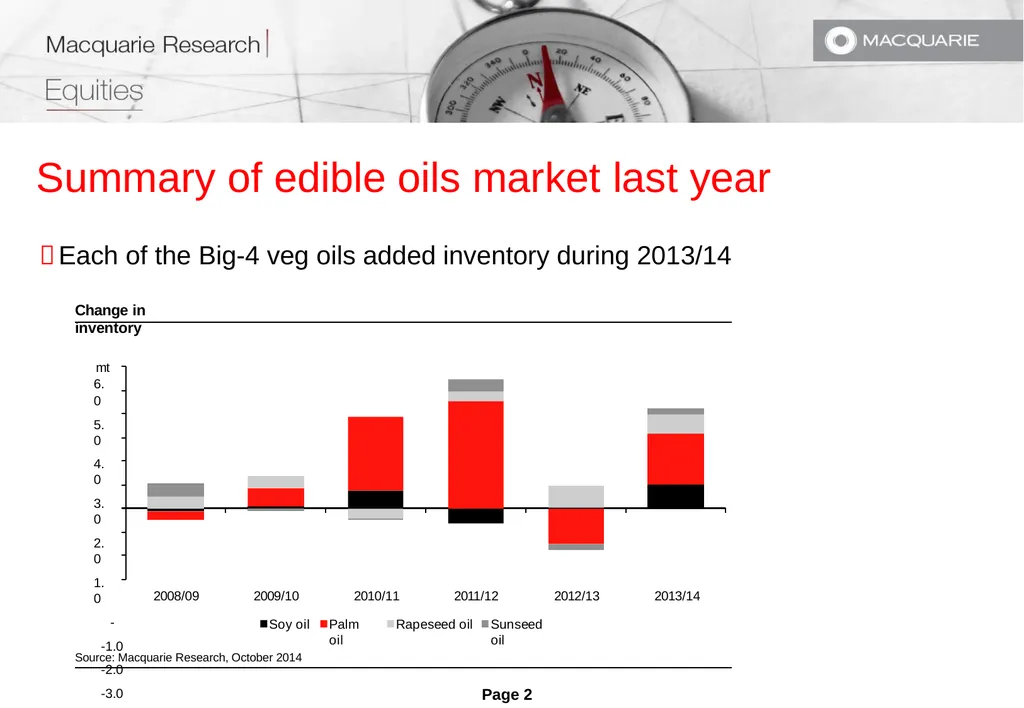
slide2. Summary of edible oils market last year Each of the Big-4 veg oils added inventory during 2013/14 Change in inventory
mt 6.0
5.0
4.0
3.0
2.0
1.0
-
-1.0
-2.0
-3.0 Source: Macquarie Research, October 2014 2008/09 2009/10 2010/11 2011/12 2012/13 2013/14 Soy oil Palm oil Rapeseed oil Sunseed oil Page 10<br>
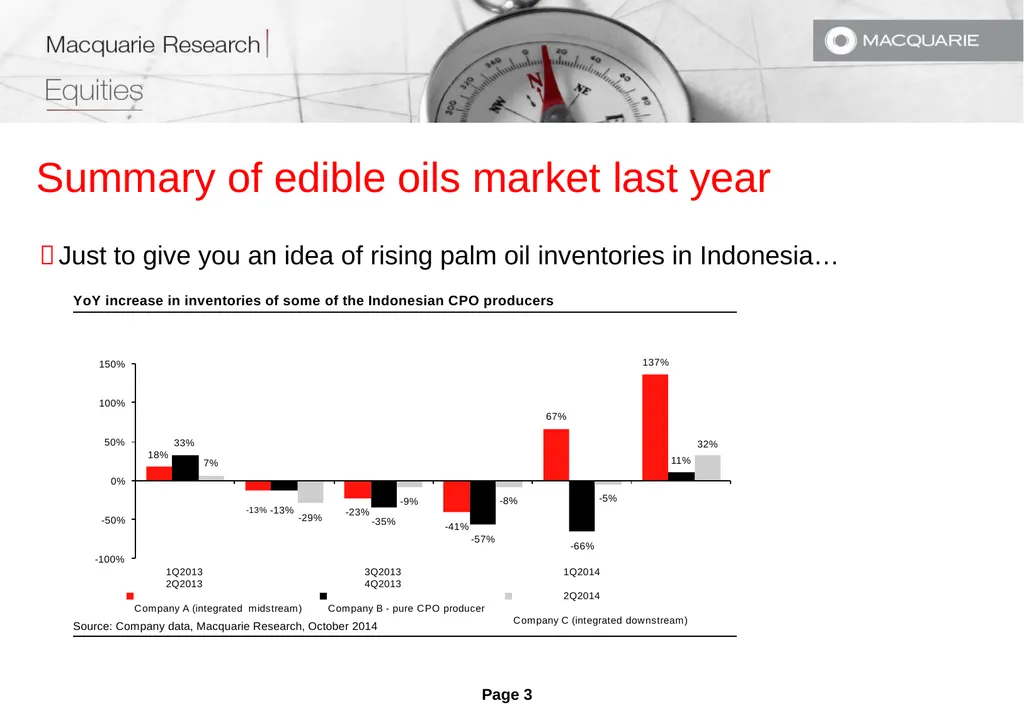
slide3. Summary of edible oils market last year Just to give you an idea of rising palm oil inventories in Indonesia…
YoY increase in inventories of some of the Indonesian CPO producers Source: Company data, Macquarie Research, October 2014 18% -13% -13% -23% -41% 100%
67% 137% 33% -35% -57% -66% 11% 7% -29% -9% -8% -5% 32% -100% -50% 0% 50% 150% 1Q2013 2Q2013
Company A (integrated midstream) 3Q2013 4Q2013
Company B - pure CPO producer 1Q2014 2Q2014
Company C (integrated downstream) Page 10<br>
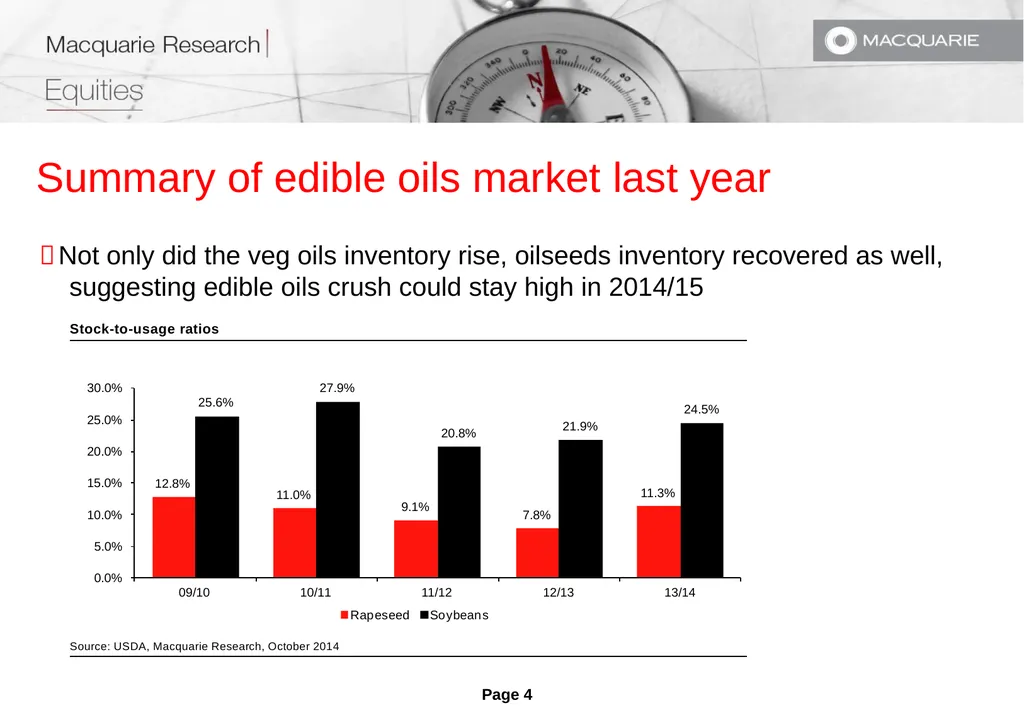
slide4. Summary of edible oils market last year Not only did the veg oils inventory rise, oilseeds inventory recovered as well, suggesting edible oils crush could stay high in 2014/15
Stock-to-usage ratios Source: USDA, Macquarie Research, October 2014 12.8% 11.0% 9.1% 7.8% 11.3% 25.6% 27.9% 20.8% 21.9% 24.5% 5.0%
0.0% 10.0% 15.0% 20.0% 25.0% 30.0% 09/10 10/11 11/12 12/13 13/14 Rapeseed Soybeans Page 10<br>
slide5. Summary of edible oils market last year Source: Bloomberg, Macquarie Research, October 2014 4-way ‘fight for demand’ narrowed spreads significantly
Veg oil prices (Rotterdam)
US$/t
1,350
1,250
1,150
1,050
950
850
750
650 Jan-13 Feb-13 Mar-13
Apr-13 May-13 Jun-13 Jul-13 Aug-13
Sep-13 Oct-13 Nov-13 Dec-13 Jan-14 Feb-14
Mar-14
Apr-14 May-14 Jun-14 Jul-14 Aug-14
Sep-14
Oct-14 Sun oil Rape oil Soy oil Palm oil Page 10<br>
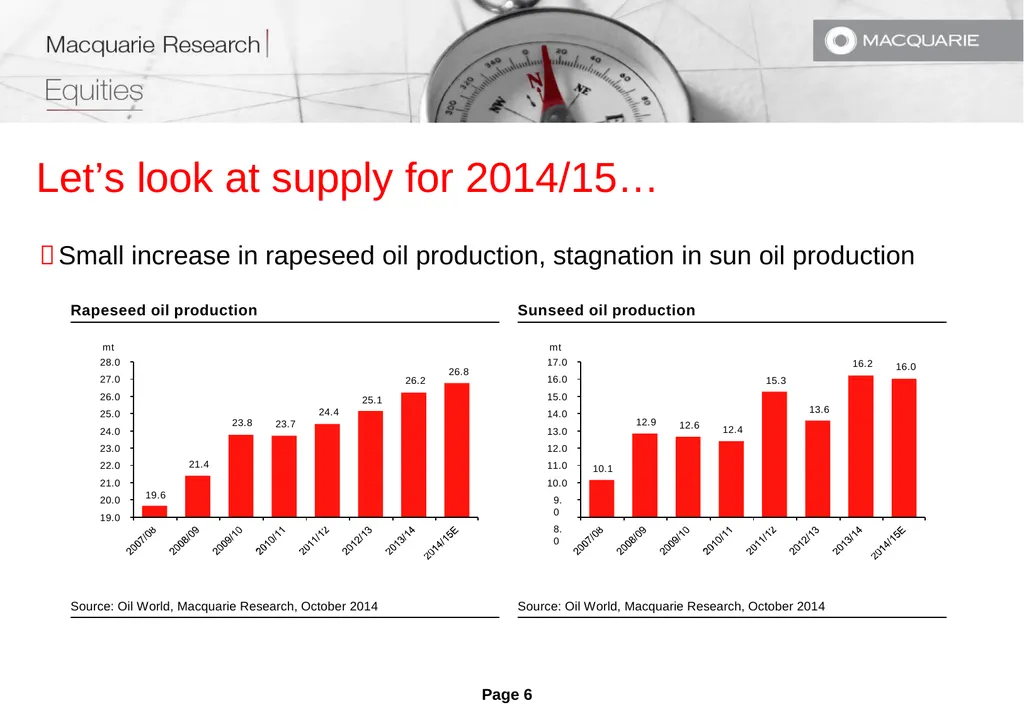
slide6. Let’s look at supply for 2014/15… Small increase in rapeseed oil production, stagnation in sun oil production Rapeseed oil production Sunseed oil production Source: Oil World, Macquarie Research, October 2014 Source: Oil World, Macquarie Research, October 2014 19.6 21.4 23.8 23.7 24.4 25.1 26.2 26.8 mt 28.0
27.0
26.0
25.0
24.0
23.0
22.0
21.0
20.0
19.0 10.1 12.9 12.6 12.4 15.3 13.6 16.2 16.0 mt 17.0
16.0
15.0
14.0
13.0
12.0
11.0
10.0
9.0
8.0 Page 10<br>
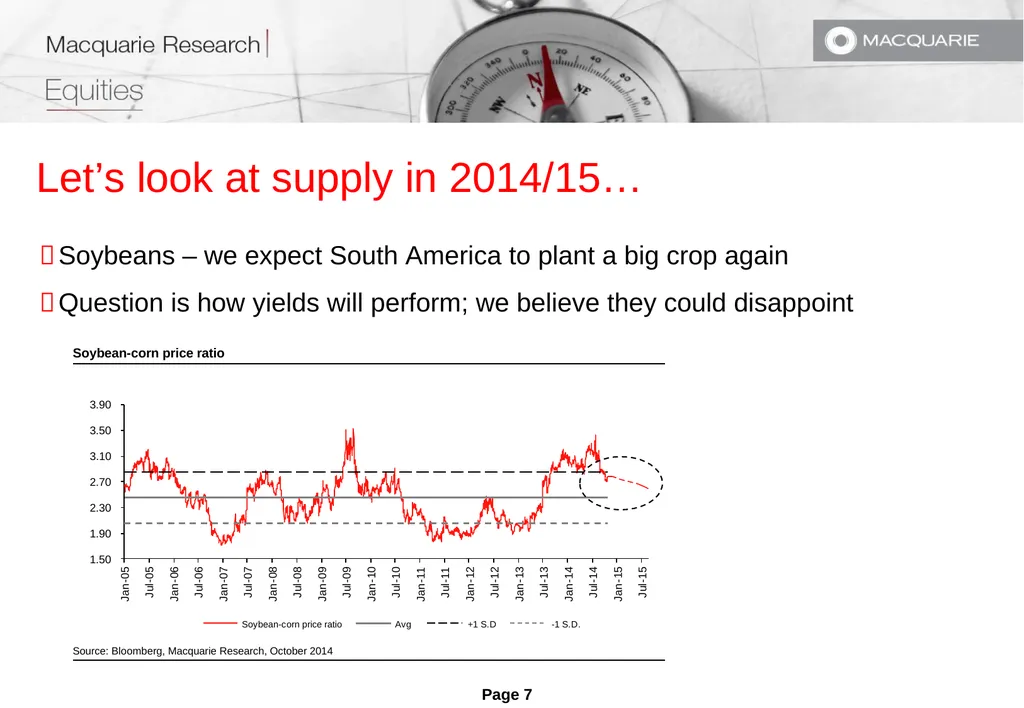
slide7. Let’s look at supply in 2014/15… Soybeans – we expect South America to plant a big crop again
Question is how yields will perform; we believe they could disappoint Soybean-corn price ratio Source: Bloomberg, Macquarie Research, October 2014 3.90
3.50
3.10
2.70
2.30
1.90
1.50 Jan-05 Jul-05 Jan-06 Jul-06 Jan-07 Jul-07 Jan-08 Jul-08 Jan-09 Jul-09 Jan-10 Jul-10 Jan-11 Jul-11 Jan-12 Jul-12 Jan-13 Jul-13 Jan-14 Jul-14 Jan-15 Jul-15 Soybean-corn price ratio Avg +1 S.D -1 S.D. Page 10<br>
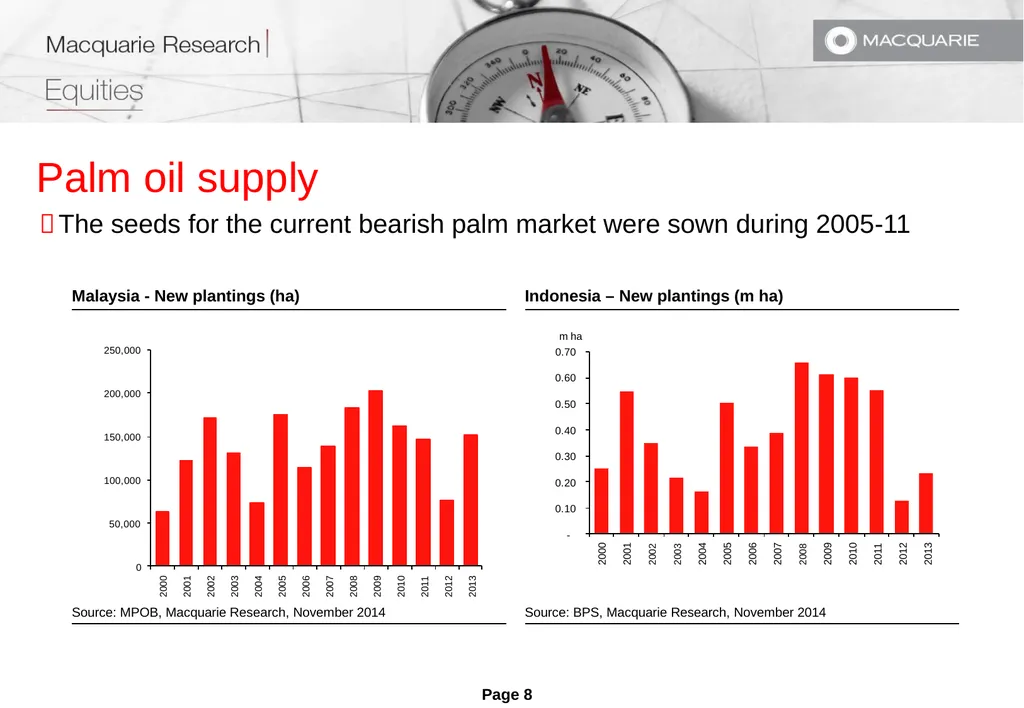
slide8. Palm oil supply
The seeds for the current bearish palm market were sown during 2005-11 Malaysia - New plantings (ha) Indonesia – New plantings (m ha) 250,000
200,000
150,000
100,000
50,000
0
Source: MPOB, Macquarie Research, November 2014 Source: BPS, Macquarie Research, November 2014 2000 2001 2002 2003 2004 2005 2006 2007 2008 2009 2010 2011 2012 2013 - Page 10 0.10 0.20 0.30 0.40 0.50 0.60 m ha 0.70 2000 2001 2002 2003 2004 2005 2006 2007 2008 2009 2010 2011 2012 2013<br>
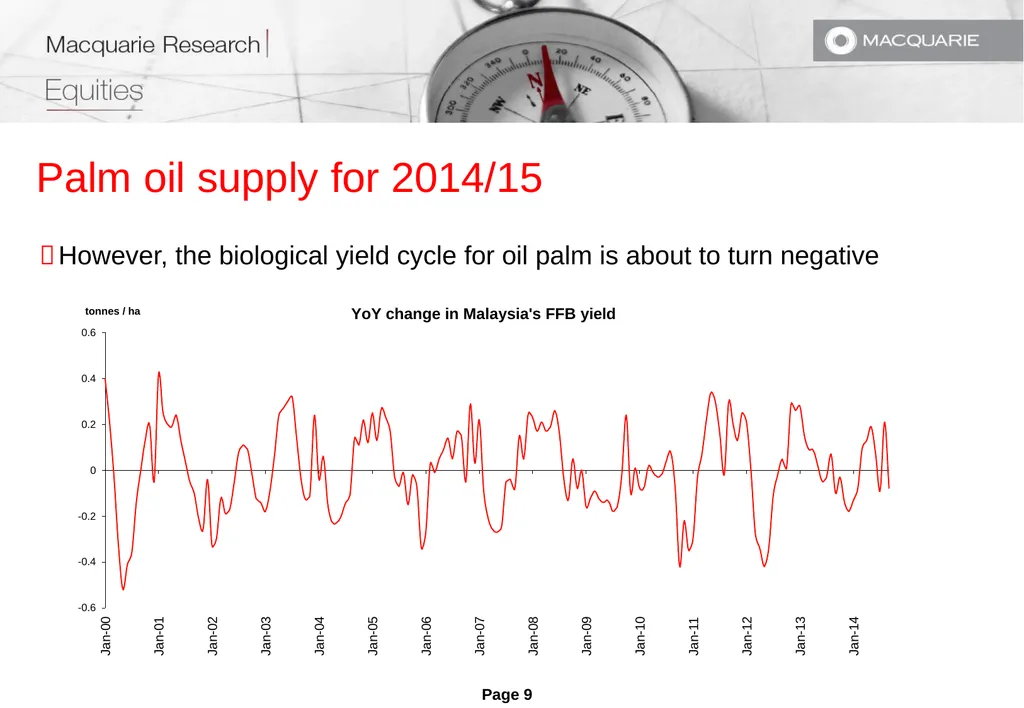
slide9. Palm oil supply for 2014/15 However, the biological yield cycle for oil palm is about to turn negative -0.6 Page 10 -0.4 -0.2 0 0.2 0.4 0.6 Jan-00 Jan-01 Jan-02 Jan-03 Jan-04 Jan-05 Jan-06 Jan-07 Jan-08 Jan-09 Jan-10 Jan-11 Jan-12 Jan-13 Jan-14 tonnes / ha YoY change in Malaysia's FFB yield<br>
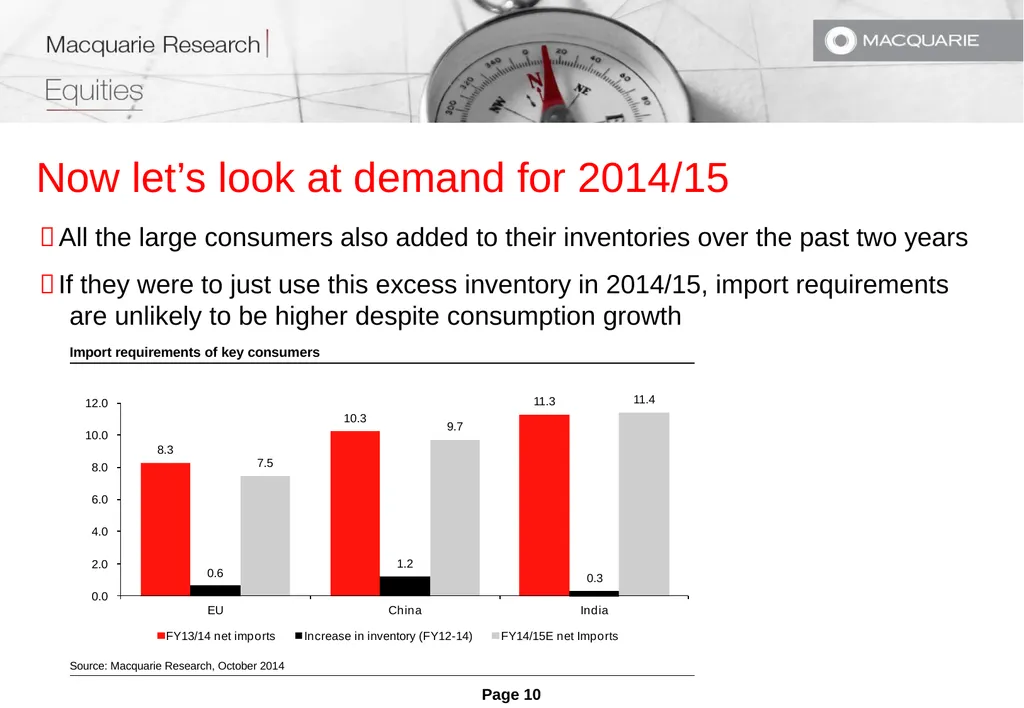
slide10. Now let’s look at demand for 2014/15 All the large consumers also added to their inventories over the past two years
If they were to just use this excess inventory in 2014/15, import requirements are unlikely to be higher despite consumption growth
Import requirements of key consumers Source: Macquarie Research, October 2014 8.3 10.3 11.3 0.6 1.2 0.3 7.5 9.7 11.4 0.0 2.0 6.0
4.0 8.0 10.0 12.0 EU China India FY13/14 net imports Increase in inventory (FY12-14) FY14/15E net Imports Page 10<br>
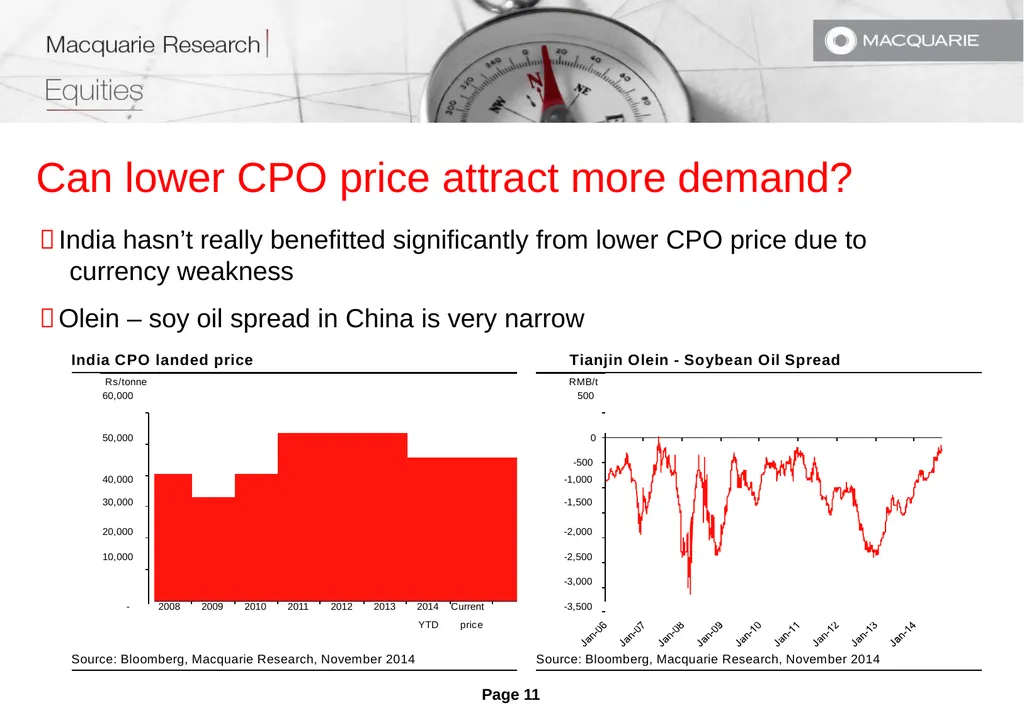
slide11. Can lower CPO price attract more demand? India hasn’t really benefitted significantly from lower CPO price due to
currency weakness
Olein – soy oil spread in China is very narrow
India CPO landed price Tianjin Olein - Soybean Oil Spread YTD price Source: Bloomberg, Macquarie Research, November 2014 Source: Bloomberg, Macquarie Research, November 2014 Page 11<br>
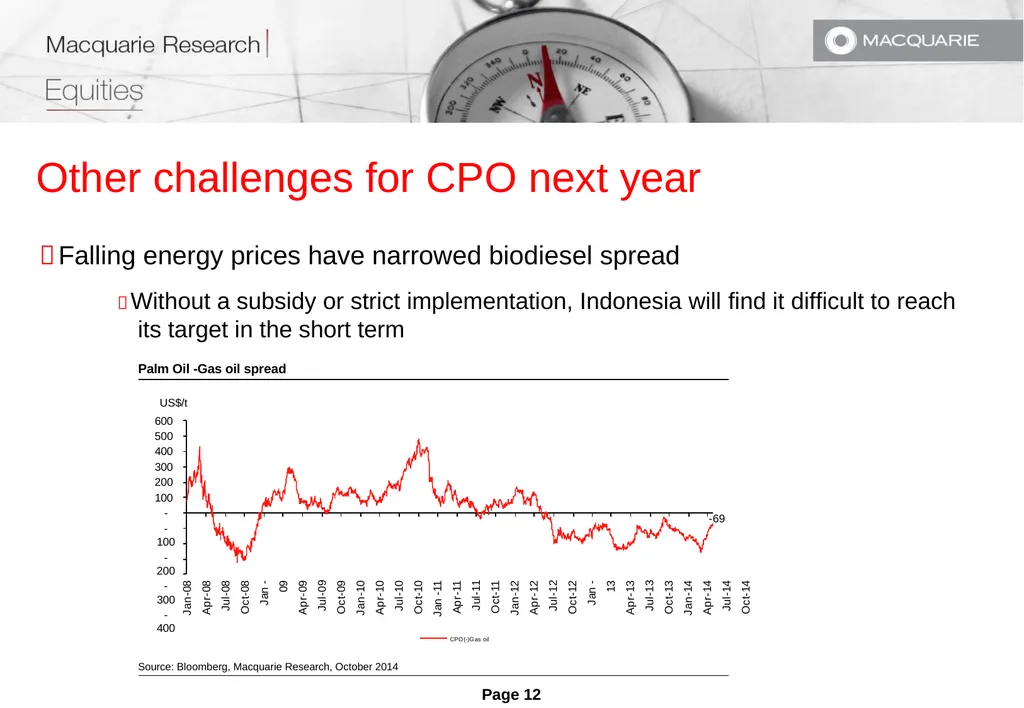
slide12. Other challenges for CPO next year Falling energy prices have narrowed biodiesel spread
Without a subsidy or strict implementation, Indonesia will find it difficult to reach its target in the short term
Palm Oil -Gas oil spread CPO(-)Gas oil
Source: Bloomberg, Macquarie Research, October 2014 Page 12 -69 600
500
400
300
200
100
-
-100
-200
-300
-400 Jan-08 Apr-08 Jul-08 Oct-08 Jan -09 Apr-09 Jul-09 Oct-09 Jan-10 Apr-10 Jul-10 Oct-10 Jan -11 Apr-11 Jul-11 Oct-11 Jan-12 Apr-12 Jul-12 Oct-12 Jan -13 Apr-13 Jul-13 Oct-13 Jan-14 Apr-14 Jul-14 Oct-14 US$/t<br>
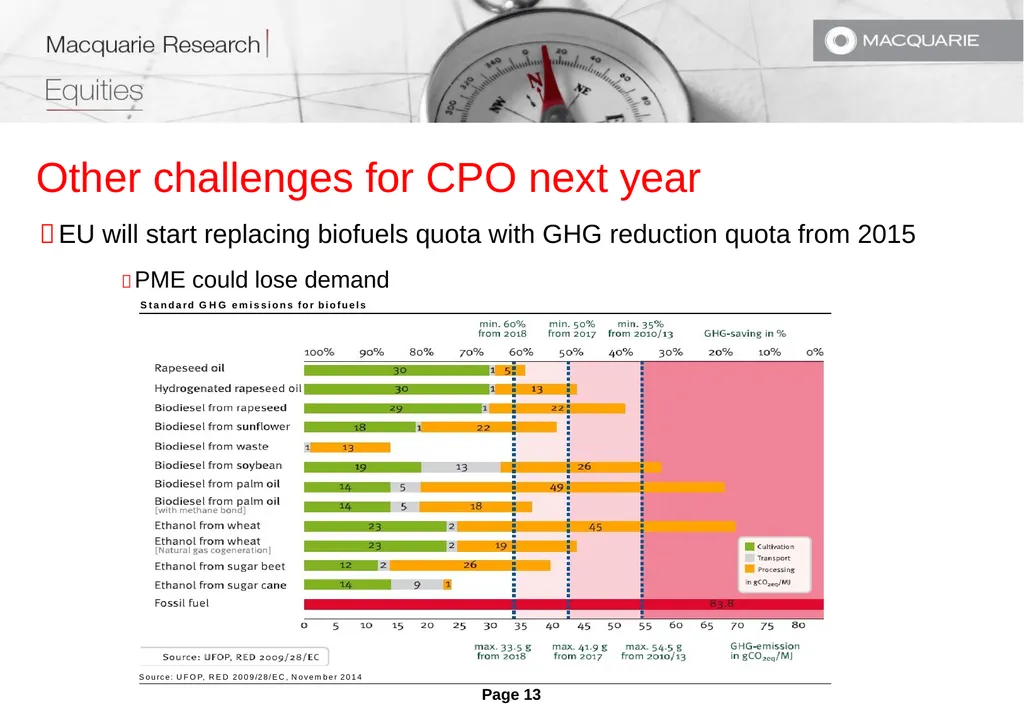
slide13. Other challenges for CPO next year EU will start replacing biofuels quota with GHG reduction quota from 2015
PME could lose demand
Standard GHG emissions for biofuels Source: UFOP, RED 2009/28/EC, November 2014 Page 12<br>
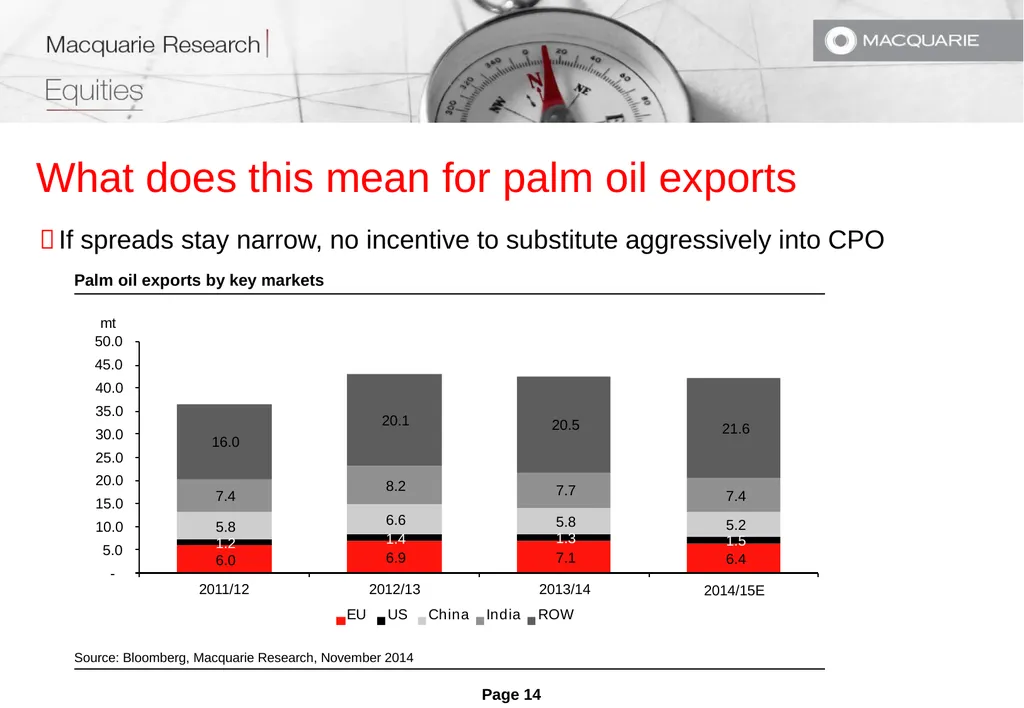
slide14. What does this mean for palm oil exports If spreads stay narrow, no incentive to substitute aggressively into CPO
Palm oil exports by key markets Source: Bloomberg, Macquarie Research, November 2014 6.0 6.9 7.1 6.4 5.8
1.2 6.6
1.4 5.8
1.3 5.2
1.5 7.4 8.2 7.7 7.4 16.0 20.1 20.5 21.6 mt 50.0
45.0
40.0
35.0
30.0
25.0
20.0
15.0
10.0
5.0
- 2014/15E Page 12<br>
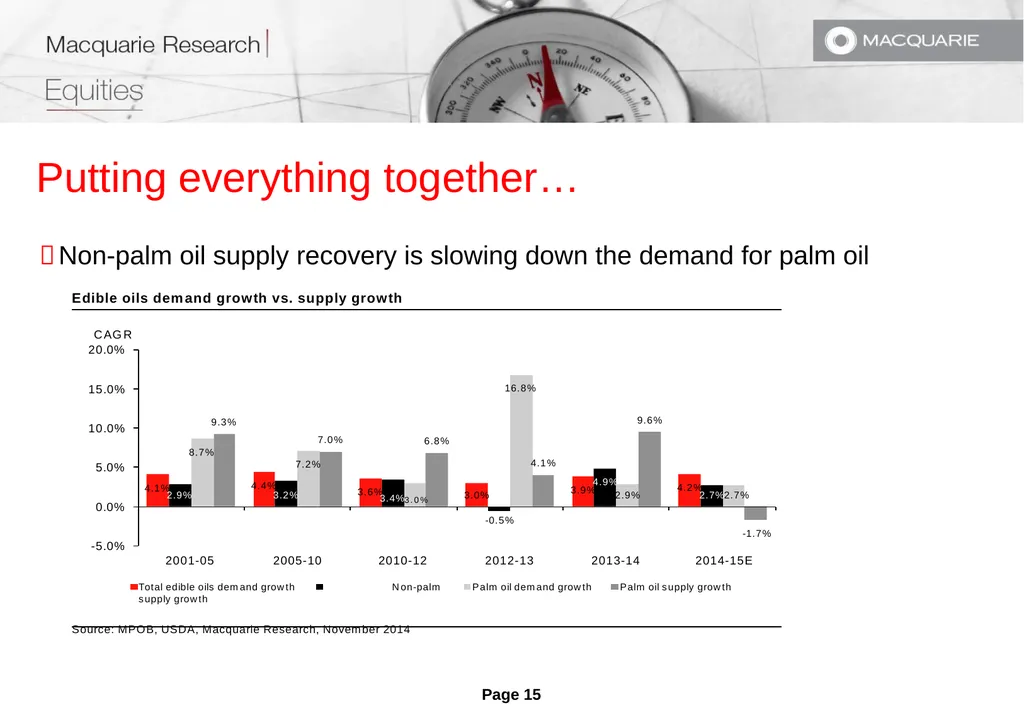
slide15. Putting everything together… Non-palm oil supply recovery is slowing down the demand for palm oil
Edible oils demand growth vs. supply growth Total edible oils demand growth Non-palm supply growth
Source: MPOB, USDA, Macquarie Research, November 2014 4.1% 4.4% 3.6% 3.0% 3.9% 4.2% 2.9% 3.2% 3.4%3.0% 0.0%
-0.5% 4.9% 2.7%2.7% 8.7% 7.2% 16.8% 2.9% 9.3% 7.0% 6.8% 4.1% 9.6% -1.7%
2013-14 2014-15E -5.0% 5.0% 10.0% 15.0% CAGR
20.0% 2001-05 2005-10 2010-12 2012-13 Palm oil demand growth Palm oil supply growth Page 12<br>
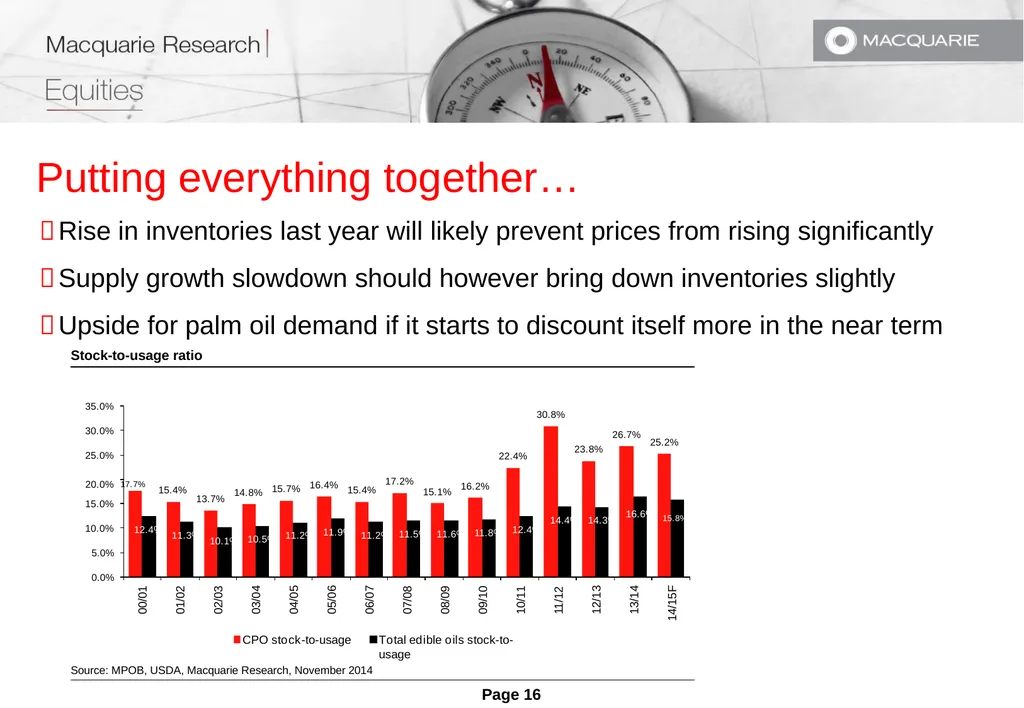
slide16. Putting everything together… Rise in inventories last year will likely prevent prices from rising significantly
Supply growth slowdown should however bring down inventories slightly
Upside for palm oil demand if it starts to discount itself more in the near term
Stock-to-usage ratio Source: MPOB, USDA, Macquarie Research, November 2014 20.0% 17.7% 15.4% 13.7% 14.8% 15.7% 16.4% 15.4% 17.2% 15.1% 16.2% 22.4% 30.8% 23.8% 26.7% 25.2% 12.4% 11.3% 10.1% 10.5% 11.2% 11.9% 11.2% 11.5% 11.6% 11.8% 12.4% 14.4% 14.3% 16.6% 15.8% 5.0%
0.0% 10.0% 15.0% 25.0% 30.0% 35.0% 00/01 01/02 02/03 03/04 04/05 05/06 06/07 07/08 08/09 09/10 10/11 11/12 12/13 13/14 14/15F CPO stock-to-usage Total edible oils stock-to-usage Page 12<br>
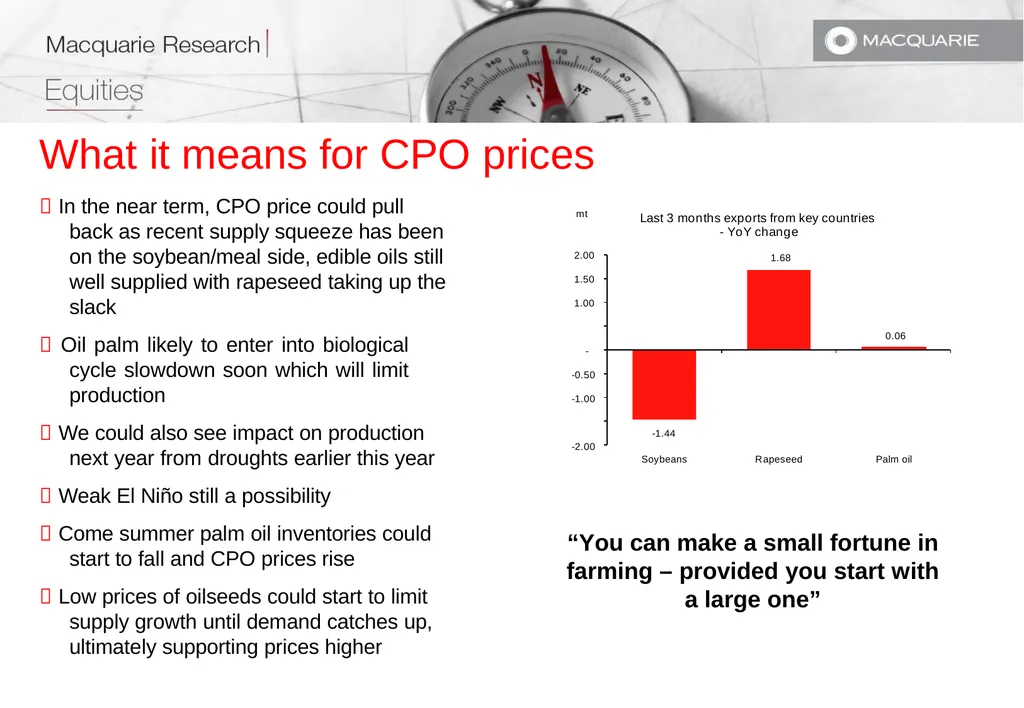
slide17. What it means for CPO prices In the near term, CPO price could pull back as recent supply squeeze has been on the soybean/meal side, edible oils still well supplied with rapeseed taking up the slack
Oil palm likely to enter into biological cycle slowdown soon which will limit production
We could also see impact on production next year from droughts earlier this year
Weak El Niño still a possibility
Come summer palm oil inventories could
start to fall and CPO prices rise
Low prices of oilseeds could start to limit supply growth until demand catches up, ultimately supporting prices higher -1.44 Last 3 months exports from key countries
- YoY change
1.68 0.06 -2.00 -1.00 -0.50 - 1.00 1.50 2.00 Soybeans Rapeseed Palm oil mt “You can make a small fortune in farming – provided you start with a large one”<br>
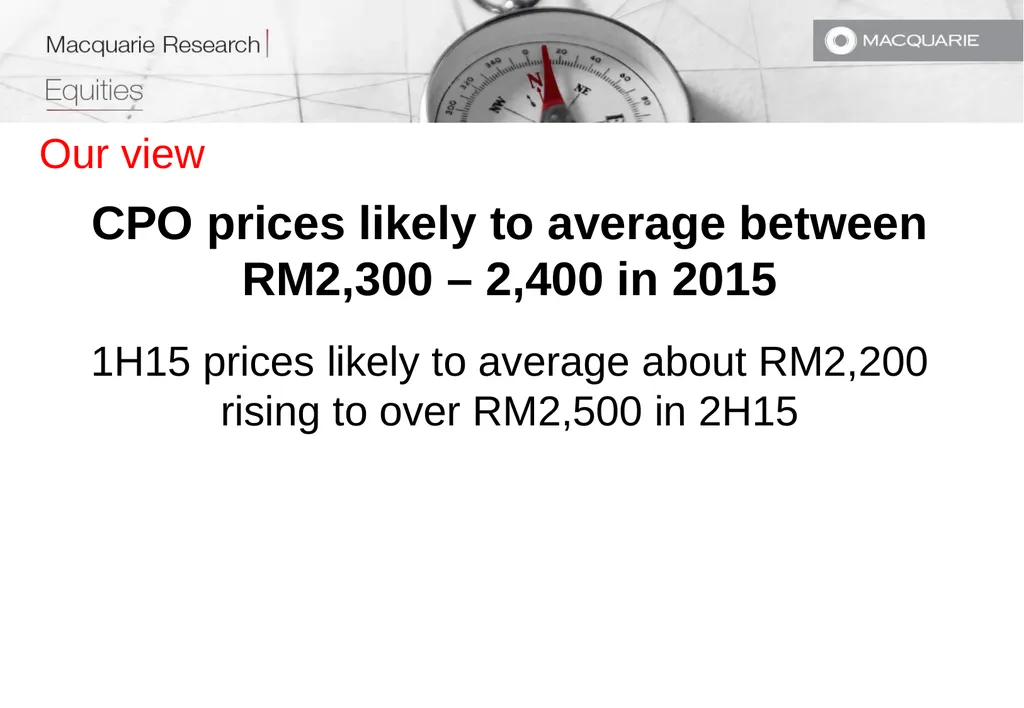
slide18. Our view CPO prices likely to average between
RM2,300 – 2,400 in 2015 1H15 prices likely to average about RM2,200
rising to over RM2,500 in 2H15<br>
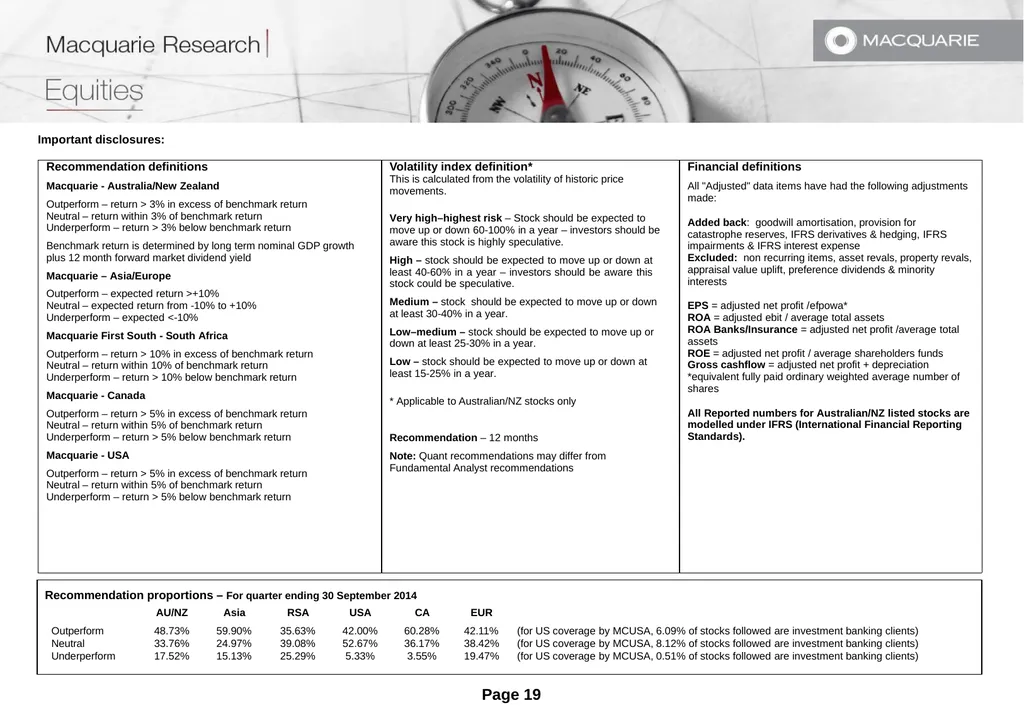
slide19. Important disclosures: Recommendation proportions – For quarter ending 30 September 2014 Page 19<br>
slide20. Company-Specific Disclosures:
Important disclosure information regarding the subject companies covered in this report is available at www.macquarie.com/disclosures.
Analyst Certification:
The views expressed in this research accurately reflect the personal views of the analyst(s) about the subject securities or issuers and no part of the compensation of the analyst(s) was, is, or will be directly or indirectly related to the inclusion of specific recommendations or views in this research. The analyst principally responsible for the preparation of this research receives compensation based on overall revenues of Macquarie Group Ltd ABN 94 122 169 279 (AFSL No. 318062) (MGL) and its related entities (the Macquarie Group) and has taken reasonable care to achieve and maintain independence and objectivity in making any recommendations.
General Disclaimers:
Macquarie Securities (Australia) Ltd; Macquarie Capital (Europe) Ltd; Macquarie Capital Markets Canada Ltd; Macquarie Capital Markets North America Ltd; Macquarie Capital (USA) Inc; Macquarie Capital Securities Ltd and its Taiwan branch; Macquarie Capital Securities (Singapore) Pte Ltd; Macquarie Securities (NZ) Ltd; and Macquarie First South Securities (Pty) Limited; Macquarie Capital Securities (India) Pvt Ltd; Macquarie Capital Securities (Malaysia) Sdn Bhd; Macquarie Securities Korea Limited and Macquarie Securities (Thailand) Ltd are not authorized deposit-taking institutions for the purposes of the Banking Act 1959 (Commonwealth of Australia), and their obligations do not represent deposits or other liabilities of Macquarie Bank Limited ABN 46 008 583 542 (MBL) or MGL. MBL does not guarantee or otherwise provide assurance in respect of the obligations of any of the above mentioned entities. MGL provides a guarantee to the Monetary Authority of Singapore in respect of the obligations and liabilities of Macquarie Capital Securities (Singapore) Pte Ltd for up to SGD 35 million. This research has been prepared for the general use of the wholesale clients of the Macquarie Group and must not be copied, either in whole or in part, or distributed to any other person. If you are not the intended recipient you must not use or disclose the information in this research in any way. If you received it in error, please tell us immediately by return e-mail and delete the document. We do not guarantee the integrity of any e-mails or attached files and are not responsible for any changes made to them by any other person. MGL has established and implemented a conflicts policy at group level (which may be revised and updated from time to time) (the "Conflicts Policy") pursuant to regulatory requirements (including the FCA Rules) which sets out how we must seek to identify and manage all material conflicts of interest. Nothing in this research shall be construed as a solicitation to buy or sell any security or product, or to engage in or refrain from engaging in any transaction. In preparing this research, we did not take into account your investment objectives, financial situation or particular needs. Before making an investment decision on the basis of this research, you need to consider, with or without the assistance of an adviser, whether the advice is appropriate in light of your particular investment needs, objectives and financial circumstances. There are risks involved in securities trading. The price of securities can and does fluctuate, and an individual security may even become valueless. International investors are reminded of the additional risks inherent in international investments, such as currency fluctuations and international stock market or economic conditions, which may adversely affect the value of the investment. This research is based on information obtained from sources believed to be reliable but we do not make any representation or warranty that it is accurate, complete or up to date. We accept no obligation to correct or update the information or opinions in it. Opinions expressed are subject to change without notice. No member of the Macquarie Group accepts any liability whatsoever for any direct, indirect, consequential or other loss arising from any use of this research and/or further communication in relation to this research. Clients should contact analysts at, and execute transactions through, a Macquarie Group entity in their home jurisdiction unless governing law permits otherwise.
Disclaimer: The information contained in this e-mail is confidential and has been furnished to you solely for your use. You may not disclose, reproduce or distribute the information in any way. Macquarie does not guarantee the integrity of this e-mail or attached files.
Macquarie Capital (USA) Inc. affiliate research reports and affiliate employees are not subject to the disclosure requirements of FINRA rules. Any persons receiving this report directly from Macquarie Capital (USA) Inc. and wishing to effect a transaction in any security described herein should do so with Macquarie Capital (USA) Inc. In Germany, this research is issued and/or distributed by Macquarie Capital (Europe) Limited, Niederlassung Deutschland, which is authorised and regulated by the UK Financial Conduct Authority and in Germany by BaFin.
Macquarie salespeople, traders and other professionals may provide oral or written market commentary or trading strategies to our clients that reflect opinions which are contrary to the opinions expressed in this research. Macquarie Research produces a variety of research products including, but not limited to, fundamental analysis, macro-economic analysis, quantitative analysis, and trade ideas. Recommendations contained in one type of research product may differ from recommendations contained in other types of research, whether as a result of differing time horizons, methodologies, or otherwise. Page 19<br>
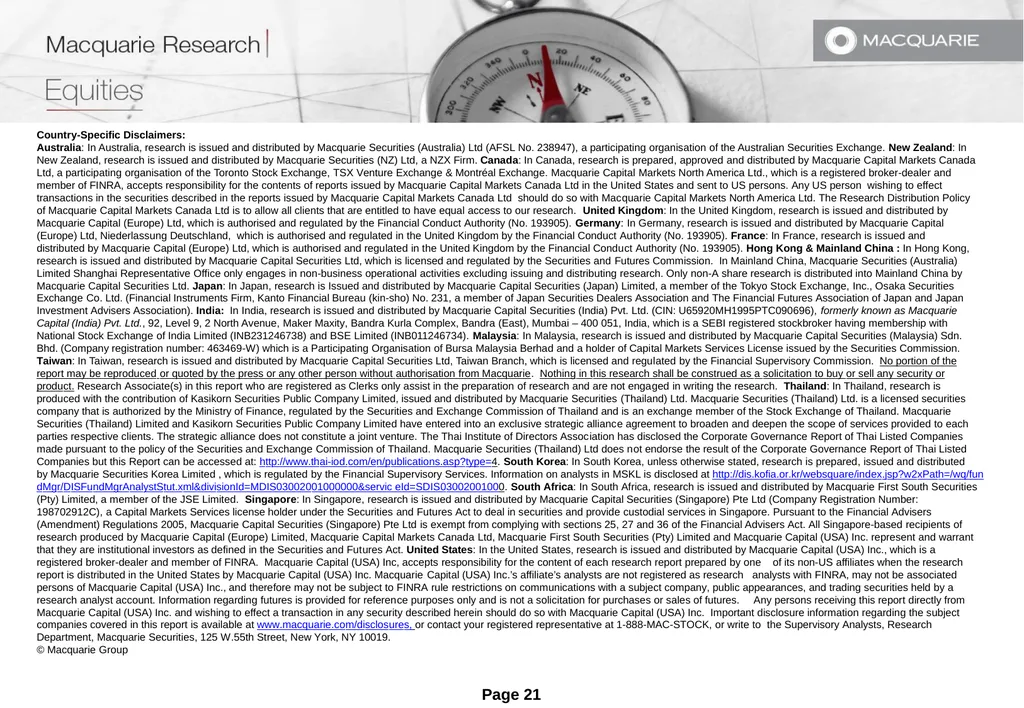
slide21. Country-Specific Disclaimers:
Australia: In Australia, research is issued and distributed by Macquarie Securities (Australia) Ltd (AFSL No. 238947), a participating organisation of the Australian Securities Exchange. New Zealand: In New Zealand, research is issued and distributed by Macquarie Securities (NZ) Ltd, a NZX Firm. Canada: In Canada, research is prepared, approved and distributed by Macquarie Capital Markets Canada Ltd, a participating organisation of the Toronto Stock Exchange, TSX Venture Exchange & Montréal Exchange. Macquarie Capital Markets North America Ltd., which is a registered broker-dealer and member of FINRA, accepts responsibility for the contents of reports issued by Macquarie Capital Markets Canada Ltd in the United States and sent to US persons. Any US person wishing to effect transactions in the securities described in the reports issued by Macquarie Capital Markets Canada Ltd should do so with Macquarie Capital Markets North America Ltd. The Research Distribution Policy of Macquarie Capital Markets Canada Ltd is to allow all clients that are entitled to have equal access to our research. United Kingdom: In the United Kingdom, research is issued and distributed by Macquarie Capital (Europe) Ltd, which is authorised and regulated by the Financial Conduct Authority (No. 193905). Germany: In Germany, research is issued and distributed by Macquarie Capital (Europe) Ltd, Niederlassung Deutschland, which is authorised and regulated in the United Kingdom by the Financial Conduct Authority (No. 193905). France: In France, research is issued and distributed by Macquarie Capital (Europe) Ltd, which is authorised and regulated in the United Kingdom by the Financial Conduct Authority (No. 193905). Hong Kong & Mainland China : In Hong Kong, research is issued and distributed by Macquarie Capital Securities Ltd, which is licensed and regulated by the Securities and Futures Commission. In Mainland China, Macquarie Securities (Australia) Limited Shanghai Representative Office only engages in non-business operational activities excluding issuing and distributing research. Only non-A share research is distributed into Mainland China by Macquarie Capital Securities Ltd. Japan: In Japan, research is Issued and distributed by Macquarie Capital Securities (Japan) Limited, a member of the Tokyo Stock Exchange, Inc., Osaka Securities Exchange Co. Ltd. (Financial Instruments Firm, Kanto Financial Bureau (kin-sho) No. 231, a member of Japan Securities Dealers Association and The Financial Futures Association of Japan and Japan Investment Advisers Association). India: In India, research is issued and distributed by Macquarie Capital Securities (India) Pvt. Ltd. (CIN: U65920MH1995PTC090696), formerly known as Macquarie Capital (India) Pvt. Ltd., 92, Level 9, 2 North Avenue, Maker Maxity, Bandra Kurla Complex, Bandra (East), Mumbai – 400 051, India, which is a SEBI registered stockbroker having membership with National Stock Exchange of India Limited (INB231246738) and BSE Limited (INB011246734). Malaysia: In Malaysia, research is issued and distributed by Macquarie Capital Securities (Malaysia) Sdn. Bhd. (Company registration number: 463469-W) which is a Participating Organisation of Bursa Malaysia Berhad and a holder of Capital Markets Services License issued by the Securities Commission. Taiwan: In Taiwan, research is issued and distributed by Macquarie Capital Securities Ltd, Taiwan Branch, which is licensed and regulated by the Financial Supervisory Commission. No portion of the report may be reproduced or quoted by the press or any other person without authorisation from Macquarie. Nothing in this research shall be construed as a solicitation to buy or sell any security or product. Research Associate(s) in this report who are registered as Clerks only assist in the preparation of research and are not engaged in writing the research. Thailand: In Thailand, research is produced with the contribution of Kasikorn Securities Public Company Limited, issued and distributed by Macquarie Securities (Thailand) Ltd. Macquarie Securities (Thailand) Ltd. is a licensed securities company that is authorized by the Ministry of Finance, regulated by the Securities and Exchange Commission of Thailand and is an exchange member of the Stock Exchange of Thailand. Macquarie Securities (Thailand) Limited and Kasikorn Securities Public Company Limited have entered into an exclusive strategic alliance agreement to broaden and deepen the scope of services provided to each parties respective clients. The strategic alliance does not constitute a joint venture. The Thai Institute of Directors Association has disclosed the Corporate Governance Report of Thai Listed Companies made pursuant to the policy of the Securities and Exchange Commission of Thailand. Macquarie Securities (Thailand) Ltd does not endorse the result of the Corporate Governance Report of Thai Listed Companies but this Report can be accessed at: http://www.thai-iod.com/en/publications.asp?type=4. South Korea: In South Korea, unless otherwise stated, research is prepared, issued and distributed by Macquarie Securities Korea Limited , which is regulated by the Financial Supervisory Services. Information on analysts in MSKL is disclosed at http://dis.kofia.or.kr/websquare/index.jsp?w2xPath=/wq/fundMgr/DISFundMgrAnalystStut.xml&divisionId=MDIS03002001000000&servic eId=SDIS03002001000. South Africa: In South Africa, research is issued and distributed by Macquarie First South Securities (Pty) Limited, a member of the JSE Limited. Singapore: In Singapore, research is issued and distributed by Macquarie Capital Securities (Singapore) Pte Ltd (Company Registration Number: 198702912C), a Capital Markets Services license holder under the Securities and Futures Act to deal in securities and provide custodial services in Singapore. Pursuant to the Financial Advisers (Amendment) Regulations 2005, Macquarie Capital Securities (Singapore) Pte Ltd is exempt from complying with sections 25, 27 and 36 of the Financial Advisers Act. All Singapore-based recipients of research produced by Macquarie Capital (Europe) Limited, Macquarie Capital Markets Canada Ltd, Macquarie First South Securities (Pty) Limited and Macquarie Capital (USA) Inc. represent and warrant that they are institutional investors as defined in the Securities and Futures Act. United States: In the United States, research is issued and distributed by Macquarie Capital (USA) Inc., which is a registered broker-dealer and member of FINRA. Macquarie Capital (USA) Inc, accepts responsibility for the content of each research report prepared by one of its non-US affiliates when the research report is distributed in the United States by Macquarie Capital (USA) Inc. Macquarie Capital (USA) Inc.’s affiliate’s analysts are not registered as research analysts with FINRA, may not be associated persons of Macquarie Capital (USA) Inc., and therefore may not be subject to FINRA rule restrictions on communications with a subject company, public appearances, and trading securities held by a research analyst account. Information regarding futures is provided for reference purposes only and is not a solicitation for purchases or sales of futures. Any persons receiving this report directly from Macquarie Capital (USA) Inc. and wishing to effect a transaction in any security described herein should do so with Macquarie Capital (USA) Inc. Important disclosure information regarding the subject companies covered in this report is available at www.macquarie.com/disclosures, or contact your registered representative at 1-888-MAC-STOCK, or write to the Supervisory Analysts, Research Department, Macquarie Securities, 125 W.55th Street, New York, NY 10019.
© Macquarie Group Page 19<br>
Macquarie Capital Securities (Malaysia) Sdn Bhd
+603 20598993
sunaina.dhanuka@macquarie.com
6th November 2014<br>
slide2. Summary of edible oils market last year Each of the Big-4 veg oils added inventory during 2013/14 Change in inventory
mt 6.0
5.0
4.0
3.0
2.0
1.0
-
-1.0
-2.0
-3.0 Source: Macquarie Research, October 2014 2008/09 2009/10 2010/11 2011/12 2012/13 2013/14 Soy oil Palm oil Rapeseed oil Sunseed oil Page 10<br>
slide3. Summary of edible oils market last year Just to give you an idea of rising palm oil inventories in Indonesia…
YoY increase in inventories of some of the Indonesian CPO producers Source: Company data, Macquarie Research, October 2014 18% -13% -13% -23% -41% 100%
67% 137% 33% -35% -57% -66% 11% 7% -29% -9% -8% -5% 32% -100% -50% 0% 50% 150% 1Q2013 2Q2013
Company A (integrated midstream) 3Q2013 4Q2013
Company B - pure CPO producer 1Q2014 2Q2014
Company C (integrated downstream) Page 10<br>
slide4. Summary of edible oils market last year Not only did the veg oils inventory rise, oilseeds inventory recovered as well, suggesting edible oils crush could stay high in 2014/15
Stock-to-usage ratios Source: USDA, Macquarie Research, October 2014 12.8% 11.0% 9.1% 7.8% 11.3% 25.6% 27.9% 20.8% 21.9% 24.5% 5.0%
0.0% 10.0% 15.0% 20.0% 25.0% 30.0% 09/10 10/11 11/12 12/13 13/14 Rapeseed Soybeans Page 10<br>
slide5. Summary of edible oils market last year Source: Bloomberg, Macquarie Research, October 2014 4-way ‘fight for demand’ narrowed spreads significantly
Veg oil prices (Rotterdam)
US$/t
1,350
1,250
1,150
1,050
950
850
750
650 Jan-13 Feb-13 Mar-13
Apr-13 May-13 Jun-13 Jul-13 Aug-13
Sep-13 Oct-13 Nov-13 Dec-13 Jan-14 Feb-14
Mar-14
Apr-14 May-14 Jun-14 Jul-14 Aug-14
Sep-14
Oct-14 Sun oil Rape oil Soy oil Palm oil Page 10<br>
slide6. Let’s look at supply for 2014/15… Small increase in rapeseed oil production, stagnation in sun oil production Rapeseed oil production Sunseed oil production Source: Oil World, Macquarie Research, October 2014 Source: Oil World, Macquarie Research, October 2014 19.6 21.4 23.8 23.7 24.4 25.1 26.2 26.8 mt 28.0
27.0
26.0
25.0
24.0
23.0
22.0
21.0
20.0
19.0 10.1 12.9 12.6 12.4 15.3 13.6 16.2 16.0 mt 17.0
16.0
15.0
14.0
13.0
12.0
11.0
10.0
9.0
8.0 Page 10<br>
slide7. Let’s look at supply in 2014/15… Soybeans – we expect South America to plant a big crop again
Question is how yields will perform; we believe they could disappoint Soybean-corn price ratio Source: Bloomberg, Macquarie Research, October 2014 3.90
3.50
3.10
2.70
2.30
1.90
1.50 Jan-05 Jul-05 Jan-06 Jul-06 Jan-07 Jul-07 Jan-08 Jul-08 Jan-09 Jul-09 Jan-10 Jul-10 Jan-11 Jul-11 Jan-12 Jul-12 Jan-13 Jul-13 Jan-14 Jul-14 Jan-15 Jul-15 Soybean-corn price ratio Avg +1 S.D -1 S.D. Page 10<br>
slide8. Palm oil supply
The seeds for the current bearish palm market were sown during 2005-11 Malaysia - New plantings (ha) Indonesia – New plantings (m ha) 250,000
200,000
150,000
100,000
50,000
0
Source: MPOB, Macquarie Research, November 2014 Source: BPS, Macquarie Research, November 2014 2000 2001 2002 2003 2004 2005 2006 2007 2008 2009 2010 2011 2012 2013 - Page 10 0.10 0.20 0.30 0.40 0.50 0.60 m ha 0.70 2000 2001 2002 2003 2004 2005 2006 2007 2008 2009 2010 2011 2012 2013<br>
slide9. Palm oil supply for 2014/15 However, the biological yield cycle for oil palm is about to turn negative -0.6 Page 10 -0.4 -0.2 0 0.2 0.4 0.6 Jan-00 Jan-01 Jan-02 Jan-03 Jan-04 Jan-05 Jan-06 Jan-07 Jan-08 Jan-09 Jan-10 Jan-11 Jan-12 Jan-13 Jan-14 tonnes / ha YoY change in Malaysia's FFB yield<br>
slide10. Now let’s look at demand for 2014/15 All the large consumers also added to their inventories over the past two years
If they were to just use this excess inventory in 2014/15, import requirements are unlikely to be higher despite consumption growth
Import requirements of key consumers Source: Macquarie Research, October 2014 8.3 10.3 11.3 0.6 1.2 0.3 7.5 9.7 11.4 0.0 2.0 6.0
4.0 8.0 10.0 12.0 EU China India FY13/14 net imports Increase in inventory (FY12-14) FY14/15E net Imports Page 10<br>
slide11. Can lower CPO price attract more demand? India hasn’t really benefitted significantly from lower CPO price due to
currency weakness
Olein – soy oil spread in China is very narrow
India CPO landed price Tianjin Olein - Soybean Oil Spread YTD price Source: Bloomberg, Macquarie Research, November 2014 Source: Bloomberg, Macquarie Research, November 2014 Page 11<br>
slide12. Other challenges for CPO next year Falling energy prices have narrowed biodiesel spread
Without a subsidy or strict implementation, Indonesia will find it difficult to reach its target in the short term
Palm Oil -Gas oil spread CPO(-)Gas oil
Source: Bloomberg, Macquarie Research, October 2014 Page 12 -69 600
500
400
300
200
100
-
-100
-200
-300
-400 Jan-08 Apr-08 Jul-08 Oct-08 Jan -09 Apr-09 Jul-09 Oct-09 Jan-10 Apr-10 Jul-10 Oct-10 Jan -11 Apr-11 Jul-11 Oct-11 Jan-12 Apr-12 Jul-12 Oct-12 Jan -13 Apr-13 Jul-13 Oct-13 Jan-14 Apr-14 Jul-14 Oct-14 US$/t<br>
slide13. Other challenges for CPO next year EU will start replacing biofuels quota with GHG reduction quota from 2015
PME could lose demand
Standard GHG emissions for biofuels Source: UFOP, RED 2009/28/EC, November 2014 Page 12<br>
slide14. What does this mean for palm oil exports If spreads stay narrow, no incentive to substitute aggressively into CPO
Palm oil exports by key markets Source: Bloomberg, Macquarie Research, November 2014 6.0 6.9 7.1 6.4 5.8
1.2 6.6
1.4 5.8
1.3 5.2
1.5 7.4 8.2 7.7 7.4 16.0 20.1 20.5 21.6 mt 50.0
45.0
40.0
35.0
30.0
25.0
20.0
15.0
10.0
5.0
- 2014/15E Page 12<br>
slide15. Putting everything together… Non-palm oil supply recovery is slowing down the demand for palm oil
Edible oils demand growth vs. supply growth Total edible oils demand growth Non-palm supply growth
Source: MPOB, USDA, Macquarie Research, November 2014 4.1% 4.4% 3.6% 3.0% 3.9% 4.2% 2.9% 3.2% 3.4%3.0% 0.0%
-0.5% 4.9% 2.7%2.7% 8.7% 7.2% 16.8% 2.9% 9.3% 7.0% 6.8% 4.1% 9.6% -1.7%
2013-14 2014-15E -5.0% 5.0% 10.0% 15.0% CAGR
20.0% 2001-05 2005-10 2010-12 2012-13 Palm oil demand growth Palm oil supply growth Page 12<br>
slide16. Putting everything together… Rise in inventories last year will likely prevent prices from rising significantly
Supply growth slowdown should however bring down inventories slightly
Upside for palm oil demand if it starts to discount itself more in the near term
Stock-to-usage ratio Source: MPOB, USDA, Macquarie Research, November 2014 20.0% 17.7% 15.4% 13.7% 14.8% 15.7% 16.4% 15.4% 17.2% 15.1% 16.2% 22.4% 30.8% 23.8% 26.7% 25.2% 12.4% 11.3% 10.1% 10.5% 11.2% 11.9% 11.2% 11.5% 11.6% 11.8% 12.4% 14.4% 14.3% 16.6% 15.8% 5.0%
0.0% 10.0% 15.0% 25.0% 30.0% 35.0% 00/01 01/02 02/03 03/04 04/05 05/06 06/07 07/08 08/09 09/10 10/11 11/12 12/13 13/14 14/15F CPO stock-to-usage Total edible oils stock-to-usage Page 12<br>
slide17. What it means for CPO prices In the near term, CPO price could pull back as recent supply squeeze has been on the soybean/meal side, edible oils still well supplied with rapeseed taking up the slack
Oil palm likely to enter into biological cycle slowdown soon which will limit production
We could also see impact on production next year from droughts earlier this year
Weak El Niño still a possibility
Come summer palm oil inventories could
start to fall and CPO prices rise
Low prices of oilseeds could start to limit supply growth until demand catches up, ultimately supporting prices higher -1.44 Last 3 months exports from key countries
- YoY change
1.68 0.06 -2.00 -1.00 -0.50 - 1.00 1.50 2.00 Soybeans Rapeseed Palm oil mt “You can make a small fortune in farming – provided you start with a large one”<br>
slide18. Our view CPO prices likely to average between
RM2,300 – 2,400 in 2015 1H15 prices likely to average about RM2,200
rising to over RM2,500 in 2H15<br>
slide19. Important disclosures: Recommendation proportions – For quarter ending 30 September 2014 Page 19<br>
slide20. Company-Specific Disclosures:
Important disclosure information regarding the subject companies covered in this report is available at www.macquarie.com/disclosures.
Analyst Certification:
The views expressed in this research accurately reflect the personal views of the analyst(s) about the subject securities or issuers and no part of the compensation of the analyst(s) was, is, or will be directly or indirectly related to the inclusion of specific recommendations or views in this research. The analyst principally responsible for the preparation of this research receives compensation based on overall revenues of Macquarie Group Ltd ABN 94 122 169 279 (AFSL No. 318062) (MGL) and its related entities (the Macquarie Group) and has taken reasonable care to achieve and maintain independence and objectivity in making any recommendations.
General Disclaimers:
Macquarie Securities (Australia) Ltd; Macquarie Capital (Europe) Ltd; Macquarie Capital Markets Canada Ltd; Macquarie Capital Markets North America Ltd; Macquarie Capital (USA) Inc; Macquarie Capital Securities Ltd and its Taiwan branch; Macquarie Capital Securities (Singapore) Pte Ltd; Macquarie Securities (NZ) Ltd; and Macquarie First South Securities (Pty) Limited; Macquarie Capital Securities (India) Pvt Ltd; Macquarie Capital Securities (Malaysia) Sdn Bhd; Macquarie Securities Korea Limited and Macquarie Securities (Thailand) Ltd are not authorized deposit-taking institutions for the purposes of the Banking Act 1959 (Commonwealth of Australia), and their obligations do not represent deposits or other liabilities of Macquarie Bank Limited ABN 46 008 583 542 (MBL) or MGL. MBL does not guarantee or otherwise provide assurance in respect of the obligations of any of the above mentioned entities. MGL provides a guarantee to the Monetary Authority of Singapore in respect of the obligations and liabilities of Macquarie Capital Securities (Singapore) Pte Ltd for up to SGD 35 million. This research has been prepared for the general use of the wholesale clients of the Macquarie Group and must not be copied, either in whole or in part, or distributed to any other person. If you are not the intended recipient you must not use or disclose the information in this research in any way. If you received it in error, please tell us immediately by return e-mail and delete the document. We do not guarantee the integrity of any e-mails or attached files and are not responsible for any changes made to them by any other person. MGL has established and implemented a conflicts policy at group level (which may be revised and updated from time to time) (the "Conflicts Policy") pursuant to regulatory requirements (including the FCA Rules) which sets out how we must seek to identify and manage all material conflicts of interest. Nothing in this research shall be construed as a solicitation to buy or sell any security or product, or to engage in or refrain from engaging in any transaction. In preparing this research, we did not take into account your investment objectives, financial situation or particular needs. Before making an investment decision on the basis of this research, you need to consider, with or without the assistance of an adviser, whether the advice is appropriate in light of your particular investment needs, objectives and financial circumstances. There are risks involved in securities trading. The price of securities can and does fluctuate, and an individual security may even become valueless. International investors are reminded of the additional risks inherent in international investments, such as currency fluctuations and international stock market or economic conditions, which may adversely affect the value of the investment. This research is based on information obtained from sources believed to be reliable but we do not make any representation or warranty that it is accurate, complete or up to date. We accept no obligation to correct or update the information or opinions in it. Opinions expressed are subject to change without notice. No member of the Macquarie Group accepts any liability whatsoever for any direct, indirect, consequential or other loss arising from any use of this research and/or further communication in relation to this research. Clients should contact analysts at, and execute transactions through, a Macquarie Group entity in their home jurisdiction unless governing law permits otherwise.
Disclaimer: The information contained in this e-mail is confidential and has been furnished to you solely for your use. You may not disclose, reproduce or distribute the information in any way. Macquarie does not guarantee the integrity of this e-mail or attached files.
Macquarie Capital (USA) Inc. affiliate research reports and affiliate employees are not subject to the disclosure requirements of FINRA rules. Any persons receiving this report directly from Macquarie Capital (USA) Inc. and wishing to effect a transaction in any security described herein should do so with Macquarie Capital (USA) Inc. In Germany, this research is issued and/or distributed by Macquarie Capital (Europe) Limited, Niederlassung Deutschland, which is authorised and regulated by the UK Financial Conduct Authority and in Germany by BaFin.
Macquarie salespeople, traders and other professionals may provide oral or written market commentary or trading strategies to our clients that reflect opinions which are contrary to the opinions expressed in this research. Macquarie Research produces a variety of research products including, but not limited to, fundamental analysis, macro-economic analysis, quantitative analysis, and trade ideas. Recommendations contained in one type of research product may differ from recommendations contained in other types of research, whether as a result of differing time horizons, methodologies, or otherwise. Page 19<br>
slide21. Country-Specific Disclaimers:
Australia: In Australia, research is issued and distributed by Macquarie Securities (Australia) Ltd (AFSL No. 238947), a participating organisation of the Australian Securities Exchange. New Zealand: In New Zealand, research is issued and distributed by Macquarie Securities (NZ) Ltd, a NZX Firm. Canada: In Canada, research is prepared, approved and distributed by Macquarie Capital Markets Canada Ltd, a participating organisation of the Toronto Stock Exchange, TSX Venture Exchange & Montréal Exchange. Macquarie Capital Markets North America Ltd., which is a registered broker-dealer and member of FINRA, accepts responsibility for the contents of reports issued by Macquarie Capital Markets Canada Ltd in the United States and sent to US persons. Any US person wishing to effect transactions in the securities described in the reports issued by Macquarie Capital Markets Canada Ltd should do so with Macquarie Capital Markets North America Ltd. The Research Distribution Policy of Macquarie Capital Markets Canada Ltd is to allow all clients that are entitled to have equal access to our research. United Kingdom: In the United Kingdom, research is issued and distributed by Macquarie Capital (Europe) Ltd, which is authorised and regulated by the Financial Conduct Authority (No. 193905). Germany: In Germany, research is issued and distributed by Macquarie Capital (Europe) Ltd, Niederlassung Deutschland, which is authorised and regulated in the United Kingdom by the Financial Conduct Authority (No. 193905). France: In France, research is issued and distributed by Macquarie Capital (Europe) Ltd, which is authorised and regulated in the United Kingdom by the Financial Conduct Authority (No. 193905). Hong Kong & Mainland China : In Hong Kong, research is issued and distributed by Macquarie Capital Securities Ltd, which is licensed and regulated by the Securities and Futures Commission. In Mainland China, Macquarie Securities (Australia) Limited Shanghai Representative Office only engages in non-business operational activities excluding issuing and distributing research. Only non-A share research is distributed into Mainland China by Macquarie Capital Securities Ltd. Japan: In Japan, research is Issued and distributed by Macquarie Capital Securities (Japan) Limited, a member of the Tokyo Stock Exchange, Inc., Osaka Securities Exchange Co. Ltd. (Financial Instruments Firm, Kanto Financial Bureau (kin-sho) No. 231, a member of Japan Securities Dealers Association and The Financial Futures Association of Japan and Japan Investment Advisers Association). India: In India, research is issued and distributed by Macquarie Capital Securities (India) Pvt. Ltd. (CIN: U65920MH1995PTC090696), formerly known as Macquarie Capital (India) Pvt. Ltd., 92, Level 9, 2 North Avenue, Maker Maxity, Bandra Kurla Complex, Bandra (East), Mumbai – 400 051, India, which is a SEBI registered stockbroker having membership with National Stock Exchange of India Limited (INB231246738) and BSE Limited (INB011246734). Malaysia: In Malaysia, research is issued and distributed by Macquarie Capital Securities (Malaysia) Sdn. Bhd. (Company registration number: 463469-W) which is a Participating Organisation of Bursa Malaysia Berhad and a holder of Capital Markets Services License issued by the Securities Commission. Taiwan: In Taiwan, research is issued and distributed by Macquarie Capital Securities Ltd, Taiwan Branch, which is licensed and regulated by the Financial Supervisory Commission. No portion of the report may be reproduced or quoted by the press or any other person without authorisation from Macquarie. Nothing in this research shall be construed as a solicitation to buy or sell any security or product. Research Associate(s) in this report who are registered as Clerks only assist in the preparation of research and are not engaged in writing the research. Thailand: In Thailand, research is produced with the contribution of Kasikorn Securities Public Company Limited, issued and distributed by Macquarie Securities (Thailand) Ltd. Macquarie Securities (Thailand) Ltd. is a licensed securities company that is authorized by the Ministry of Finance, regulated by the Securities and Exchange Commission of Thailand and is an exchange member of the Stock Exchange of Thailand. Macquarie Securities (Thailand) Limited and Kasikorn Securities Public Company Limited have entered into an exclusive strategic alliance agreement to broaden and deepen the scope of services provided to each parties respective clients. The strategic alliance does not constitute a joint venture. The Thai Institute of Directors Association has disclosed the Corporate Governance Report of Thai Listed Companies made pursuant to the policy of the Securities and Exchange Commission of Thailand. Macquarie Securities (Thailand) Ltd does not endorse the result of the Corporate Governance Report of Thai Listed Companies but this Report can be accessed at: http://www.thai-iod.com/en/publications.asp?type=4. South Korea: In South Korea, unless otherwise stated, research is prepared, issued and distributed by Macquarie Securities Korea Limited , which is regulated by the Financial Supervisory Services. Information on analysts in MSKL is disclosed at http://dis.kofia.or.kr/websquare/index.jsp?w2xPath=/wq/fundMgr/DISFundMgrAnalystStut.xml&divisionId=MDIS03002001000000&servic eId=SDIS03002001000. South Africa: In South Africa, research is issued and distributed by Macquarie First South Securities (Pty) Limited, a member of the JSE Limited. Singapore: In Singapore, research is issued and distributed by Macquarie Capital Securities (Singapore) Pte Ltd (Company Registration Number: 198702912C), a Capital Markets Services license holder under the Securities and Futures Act to deal in securities and provide custodial services in Singapore. Pursuant to the Financial Advisers (Amendment) Regulations 2005, Macquarie Capital Securities (Singapore) Pte Ltd is exempt from complying with sections 25, 27 and 36 of the Financial Advisers Act. All Singapore-based recipients of research produced by Macquarie Capital (Europe) Limited, Macquarie Capital Markets Canada Ltd, Macquarie First South Securities (Pty) Limited and Macquarie Capital (USA) Inc. represent and warrant that they are institutional investors as defined in the Securities and Futures Act. United States: In the United States, research is issued and distributed by Macquarie Capital (USA) Inc., which is a registered broker-dealer and member of FINRA. Macquarie Capital (USA) Inc, accepts responsibility for the content of each research report prepared by one of its non-US affiliates when the research report is distributed in the United States by Macquarie Capital (USA) Inc. Macquarie Capital (USA) Inc.’s affiliate’s analysts are not registered as research analysts with FINRA, may not be associated persons of Macquarie Capital (USA) Inc., and therefore may not be subject to FINRA rule restrictions on communications with a subject company, public appearances, and trading securities held by a research analyst account. Information regarding futures is provided for reference purposes only and is not a solicitation for purchases or sales of futures. Any persons receiving this report directly from Macquarie Capital (USA) Inc. and wishing to effect a transaction in any security described herein should do so with Macquarie Capital (USA) Inc. Important disclosure information regarding the subject companies covered in this report is available at www.macquarie.com/disclosures, or contact your registered representative at 1-888-MAC-STOCK, or write to the Supervisory Analysts, Research Department, Macquarie Securities, 125 W.55th Street, New York, NY 10019.
© Macquarie Group Page 19<br>