Lesson 3.3 Linear Functions Warm-Up Plot the
Description: Lesson 3.3 Linear Functions Warm-Up Plot the coordinates from the table in a coordinate plane. Connect them with a line or smooth curve. Learning Target: Identify and graph linear functions. Success Criteria: I can identify linear functions
Related Topics
Download Presentation
"Lesson 3.3 Linear Functions Warm-Up Plot the" is the property of its rightful owner. Permission is granted to download and print the materials on this website for personal, non-commercial use only, and to display it on your personal computer provided you do not modify the materials and that you retain all copyright notices contained in the materials. By downloading content from our website, you accept the terms of this agreement.
Presentation Transcript
slide1. Lesson 3.3 Linear Functions<br>
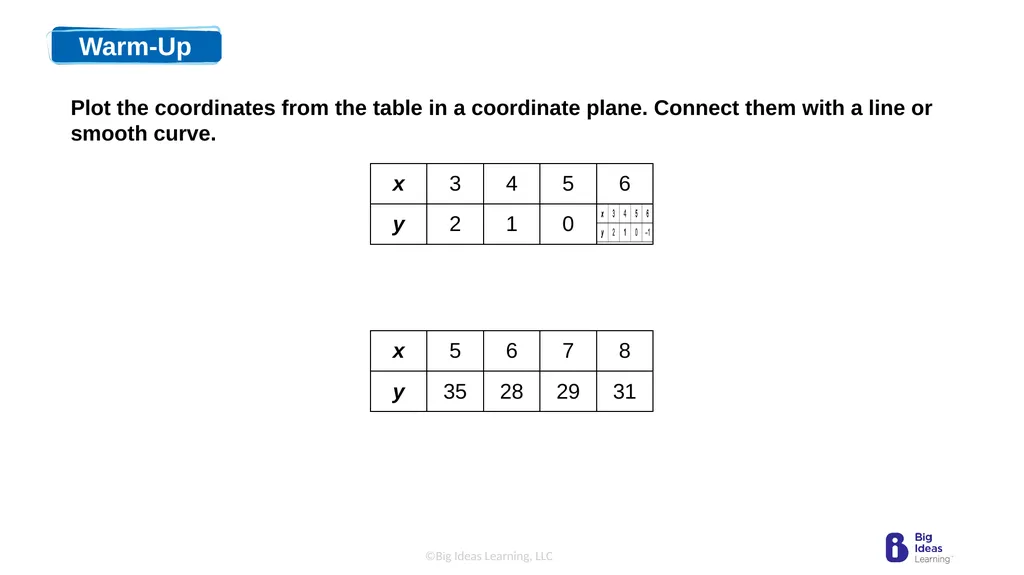
slide2. Warm-Up Plot the coordinates from the table in a coordinate plane. Connect them with a line or smooth curve.<br>
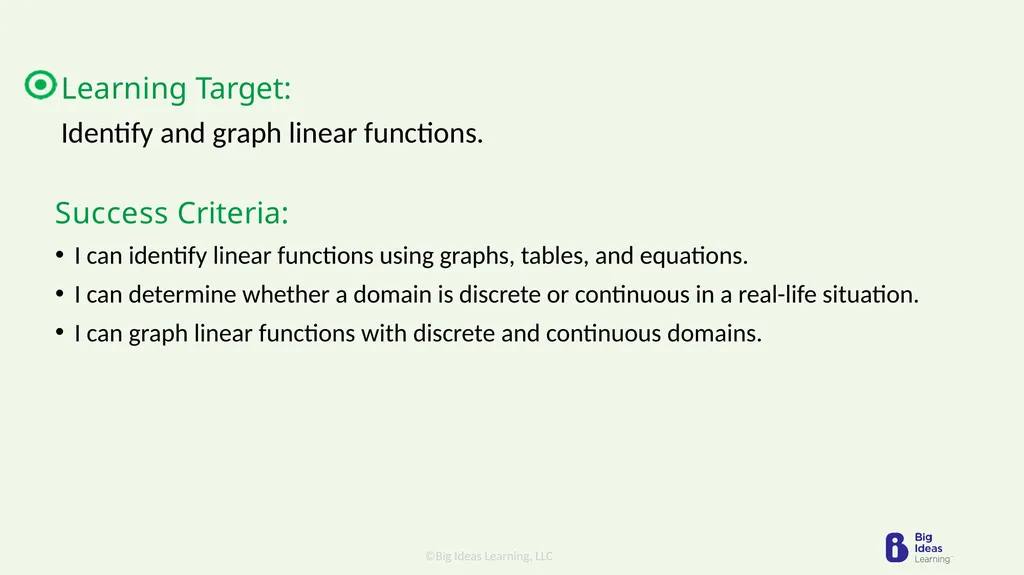
slide3. Learning Target:
Identify and graph linear functions. Success Criteria:
I can identify linear functions using graphs, tables, and equations.
I can determine whether a domain is discrete or continuous in a real-life situation.
I can graph linear functions with discrete and continuous domains.<br>
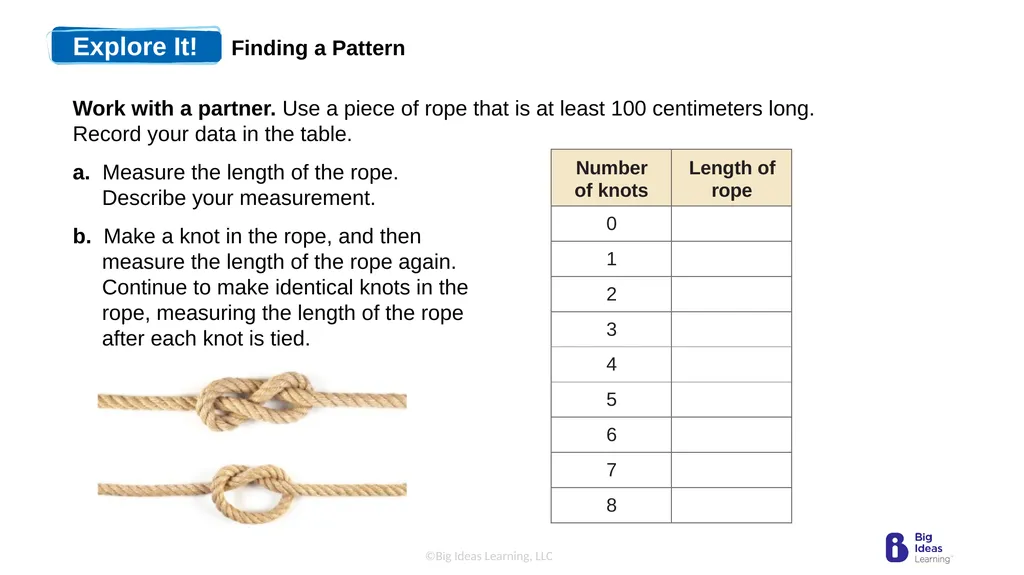
slide4. Explore It! Finding a Pattern Work with a partner. Use a piece of rope that is at least 100 centimeters long. Record your data in the table.
a. Measure the length of the rope. Describe your measurement.
b. Make a knot in the rope, and then measure the length of the rope again. Continue to make identical knots in the rope, measuring the length of the rope after each knot is tied.<br>
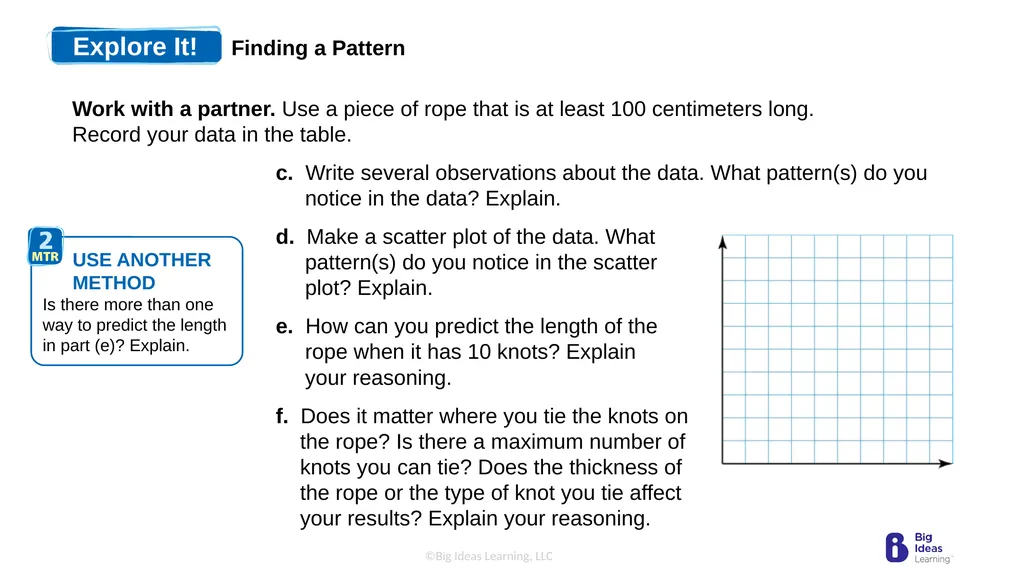
slide5. Explore It! Finding a Pattern c. Write several observations about the data. What pattern(s) do you notice in the data? Explain.
d. Make a scatter plot of the data. What pattern(s) do you notice in the scatter plot? Explain.
e. How can you predict the length of the rope when it has 10 knots? Explain your reasoning.
f. Does it matter where you tie the knots on the rope? Is there a maximum number of knots you can tie? Does the thickness of the rope or the type of knot you tie affect your results? Explain your reasoning. Work with a partner. Use a piece of rope that is at least 100 centimeters long. Record your data in the table.<br>
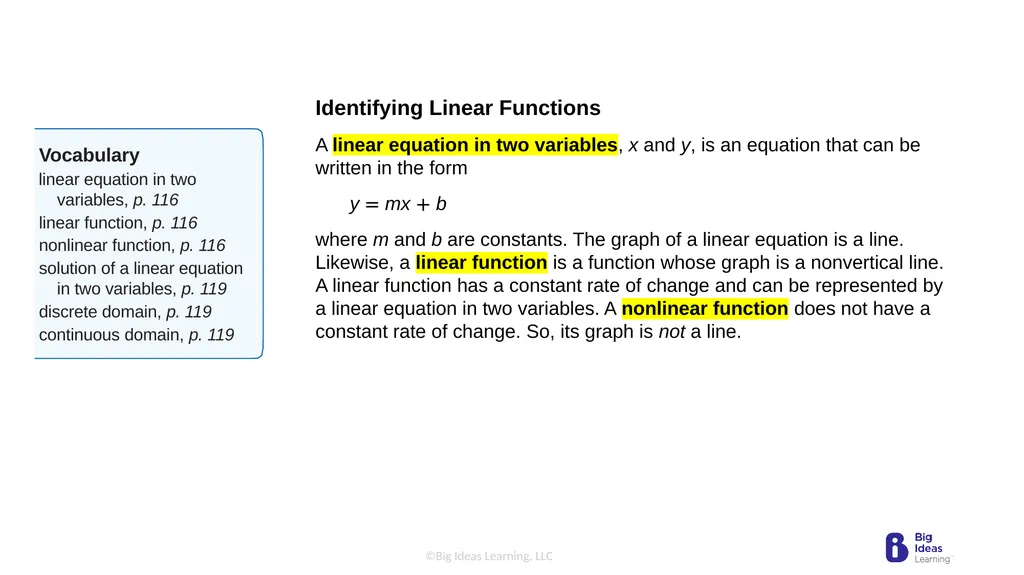
slide6. Identifying Linear Functions
A linear equation in two variables, x and y, is an equation that can be written in the form
y = mx + b
where m and b are constants. The graph of a linear equation is a line. Likewise, a linear function is a function whose graph is a nonvertical line. A linear function has a constant rate of change and can be represented by a linear equation in two variables. A nonlinear function does not have a constant rate of change. So, its graph is not a line.<br>
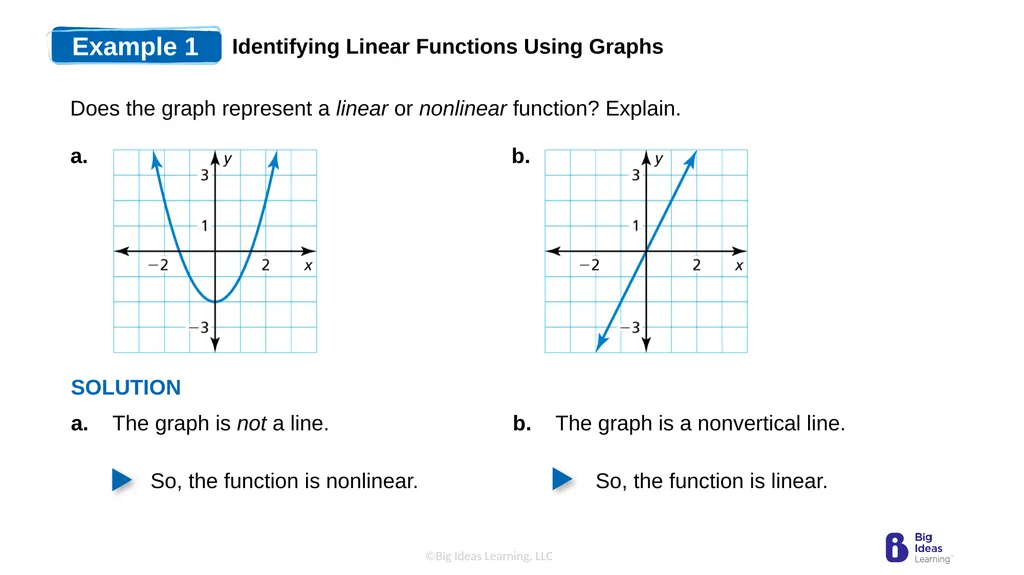
slide7. Example 1 Identifying Linear Functions Using Graphs Does the graph represent a linear or nonlinear function? Explain. a. The graph is not a line. a. b. The graph is a nonvertical line. So, the function is nonlinear. So, the function is linear. b. SOLUTION<br>
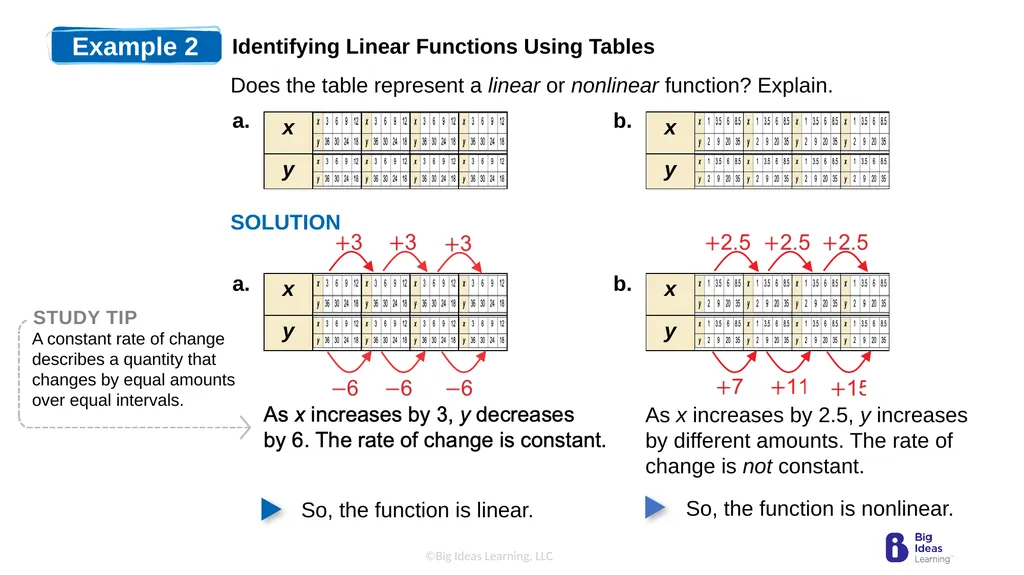
slide8. Example 2 Identifying Linear Functions Using Tables Does the table represent a linear or nonlinear function? Explain. a. b. a. b. As x increases by 2.5, y increases by different amounts. The rate of change is not constant. SOLUTION<br>
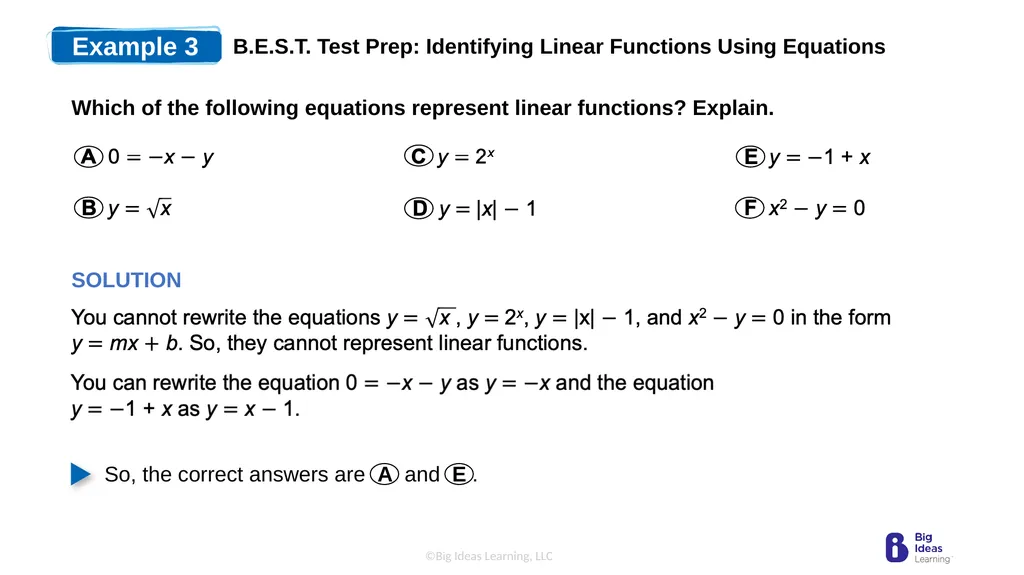
slide9. Example 3 B.E.S.T. Test Prep: Identifying Linear Functions Using Equations Which of the following equations represent linear functions? Explain. SOLUTION So, the correct answers are A and E .<br>
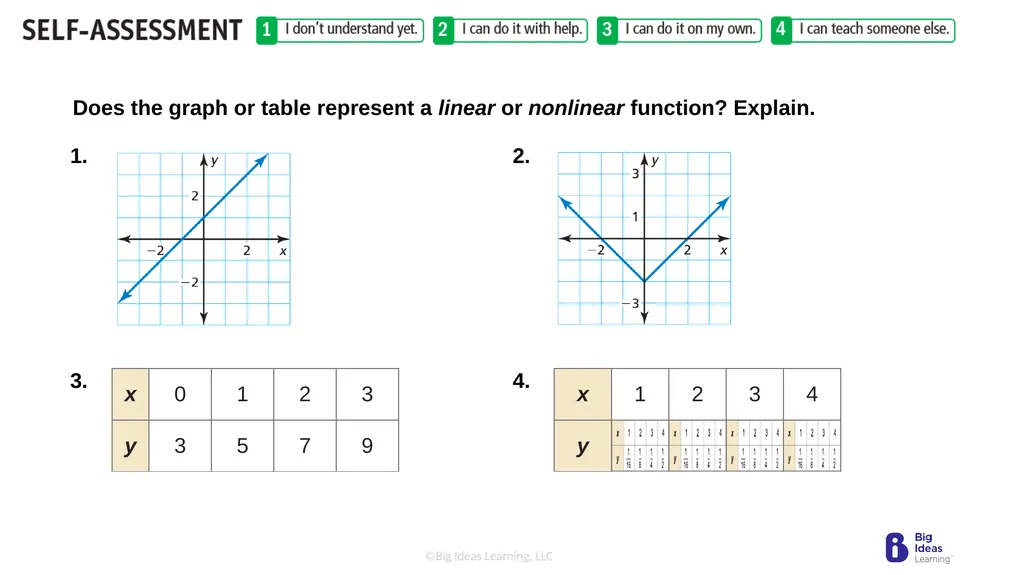
slide10. Does the graph or table represent a linear or nonlinear function? Explain. 1. 2. 3. 4.<br>
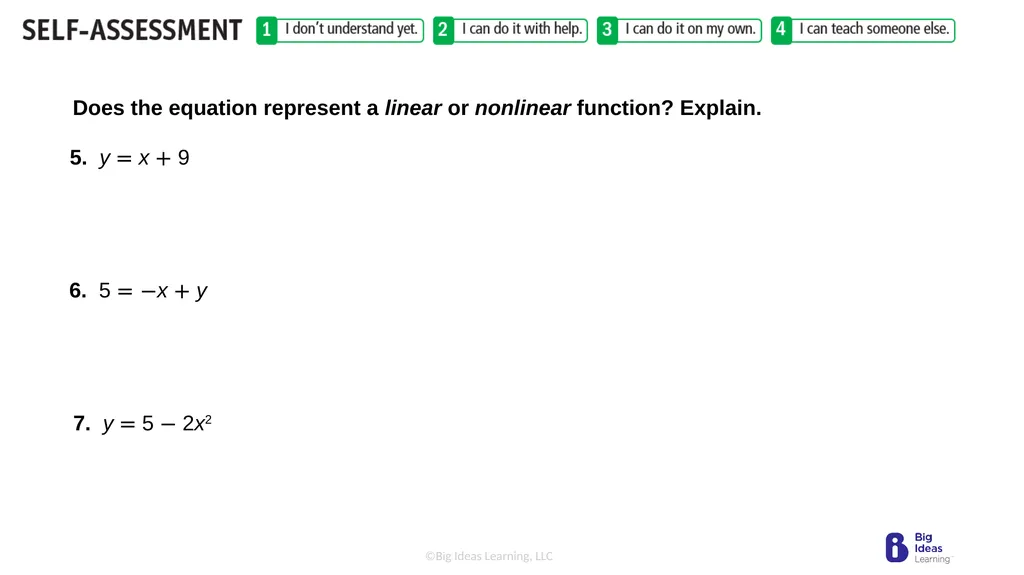
slide11. Does the equation represent a linear or nonlinear function? Explain. 5. y = x + 9 6. 5 = −x + y 7. y = 5 − 2x2<br>
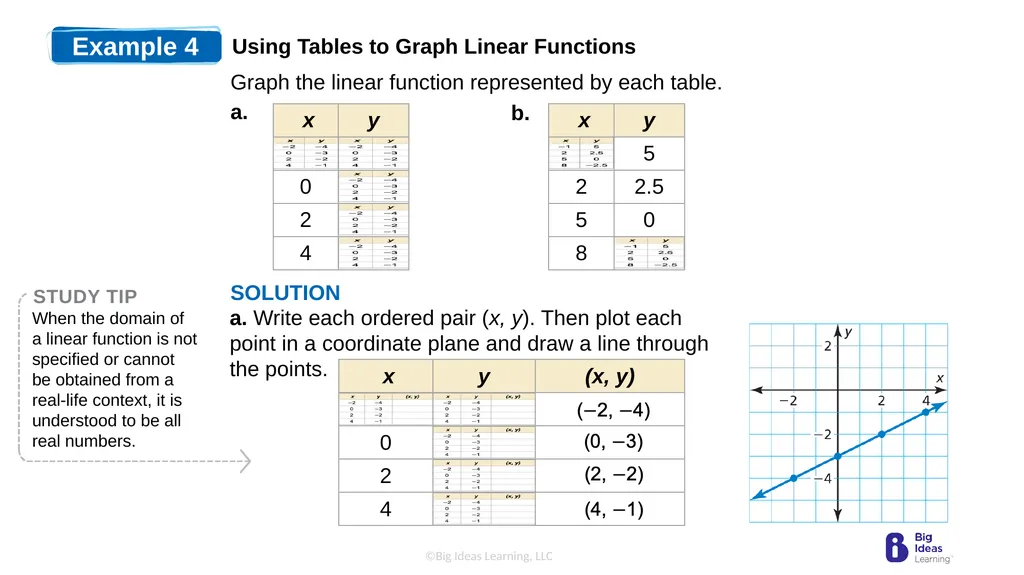
slide12. Example 4 Using Tables to Graph Linear Functions Graph the linear function represented by each table. SOLUTION a. Write each ordered pair (x, y). Then plot each point in a coordinate plane and draw a line through the points. a. b.<br>
slide13. Example 4 Using Tables to Graph Linear Functions CONTRUCT AN ARGUMENT
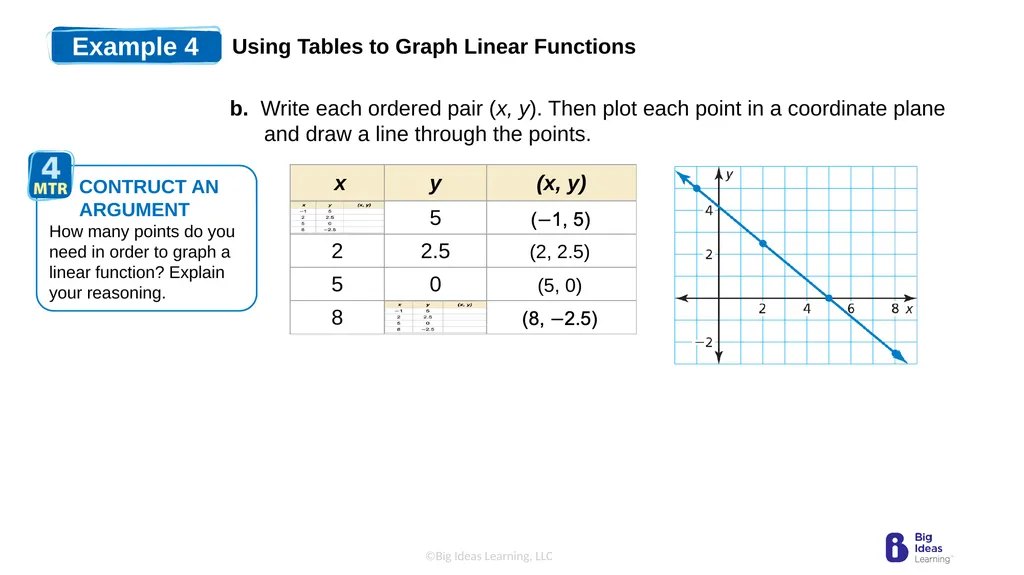
How many points do you need in order to graph a linear function? Explain your reasoning. b. Write each ordered pair (x, y). Then plot each point in a coordinate plane and draw a line through the points. (2, 2.5) (5, 0)<br>
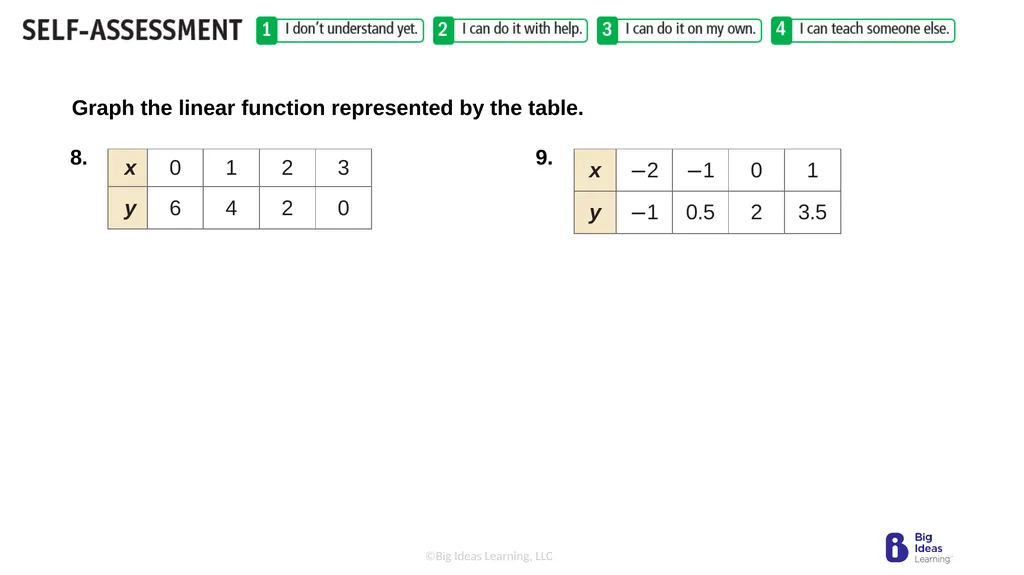
slide14. Graph the linear function represented by the table. 8. 9.<br>
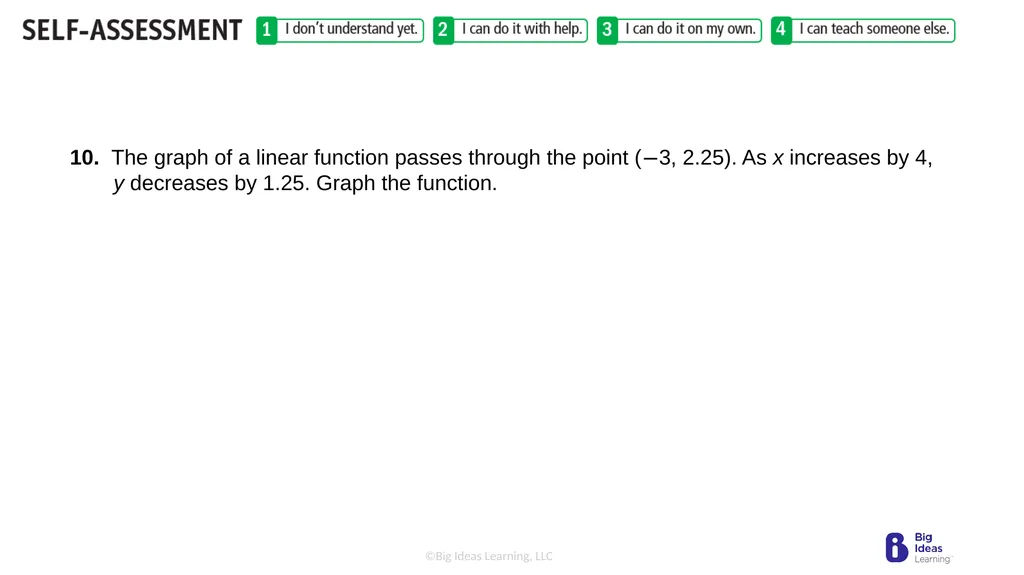
slide15. 10. The graph of a linear function passes through the point (−3, 2.25). As x increases by 4, y decreases by 1.25. Graph the function.<br>
slide16. A solution of a linear equation in two variables is an ordered pair (x, y) that makes the equation true. The graph of a linear equation in two variables is the set of points (x, y) in a coordinate plane that represents all solutions of the equation. Sometimes the points are distinct, and other times the points are connected.<br>
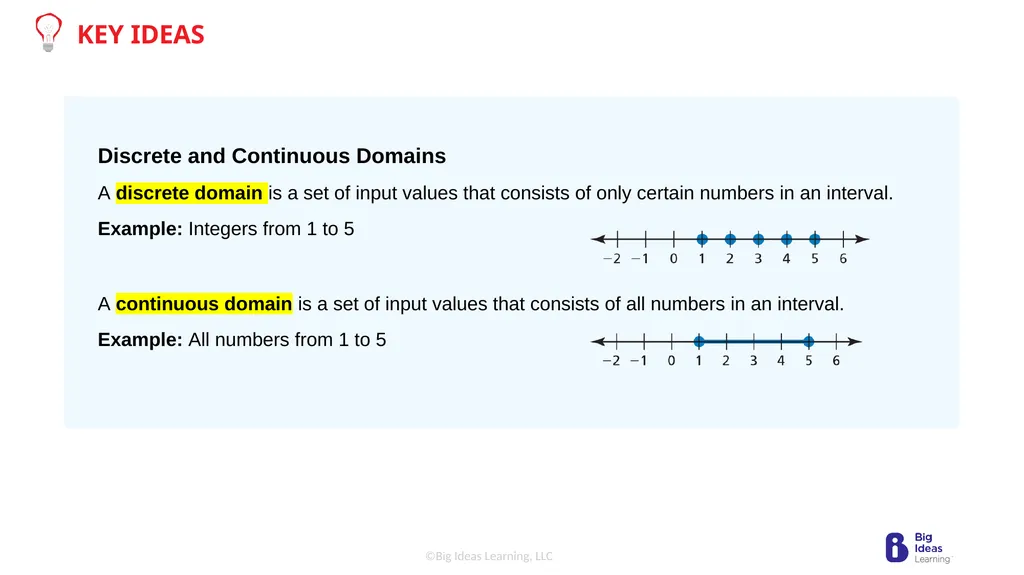
slide17. KEY IDEAS<br>
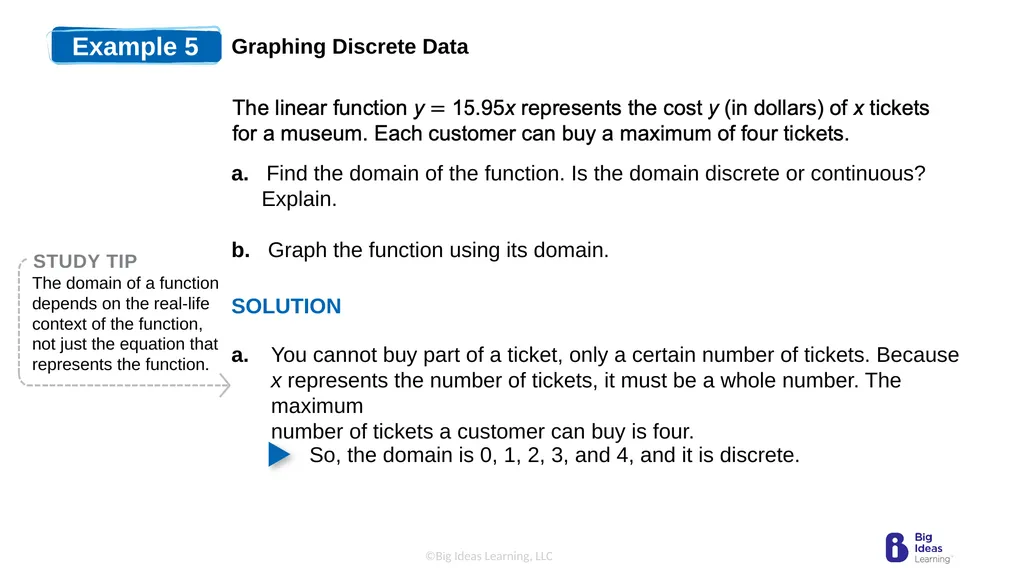
slide18. Example 5 Graphing Discrete Data SOLUTION a. Find the domain of the function. Is the domain discrete or continuous? Explain.
b. Graph the function using its domain.<br>

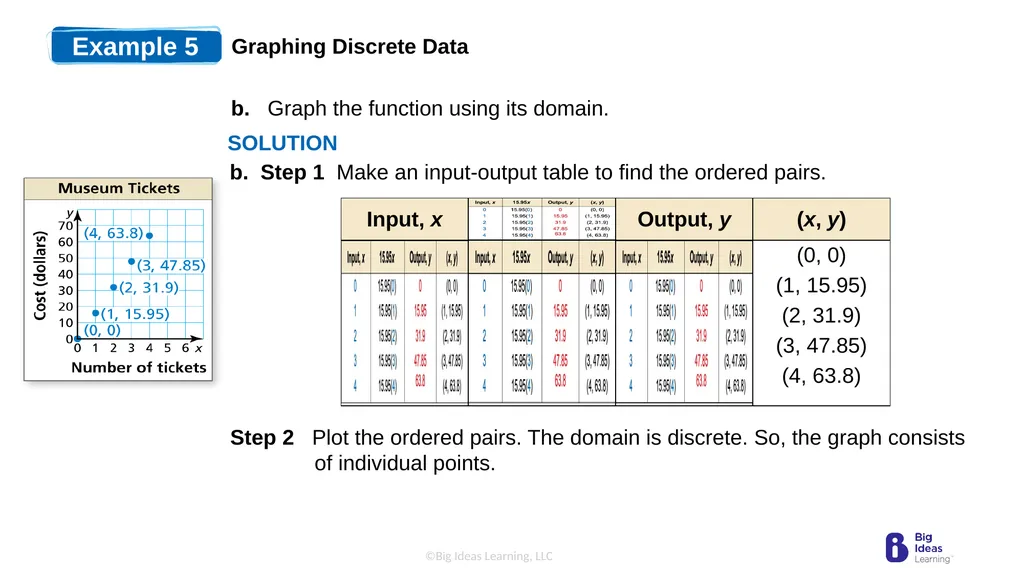
slide19. Example 5 Graphing Discrete Data b. Step 1 Make an input-output table to find the ordered pairs. Step 2 Plot the ordered pairs. The domain is discrete. So, the graph consists of individual points. b. Graph the function using its domain. SOLUTION<br>
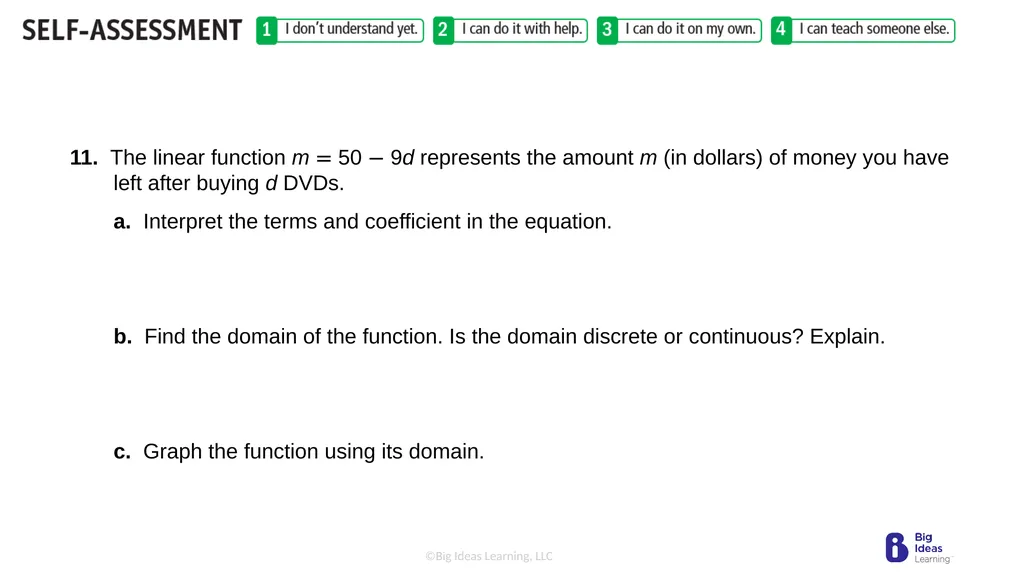
slide20. 11. The linear function m = 50 − 9d represents the amount m (in dollars) of money you have left after buying d DVDs.
a. Interpret the terms and coefficient in the equation.
b. Find the domain of the function. Is the domain discrete or continuous? Explain.
c. Graph the function using its domain.<br>
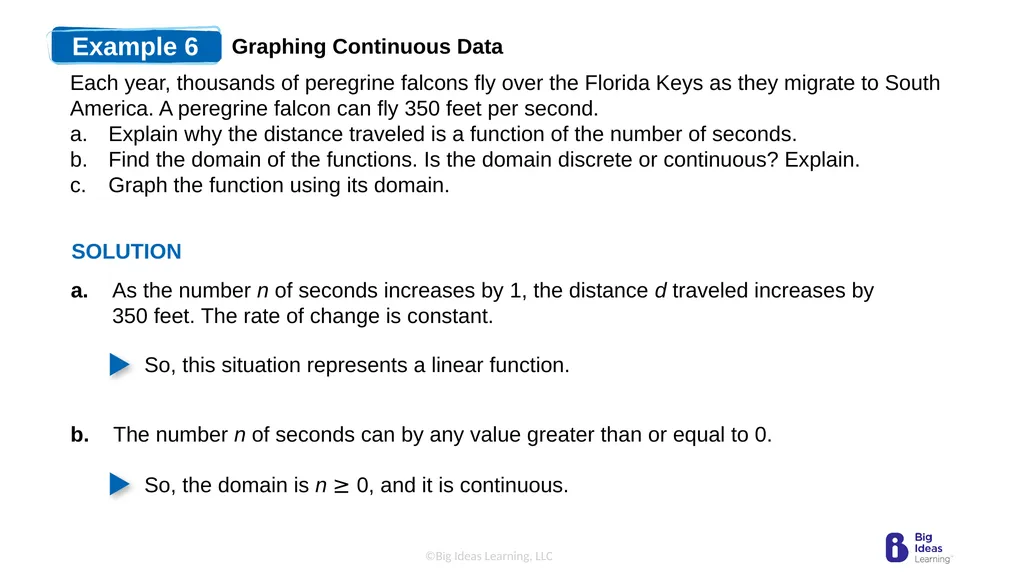
slide21. Example 6 Graphing Continuous Data Each year, thousands of peregrine falcons fly over the Florida Keys as they migrate to South America. A peregrine falcon can fly 350 feet per second.
Explain why the distance traveled is a function of the number of seconds.
Find the domain of the functions. Is the domain discrete or continuous? Explain.
Graph the function using its domain. SOLUTION So, this situation represents a linear function. So, the domain is n ≥ 0, and it is continuous. a. As the number n of seconds increases by 1, the distance d traveled increases by
350 feet. The rate of change is constant. b. The number n of seconds can by any value greater than or equal to 0.<br>
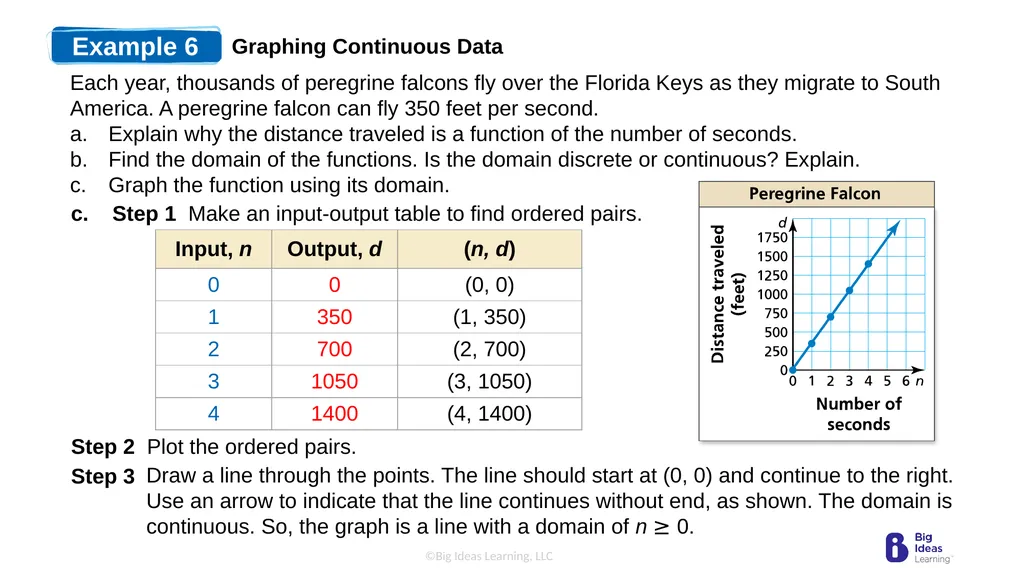
slide22. Example 6 Graphing Continuous Data c. Step 1 Make an input-output table to find ordered pairs. Step 2 Plot the ordered pairs. Draw a line through the points. The line should start at (0, 0) and continue to the right. Use an arrow to indicate that the line continues without end, as shown. The domain is continuous. So, the graph is a line with a domain of n ≥ 0. Step 3 Each year, thousands of peregrine falcons fly over the Florida Keys as they migrate to South America. A peregrine falcon can fly 350 feet per second.
Explain why the distance traveled is a function of the number of seconds.
Find the domain of the functions. Is the domain discrete or continuous? Explain.
Graph the function using its domain.<br>
slide23. 12. A 20-gallon bathtub is draining at a rate of 2.5 gallons per minute.
a. Explain why the number of gallons remaining is a function of the number of minutes.
b. Find the domain of the function. Is the domain discrete or continuous? Explain.
c. Graph the function using its domain.<br>
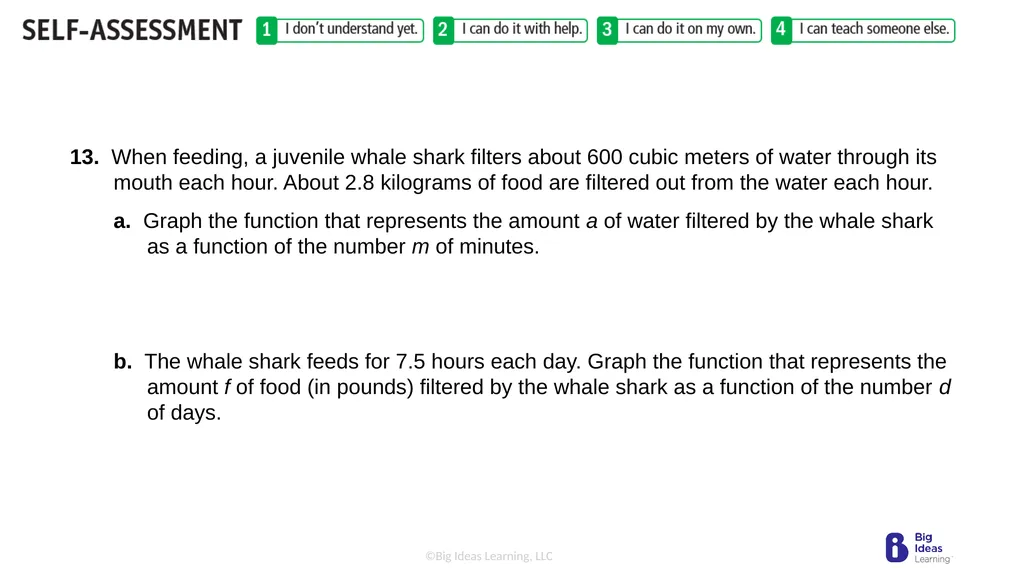
slide24. 13. When feeding, a juvenile whale shark filters about 600 cubic meters of water through its mouth each hour. About 2.8 kilograms of food are filtered out from the water each hour.
a. Graph the function that represents the amount a of water filtered by the whale shark as a function of the number m of minutes.
b. The whale shark feeds for 7.5 hours each day. Graph the function that represents the amount f of food (in pounds) filtered by the whale shark as a function of the number d of days.<br>
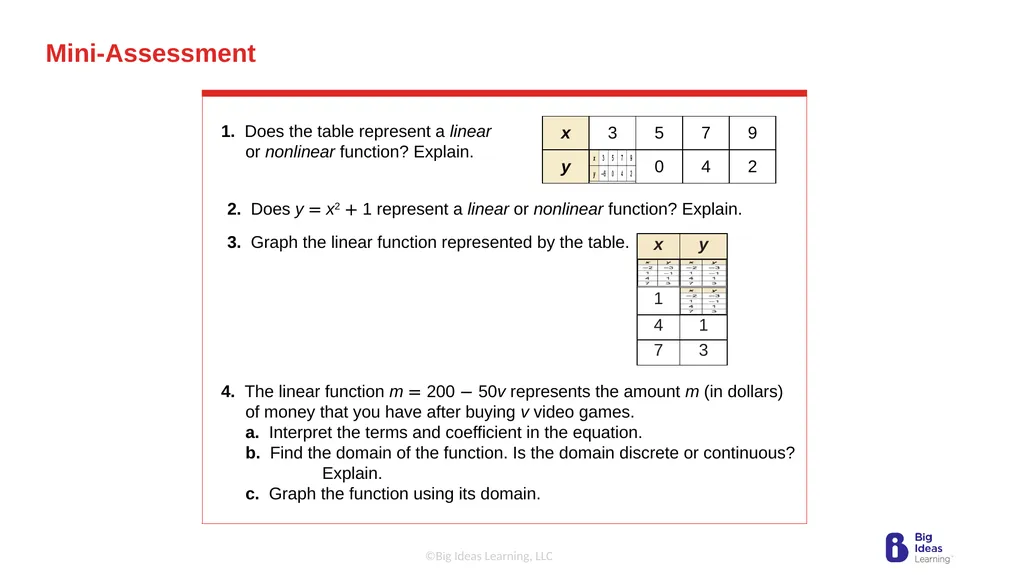
slide25. In-Class Practice Mini-Assessment 1. Does the table represent a linear or nonlinear function? Explain. 2. Does y = x2 + 1 represent a linear or nonlinear function? Explain.
3. Graph the linear function represented by the table. 4. The linear function m = 200 − 50v represents the amount m (in dollars) of money that you have after buying v video games.a. Interpret the terms and coefficient in the equation.b. Find the domain of the function. Is the domain discrete or continuous? Explain.c. Graph the function using its domain.<br>
slide2. Warm-Up Plot the coordinates from the table in a coordinate plane. Connect them with a line or smooth curve.<br>
slide3. Learning Target:
Identify and graph linear functions. Success Criteria:
I can identify linear functions using graphs, tables, and equations.
I can determine whether a domain is discrete or continuous in a real-life situation.
I can graph linear functions with discrete and continuous domains.<br>
slide4. Explore It! Finding a Pattern Work with a partner. Use a piece of rope that is at least 100 centimeters long. Record your data in the table.
a. Measure the length of the rope. Describe your measurement.
b. Make a knot in the rope, and then measure the length of the rope again. Continue to make identical knots in the rope, measuring the length of the rope after each knot is tied.<br>
slide5. Explore It! Finding a Pattern c. Write several observations about the data. What pattern(s) do you notice in the data? Explain.
d. Make a scatter plot of the data. What pattern(s) do you notice in the scatter plot? Explain.
e. How can you predict the length of the rope when it has 10 knots? Explain your reasoning.
f. Does it matter where you tie the knots on the rope? Is there a maximum number of knots you can tie? Does the thickness of the rope or the type of knot you tie affect your results? Explain your reasoning. Work with a partner. Use a piece of rope that is at least 100 centimeters long. Record your data in the table.<br>
slide6. Identifying Linear Functions
A linear equation in two variables, x and y, is an equation that can be written in the form
y = mx + b
where m and b are constants. The graph of a linear equation is a line. Likewise, a linear function is a function whose graph is a nonvertical line. A linear function has a constant rate of change and can be represented by a linear equation in two variables. A nonlinear function does not have a constant rate of change. So, its graph is not a line.<br>
slide7. Example 1 Identifying Linear Functions Using Graphs Does the graph represent a linear or nonlinear function? Explain. a. The graph is not a line. a. b. The graph is a nonvertical line. So, the function is nonlinear. So, the function is linear. b. SOLUTION<br>
slide8. Example 2 Identifying Linear Functions Using Tables Does the table represent a linear or nonlinear function? Explain. a. b. a. b. As x increases by 2.5, y increases by different amounts. The rate of change is not constant. SOLUTION<br>
slide9. Example 3 B.E.S.T. Test Prep: Identifying Linear Functions Using Equations Which of the following equations represent linear functions? Explain. SOLUTION So, the correct answers are A and E .<br>
slide10. Does the graph or table represent a linear or nonlinear function? Explain. 1. 2. 3. 4.<br>
slide11. Does the equation represent a linear or nonlinear function? Explain. 5. y = x + 9 6. 5 = −x + y 7. y = 5 − 2x2<br>
slide12. Example 4 Using Tables to Graph Linear Functions Graph the linear function represented by each table. SOLUTION a. Write each ordered pair (x, y). Then plot each point in a coordinate plane and draw a line through the points. a. b.<br>
slide13. Example 4 Using Tables to Graph Linear Functions CONTRUCT AN ARGUMENT
How many points do you need in order to graph a linear function? Explain your reasoning. b. Write each ordered pair (x, y). Then plot each point in a coordinate plane and draw a line through the points. (2, 2.5) (5, 0)<br>
slide14. Graph the linear function represented by the table. 8. 9.<br>
slide15. 10. The graph of a linear function passes through the point (−3, 2.25). As x increases by 4, y decreases by 1.25. Graph the function.<br>
slide16. A solution of a linear equation in two variables is an ordered pair (x, y) that makes the equation true. The graph of a linear equation in two variables is the set of points (x, y) in a coordinate plane that represents all solutions of the equation. Sometimes the points are distinct, and other times the points are connected.<br>
slide17. KEY IDEAS<br>
slide18. Example 5 Graphing Discrete Data SOLUTION a. Find the domain of the function. Is the domain discrete or continuous? Explain.
b. Graph the function using its domain.<br>
slide19. Example 5 Graphing Discrete Data b. Step 1 Make an input-output table to find the ordered pairs. Step 2 Plot the ordered pairs. The domain is discrete. So, the graph consists of individual points. b. Graph the function using its domain. SOLUTION<br>
slide20. 11. The linear function m = 50 − 9d represents the amount m (in dollars) of money you have left after buying d DVDs.
a. Interpret the terms and coefficient in the equation.
b. Find the domain of the function. Is the domain discrete or continuous? Explain.
c. Graph the function using its domain.<br>
slide21. Example 6 Graphing Continuous Data Each year, thousands of peregrine falcons fly over the Florida Keys as they migrate to South America. A peregrine falcon can fly 350 feet per second.
Explain why the distance traveled is a function of the number of seconds.
Find the domain of the functions. Is the domain discrete or continuous? Explain.
Graph the function using its domain. SOLUTION So, this situation represents a linear function. So, the domain is n ≥ 0, and it is continuous. a. As the number n of seconds increases by 1, the distance d traveled increases by
350 feet. The rate of change is constant. b. The number n of seconds can by any value greater than or equal to 0.<br>
slide22. Example 6 Graphing Continuous Data c. Step 1 Make an input-output table to find ordered pairs. Step 2 Plot the ordered pairs. Draw a line through the points. The line should start at (0, 0) and continue to the right. Use an arrow to indicate that the line continues without end, as shown. The domain is continuous. So, the graph is a line with a domain of n ≥ 0. Step 3 Each year, thousands of peregrine falcons fly over the Florida Keys as they migrate to South America. A peregrine falcon can fly 350 feet per second.
Explain why the distance traveled is a function of the number of seconds.
Find the domain of the functions. Is the domain discrete or continuous? Explain.
Graph the function using its domain.<br>
slide23. 12. A 20-gallon bathtub is draining at a rate of 2.5 gallons per minute.
a. Explain why the number of gallons remaining is a function of the number of minutes.
b. Find the domain of the function. Is the domain discrete or continuous? Explain.
c. Graph the function using its domain.<br>
slide24. 13. When feeding, a juvenile whale shark filters about 600 cubic meters of water through its mouth each hour. About 2.8 kilograms of food are filtered out from the water each hour.
a. Graph the function that represents the amount a of water filtered by the whale shark as a function of the number m of minutes.
b. The whale shark feeds for 7.5 hours each day. Graph the function that represents the amount f of food (in pounds) filtered by the whale shark as a function of the number d of days.<br>
slide25. In-Class Practice Mini-Assessment 1. Does the table represent a linear or nonlinear function? Explain. 2. Does y = x2 + 1 represent a linear or nonlinear function? Explain.
3. Graph the linear function represented by the table. 4. The linear function m = 200 − 50v represents the amount m (in dollars) of money that you have after buying v video games.a. Interpret the terms and coefficient in the equation.b. Find the domain of the function. Is the domain discrete or continuous? Explain.c. Graph the function using its domain.<br>