
National Multidimensional Poverty Index (NMPI) 1

Description: National Multidimensional Poverty Index (NMPI) 1 Multidimensional Poverty Analysis Presented by P.M.P.Anura Kumara Additional Director General Department of Census Statistics Sri Lanka In Collaboration with OPHI and DCS An MPI reflects
Related Topics
Download Presentation
"National Multidimensional Poverty Index (NMPI) 1" is the property of its rightful owner. Permission is granted to download and print the materials on this website for personal, non-commercial use only, and to display it on your personal computer provided you do not modify the materials and that you retain all copyright notices contained in the materials. By downloading content from our website, you accept the terms of this agreement.
Presentation Transcript
slide1. National Multidimensional Poverty Index (NMPI) 1 Multidimensional Poverty Analysis Presented by
P.M.P.Anura Kumara
Additional Director General
Department of Census & Statistics
Sri Lanka In Collaboration with OPHI and DCS<br>
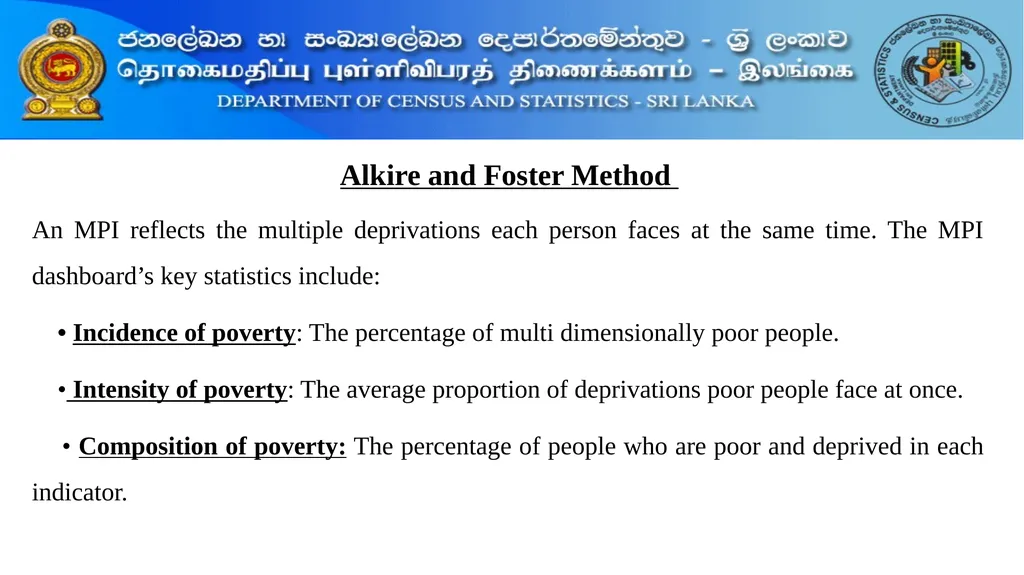
slide3. An MPI reflects the multiple deprivations each person faces at the same time. The MPI dashboard’s key statistics include:
• Incidence of poverty: The percentage of multi dimensionally poor people.
• Intensity of poverty: The average proportion of deprivations poor people face at once.
• Composition of poverty: The percentage of people who are poor and deprived in each indicator. Alkire and Foster Method<br>
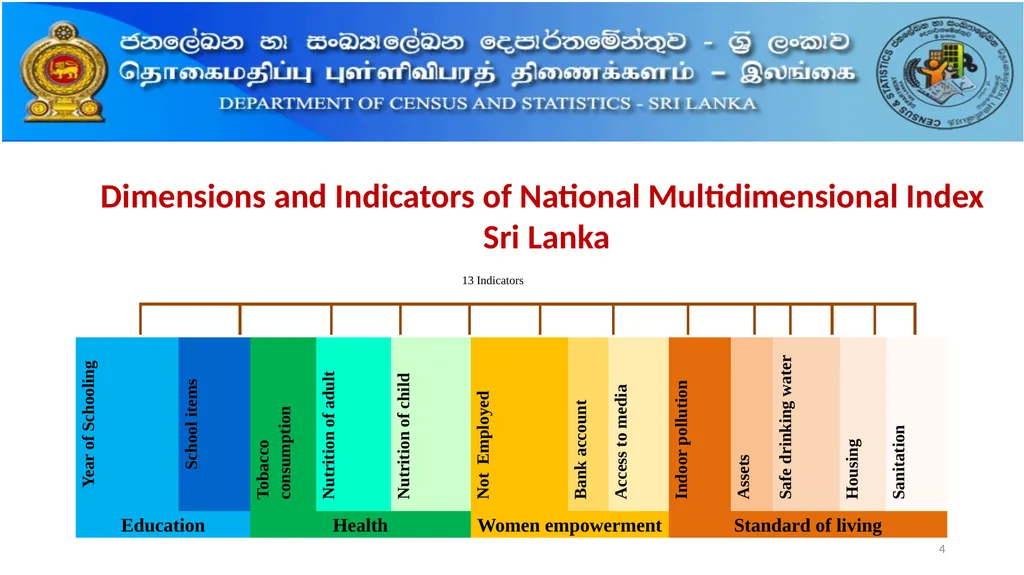
slide4. 4 Dimensions and Indicators of National Multidimensional Index
Sri Lanka<br>
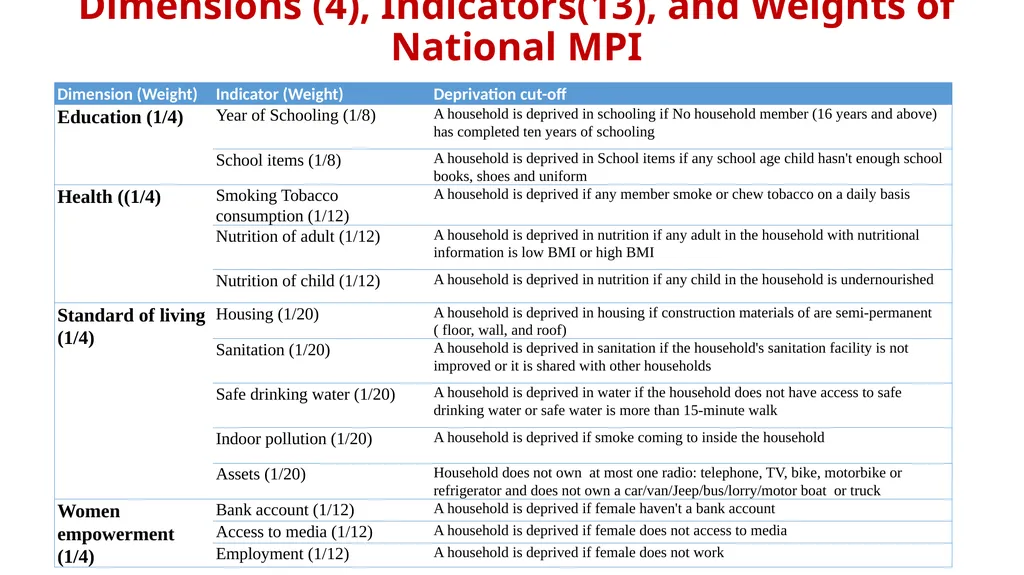
slide5. Dimensions (4), Indicators(13), and Weights of National MPI<br>
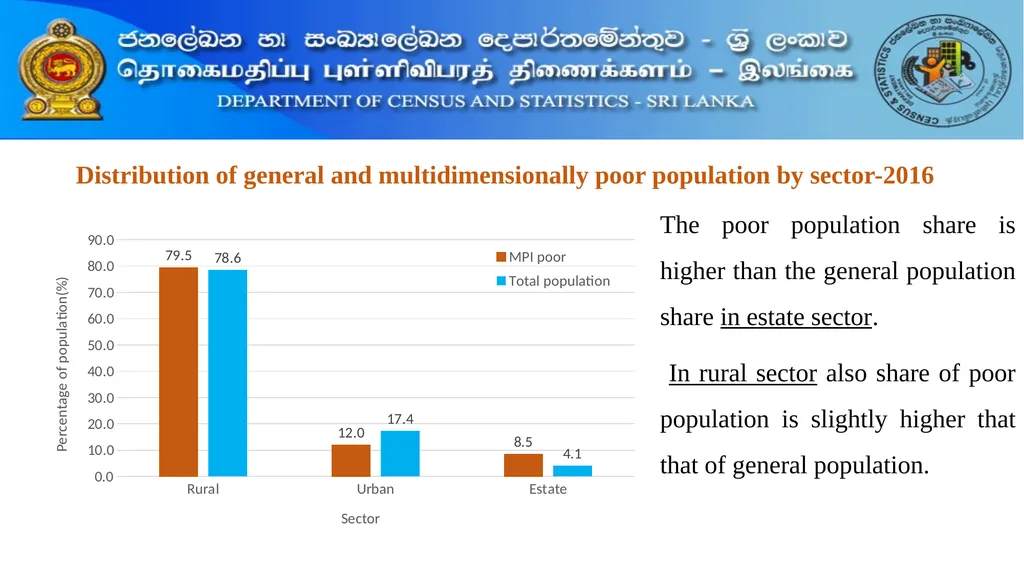
slide6. Distribution of general and multidimensionally poor population by sector-2016 The poor population share is higher than the general population share in estate sector.
In rural sector also share of poor population is slightly higher that that of general population.<br>
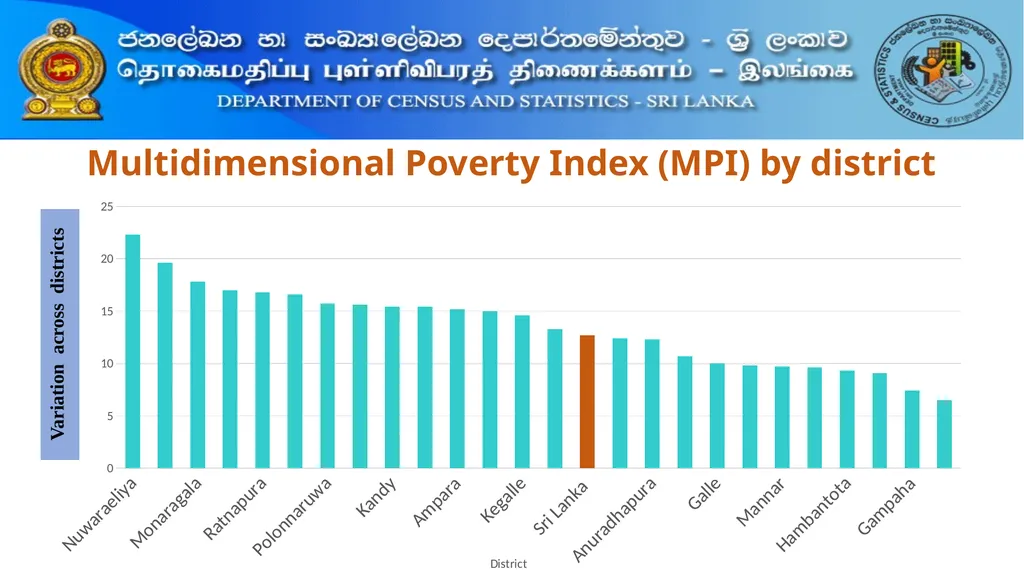
slide7. Multidimensional Poverty Index (MPI) by district Variation across districts<br>
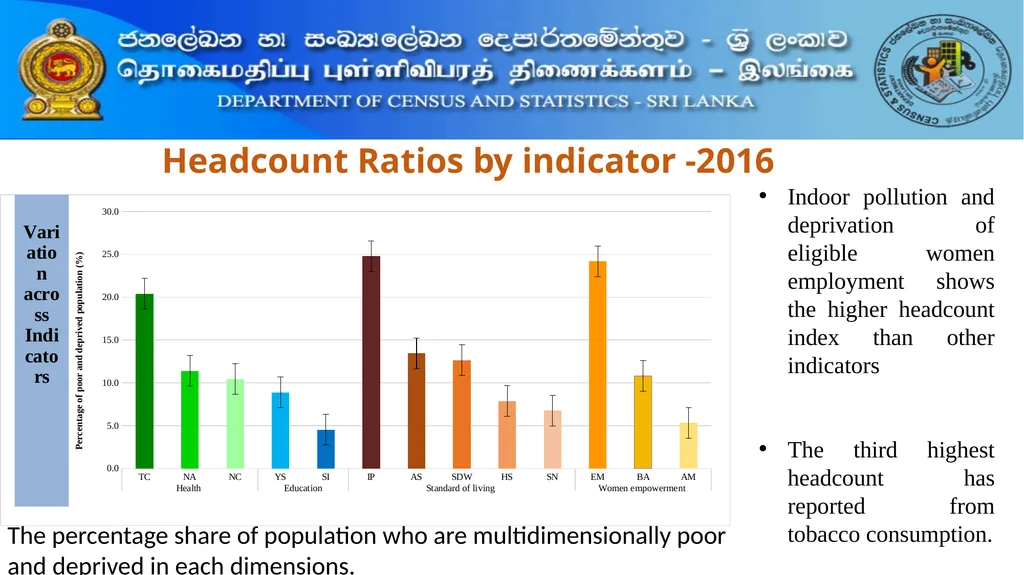
slide8. Headcount Ratios by indicator -2016 The percentage share of population who are multidimensionally poor and deprived in each dimensions. Indoor pollution and deprivation of eligible women employment shows the higher headcount index than other indicators
The third highest headcount has reported from tobacco consumption.<br>
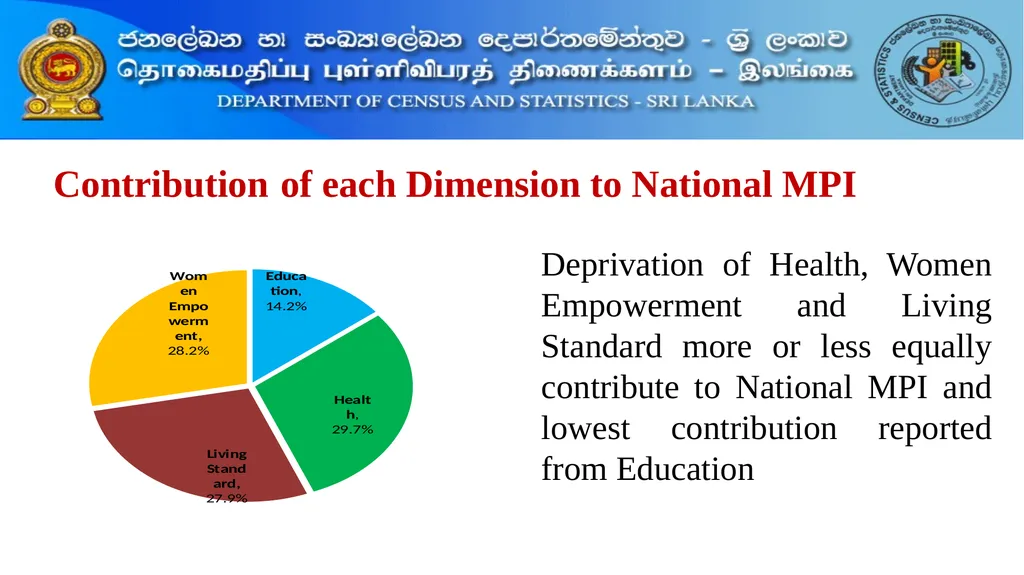
slide9. Contribution of each Dimension to National MPI Deprivation of Health, Women Empowerment and Living Standard more or less equally contribute to National MPI and lowest contribution reported from Education<br>
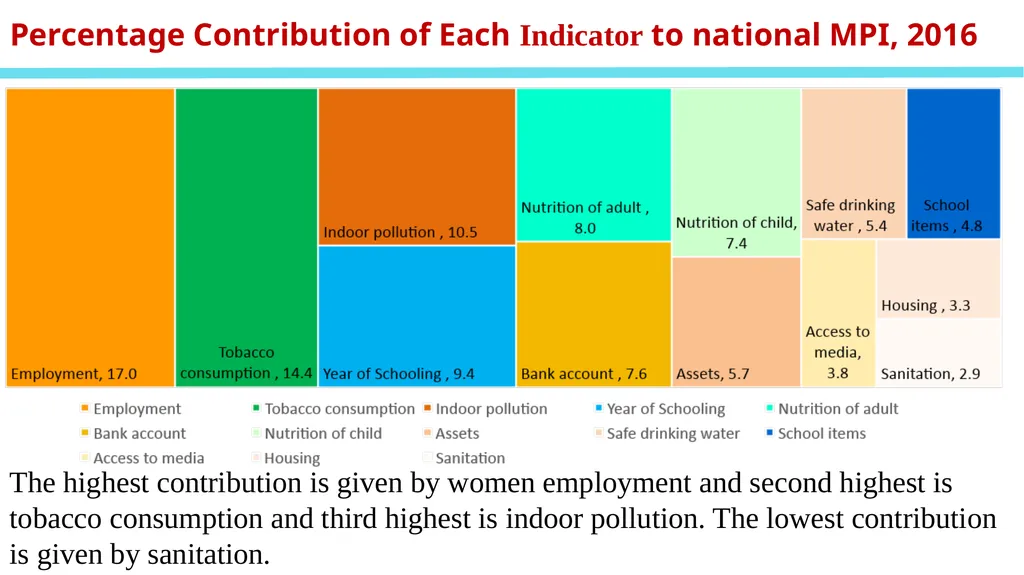
slide10. Percentage Contribution of Each Indicator to national MPI, 2016 The highest contribution is given by women employment and second highest is tobacco consumption and third highest is indoor pollution. The lowest contribution is given by sanitation.<br>
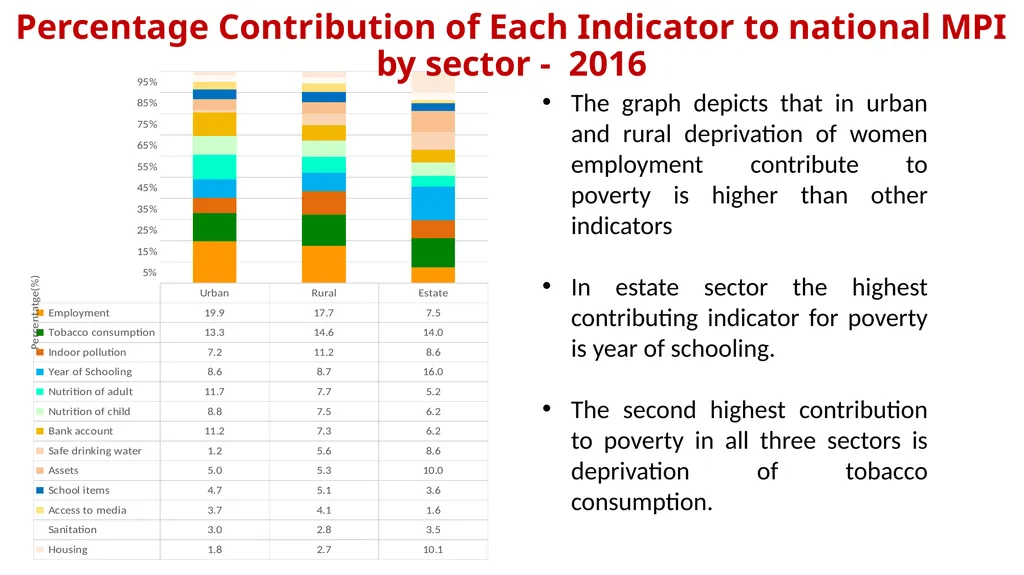
slide11. Percentage Contribution of Each Indicator to national MPI by sector - 2016 The graph depicts that in urban and rural deprivation of women employment contribute to poverty is higher than other indicators
In estate sector the highest contributing indicator for poverty is year of schooling.
The second highest contribution to poverty in all three sectors is deprivation of tobacco consumption.<br>
slide12. Percentage Contribution of Each Indicator to national MPI by District 2016 Women Employment (20.7%) Tobacco Consumption (18.6%) School items
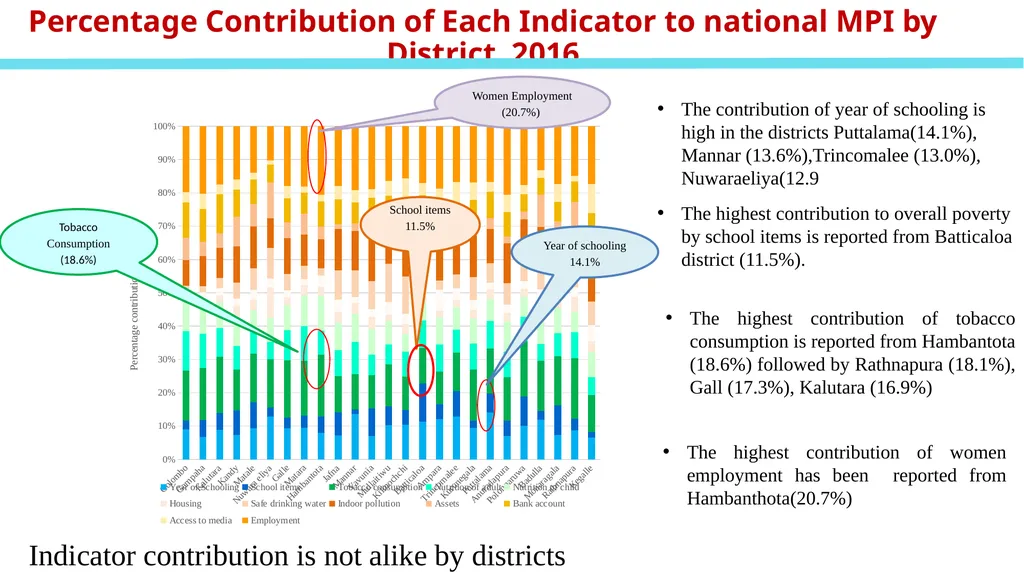
11.5% Year of schooling 14.1% Indicator contribution is not alike by districts The contribution of year of schooling is high in the districts Puttalama(14.1%), Mannar (13.6%),Trincomalee (13.0%), Nuwaraeliya(12.9 The highest contribution to overall poverty by school items is reported from Batticaloa district (11.5%). The highest contribution of tobacco consumption is reported from Hambantota (18.6%) followed by Rathnapura (18.1%), Gall (17.3%), Kalutara (16.9%) The highest contribution of women employment has been reported from Hambanthota(20.7%)<br>
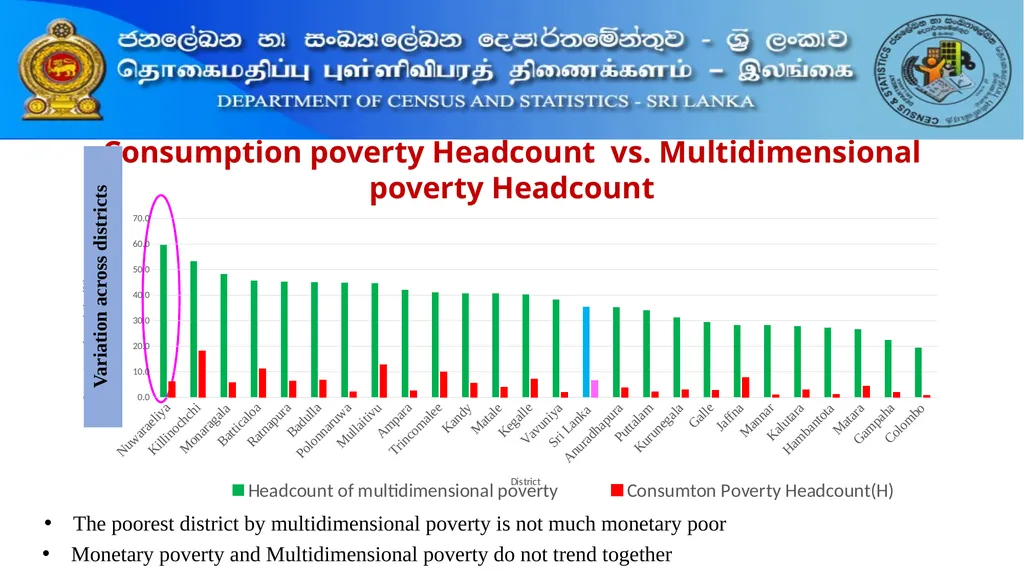
slide13. Consumption poverty Headcount vs. Multidimensional poverty Headcount The poorest district by multidimensional poverty is not much monetary poor Monetary poverty and Multidimensional poverty do not trend together Variation across districts<br>
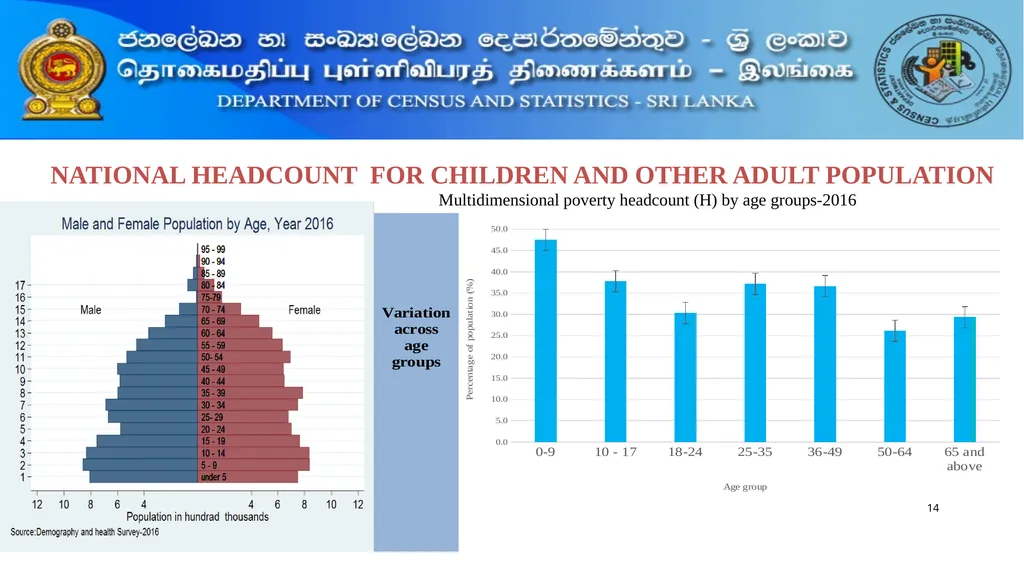
slide14. 14 NATIONAL HEADCOUNT FOR CHILDREN AND OTHER ADULT POPULATION Multidimensional poverty headcount (H) by age groups-2016<br>
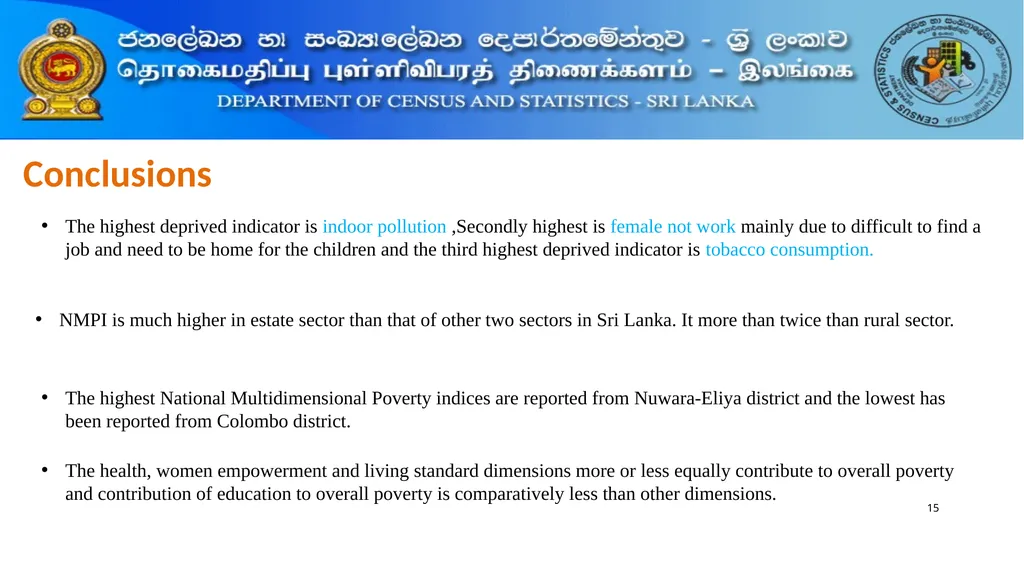
slide15. 15 Conclusions The highest deprived indicator is indoor pollution ,Secondly highest is female not work mainly due to difficult to find a job and need to be home for the children and the third highest deprived indicator is tobacco consumption. NMPI is much higher in estate sector than that of other two sectors in Sri Lanka. It more than twice than rural sector. The highest National Multidimensional Poverty indices are reported from Nuwara-Eliya district and the lowest has been reported from Colombo district. The health, women empowerment and living standard dimensions more or less equally contribute to overall poverty and contribution of education to overall poverty is comparatively less than other dimensions.<br>
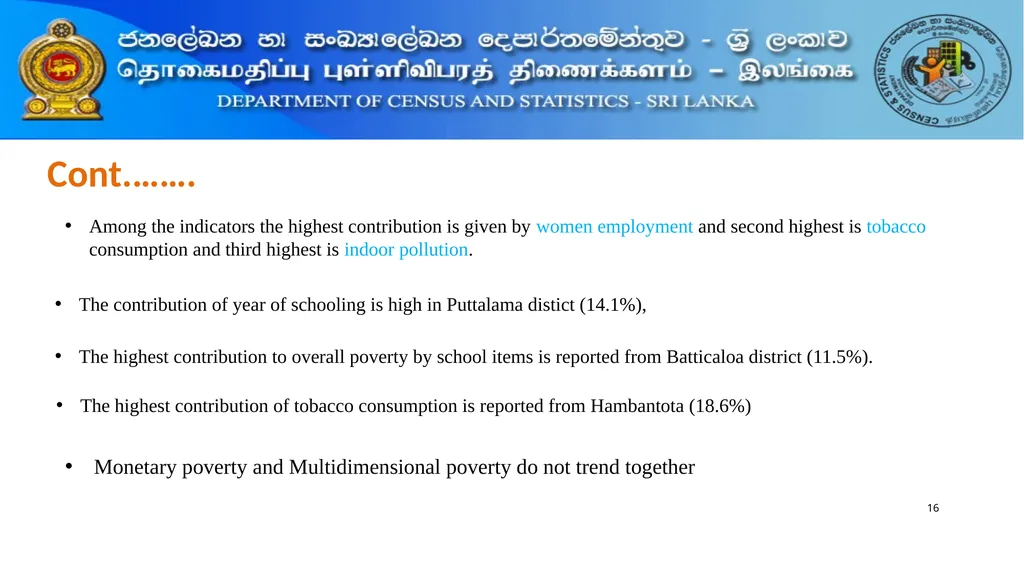
slide16. 16 Cont.……. Among the indicators the highest contribution is given by women employment and second highest is tobacco consumption and third highest is indoor pollution. The contribution of year of schooling is high in Puttalama distict (14.1%), The highest contribution to overall poverty by school items is reported from Batticaloa district (11.5%). The highest contribution of tobacco consumption is reported from Hambantota (18.6%) Monetary poverty and Multidimensional poverty do not trend together<br>
slide17. AKNOWLEDGEMENT Support Provided by
Mrs.M.D.D.D.Deepawansa statistician
Department of Census & Statistics
Sri Lanka<br>
slide18. 18 Thank you<br>
P.M.P.Anura Kumara
Additional Director General
Department of Census & Statistics
Sri Lanka In Collaboration with OPHI and DCS<br>
slide3. An MPI reflects the multiple deprivations each person faces at the same time. The MPI dashboard’s key statistics include:
• Incidence of poverty: The percentage of multi dimensionally poor people.
• Intensity of poverty: The average proportion of deprivations poor people face at once.
• Composition of poverty: The percentage of people who are poor and deprived in each indicator. Alkire and Foster Method<br>
slide4. 4 Dimensions and Indicators of National Multidimensional Index
Sri Lanka<br>
slide5. Dimensions (4), Indicators(13), and Weights of National MPI<br>
slide6. Distribution of general and multidimensionally poor population by sector-2016 The poor population share is higher than the general population share in estate sector.
In rural sector also share of poor population is slightly higher that that of general population.<br>
slide7. Multidimensional Poverty Index (MPI) by district Variation across districts<br>
slide8. Headcount Ratios by indicator -2016 The percentage share of population who are multidimensionally poor and deprived in each dimensions. Indoor pollution and deprivation of eligible women employment shows the higher headcount index than other indicators
The third highest headcount has reported from tobacco consumption.<br>
slide9. Contribution of each Dimension to National MPI Deprivation of Health, Women Empowerment and Living Standard more or less equally contribute to National MPI and lowest contribution reported from Education<br>
slide10. Percentage Contribution of Each Indicator to national MPI, 2016 The highest contribution is given by women employment and second highest is tobacco consumption and third highest is indoor pollution. The lowest contribution is given by sanitation.<br>
slide11. Percentage Contribution of Each Indicator to national MPI by sector - 2016 The graph depicts that in urban and rural deprivation of women employment contribute to poverty is higher than other indicators
In estate sector the highest contributing indicator for poverty is year of schooling.
The second highest contribution to poverty in all three sectors is deprivation of tobacco consumption.<br>
slide12. Percentage Contribution of Each Indicator to national MPI by District 2016 Women Employment (20.7%) Tobacco Consumption (18.6%) School items
11.5% Year of schooling 14.1% Indicator contribution is not alike by districts The contribution of year of schooling is high in the districts Puttalama(14.1%), Mannar (13.6%),Trincomalee (13.0%), Nuwaraeliya(12.9 The highest contribution to overall poverty by school items is reported from Batticaloa district (11.5%). The highest contribution of tobacco consumption is reported from Hambantota (18.6%) followed by Rathnapura (18.1%), Gall (17.3%), Kalutara (16.9%) The highest contribution of women employment has been reported from Hambanthota(20.7%)<br>
slide13. Consumption poverty Headcount vs. Multidimensional poverty Headcount The poorest district by multidimensional poverty is not much monetary poor Monetary poverty and Multidimensional poverty do not trend together Variation across districts<br>
slide14. 14 NATIONAL HEADCOUNT FOR CHILDREN AND OTHER ADULT POPULATION Multidimensional poverty headcount (H) by age groups-2016<br>
slide15. 15 Conclusions The highest deprived indicator is indoor pollution ,Secondly highest is female not work mainly due to difficult to find a job and need to be home for the children and the third highest deprived indicator is tobacco consumption. NMPI is much higher in estate sector than that of other two sectors in Sri Lanka. It more than twice than rural sector. The highest National Multidimensional Poverty indices are reported from Nuwara-Eliya district and the lowest has been reported from Colombo district. The health, women empowerment and living standard dimensions more or less equally contribute to overall poverty and contribution of education to overall poverty is comparatively less than other dimensions.<br>
slide16. 16 Cont.……. Among the indicators the highest contribution is given by women employment and second highest is tobacco consumption and third highest is indoor pollution. The contribution of year of schooling is high in Puttalama distict (14.1%), The highest contribution to overall poverty by school items is reported from Batticaloa district (11.5%). The highest contribution of tobacco consumption is reported from Hambantota (18.6%) Monetary poverty and Multidimensional poverty do not trend together<br>
slide17. AKNOWLEDGEMENT Support Provided by
Mrs.M.D.D.D.Deepawansa statistician
Department of Census & Statistics
Sri Lanka<br>
slide18. 18 Thank you<br>