
Phylogenetic Analysis Introduction to Phylogenetic
LD
Published · 12 slides · 0 views
1 / 1

Description
Phylogenetic Analysis Introduction to Phylogenetic Analysis I Taxonomy - is the science of classification of organisms. I Phylogeny - is the evolution of a genetically related group of organisms. I Or: a study of relationships between
Related Topics
Share
Embed code
Download this presentation From Below
"Phylogenetic Analysis Introduction to Phylogenetic" is the property of its rightful owner. Permission is granted to download and print the materials on this website for personal, non-commercial use only, and to display it on your personal computer provided you do not modify the materials and that you retain all copyright notices contained in the materials. By downloading content from our website, you accept the terms of this agreement.
Presentation Transcript
01
Phylogenetic Analysis<br>
02
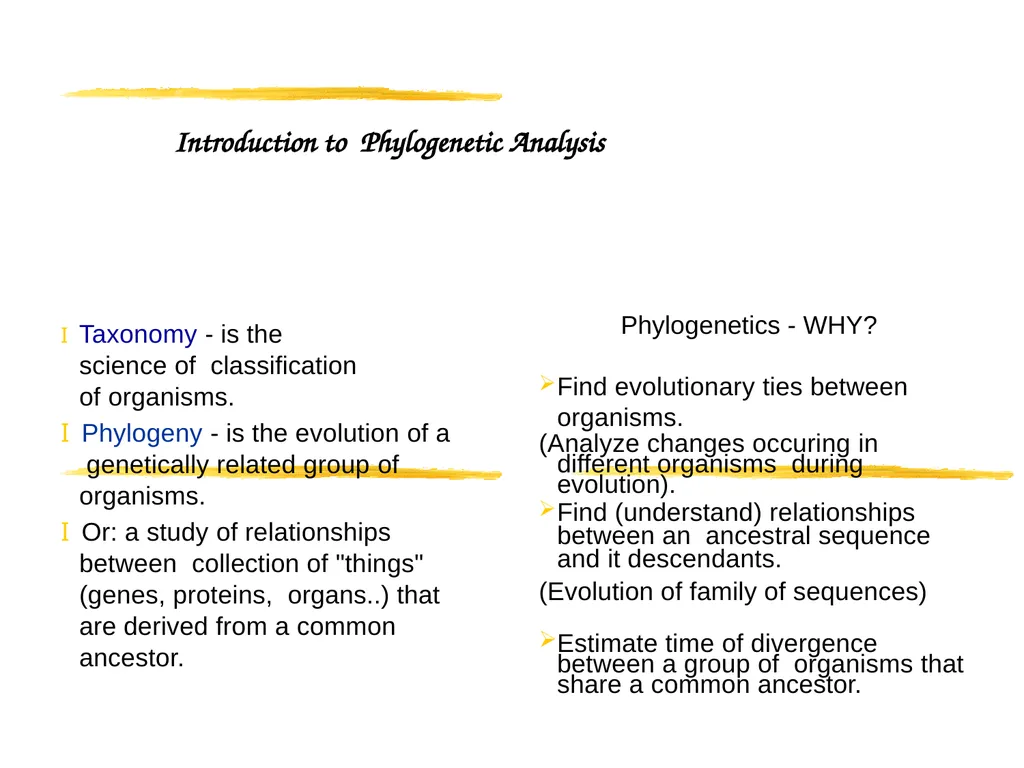
Introduction to Phylogenetic Analysis I Taxonomy - is the science of classification of organisms.
I Phylogeny - is the evolution of a genetically related group of organisms.
I Or: a study of relationships between collection of "things" (genes, proteins, organs..) that are derived from a common ancestor. Phylogenetics - WHY?
Find evolutionary ties between organisms.
(Analyze changes occuring in different organisms during evolution).
Find (understand) relationships between an ancestral sequence and it descendants.
(Evolution of family of sequences)
Estimate time of divergence between a group of organisms that share a common ancestor.<br>
I Phylogeny - is the evolution of a genetically related group of organisms.
I Or: a study of relationships between collection of "things" (genes, proteins, organs..) that are derived from a common ancestor. Phylogenetics - WHY?
Find evolutionary ties between organisms.
(Analyze changes occuring in different organisms during evolution).
Find (understand) relationships between an ancestral sequence and it descendants.
(Evolution of family of sequences)
Estimate time of divergence between a group of organisms that share a common ancestor.<br>
03
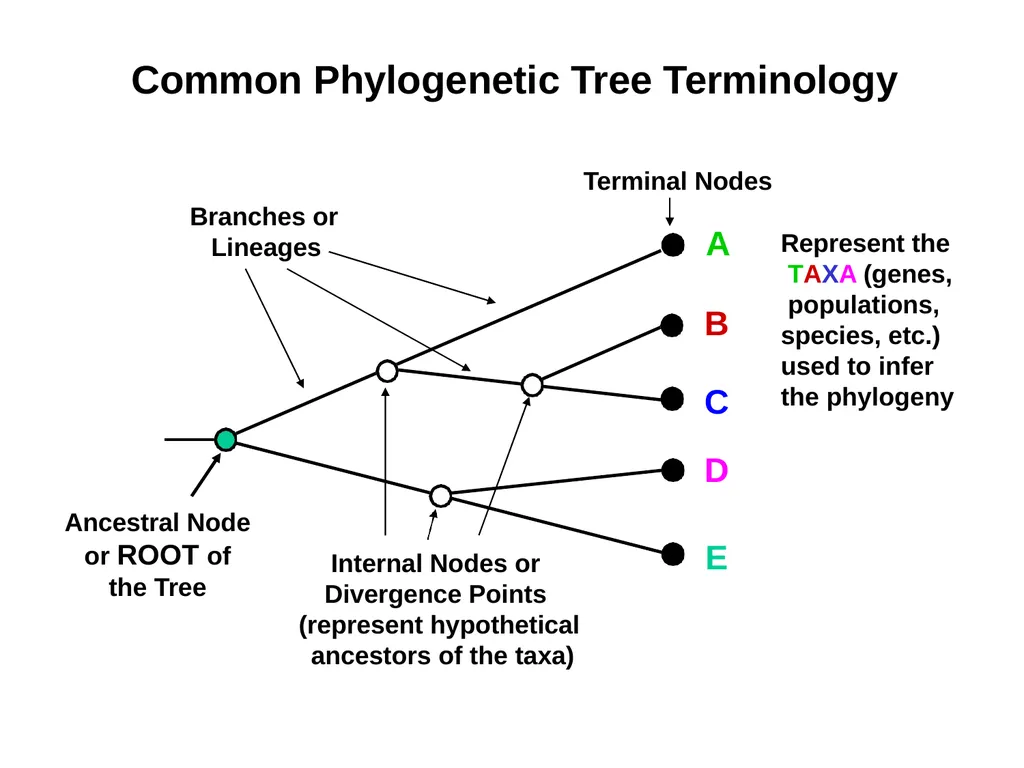
Ancestral Node or ROOT of the Tree Internal Nodes or Divergence Points (represent hypothetical ancestors of the taxa) Branches or Lineages Terminal Nodes A B C
D E Represent the TAXA (genes, populations, species, etc.) used to infer the phylogeny Common Phylogenetic Tree Terminology<br>
D E Represent the TAXA (genes, populations, species, etc.) used to infer the phylogeny Common Phylogenetic Tree Terminology<br>
04
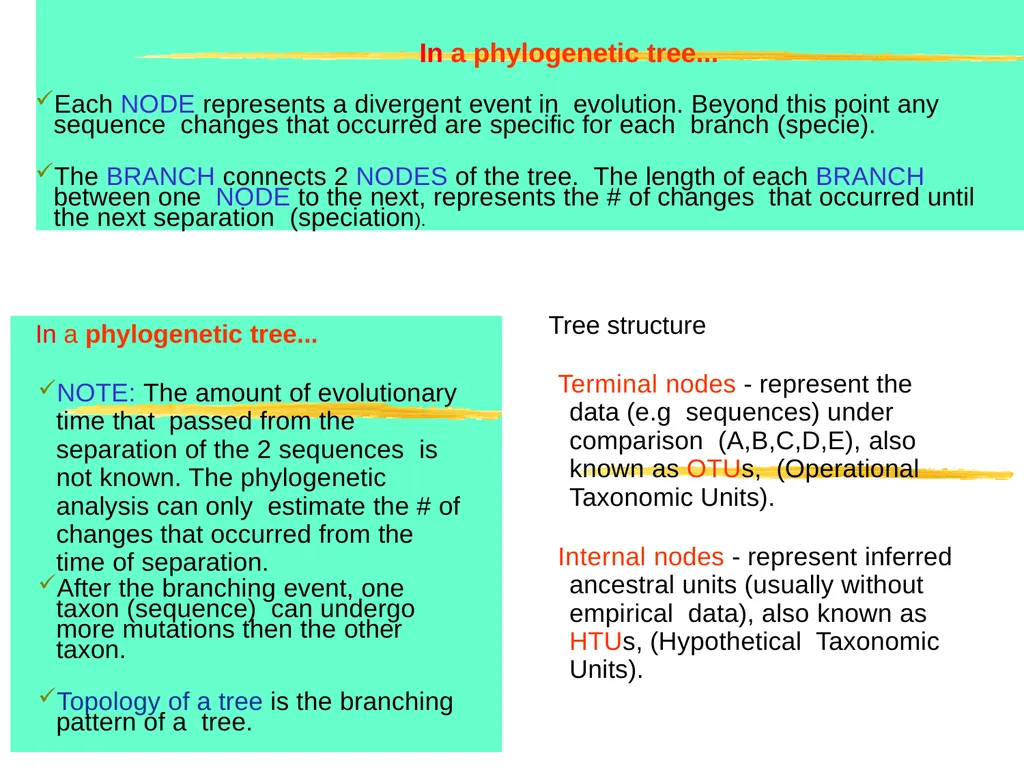
In a phylogenetic tree... Each NODE represents a divergent event in evolution. Beyond this point any sequence changes that occurred are specific for each branch (specie).
The BRANCH connects 2 NODES of the tree. The length of each BRANCH between one NODE to the next, represents the # of changes that occurred until the next separation (speciation). In a phylogenetic tree...
NOTE: The amount of evolutionary time that passed from the separation of the 2 sequences is not known. The phylogenetic analysis can only estimate the # of changes that occurred from the time of separation.
After the branching event, one taxon (sequence) can undergo more mutations then the other taxon.
Topology of a tree is the branching pattern of a tree. Tree structure
Terminal nodes - represent the data (e.g sequences) under comparison (A,B,C,D,E), also known as OTUs, (Operational Taxonomic Units).
Internal nodes - represent inferred ancestral units (usually without empirical data), also known as HTUs, (Hypothetical Taxonomic Units).<br>
The BRANCH connects 2 NODES of the tree. The length of each BRANCH between one NODE to the next, represents the # of changes that occurred until the next separation (speciation). In a phylogenetic tree...
NOTE: The amount of evolutionary time that passed from the separation of the 2 sequences is not known. The phylogenetic analysis can only estimate the # of changes that occurred from the time of separation.
After the branching event, one taxon (sequence) can undergo more mutations then the other taxon.
Topology of a tree is the branching pattern of a tree. Tree structure
Terminal nodes - represent the data (e.g sequences) under comparison (A,B,C,D,E), also known as OTUs, (Operational Taxonomic Units).
Internal nodes - represent inferred ancestral units (usually without empirical data), also known as HTUs, (Hypothetical Taxonomic Units).<br>
05
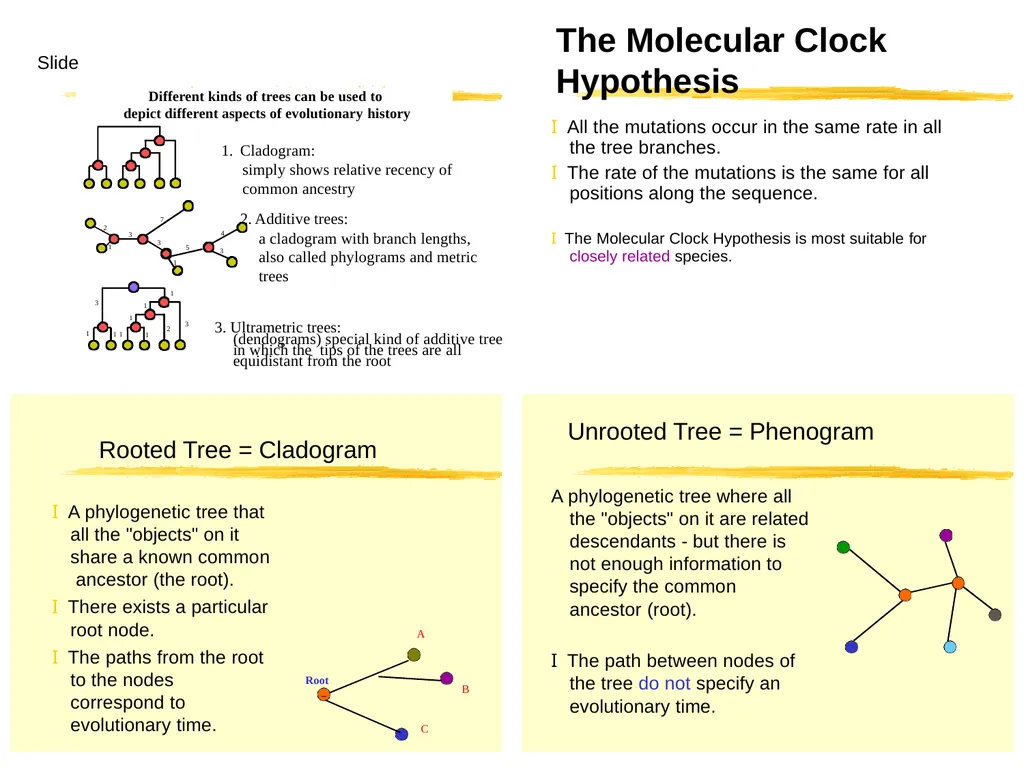
Slide Different kinds of trees can be used to depict different aspects of evolutionary history 1. Cladogram:
simply shows relative recency of common ancestry 2. Additive trees:
a cladogram with branch lengths,
also called phylograms and metric trees 3. Ultrametric trees:
(dendograms) special kind of additive tree in which the tips of the trees are all equidistant from the root 5 4 3 1 3 7 3 2 1 1 1 1 1 2 3 1 1 1 3 The Molecular Clock Hypothesis I All the mutations occur in the same rate in all the tree branches.
I The rate of the mutations is the same for all positions along the sequence. I The Molecular Clock Hypothesis is most suitable for closely related species. Rooted Tree = Cladogram I A phylogenetic tree that all the "objects" on it share a known common ancestor (the root).
I There exists a particular root node.
I The paths from the root to the nodes correspond to evolutionary time. A B C Root A phylogenetic tree where all the "objects" on it are related descendants - but there is not enough information to specify the common ancestor (root). I The path between nodes of the tree do not specify an evolutionary time. B Unrooted Tree = Phenogram<br>
simply shows relative recency of common ancestry 2. Additive trees:
a cladogram with branch lengths,
also called phylograms and metric trees 3. Ultrametric trees:
(dendograms) special kind of additive tree in which the tips of the trees are all equidistant from the root 5 4 3 1 3 7 3 2 1 1 1 1 1 2 3 1 1 1 3 The Molecular Clock Hypothesis I All the mutations occur in the same rate in all the tree branches.
I The rate of the mutations is the same for all positions along the sequence. I The Molecular Clock Hypothesis is most suitable for closely related species. Rooted Tree = Cladogram I A phylogenetic tree that all the "objects" on it share a known common ancestor (the root).
I There exists a particular root node.
I The paths from the root to the nodes correspond to evolutionary time. A B C Root A phylogenetic tree where all the "objects" on it are related descendants - but there is not enough information to specify the common ancestor (root). I The path between nodes of the tree do not specify an evolutionary time. B Unrooted Tree = Phenogram<br>
06
Did the Florida Dentist infect his patients with HIV? Patient D DENTIST
Patient C
Patient A Patient G
Patient B Patient E Patient A
DENTIST Local control 2
Local control 3
Patient F Local control 9 Local control 35
Local control 3 Yes:
The HIV sequences from these patients fall within the clade of HIV sequences found in the dentist. No No From Ou et al. (1992) and Page & Holmes (1998) Phylogenetic tree of HIV sequences from the DENTIST, his Patients, & Local HIV-infected People:<br>
Patient C
Patient A Patient G
Patient B Patient E Patient A
DENTIST Local control 2
Local control 3
Patient F Local control 9 Local control 35
Local control 3 Yes:
The HIV sequences from these patients fall within the clade of HIV sequences found in the dentist. No No From Ou et al. (1992) and Page & Holmes (1998) Phylogenetic tree of HIV sequences from the DENTIST, his Patients, & Local HIV-infected People:<br>
07
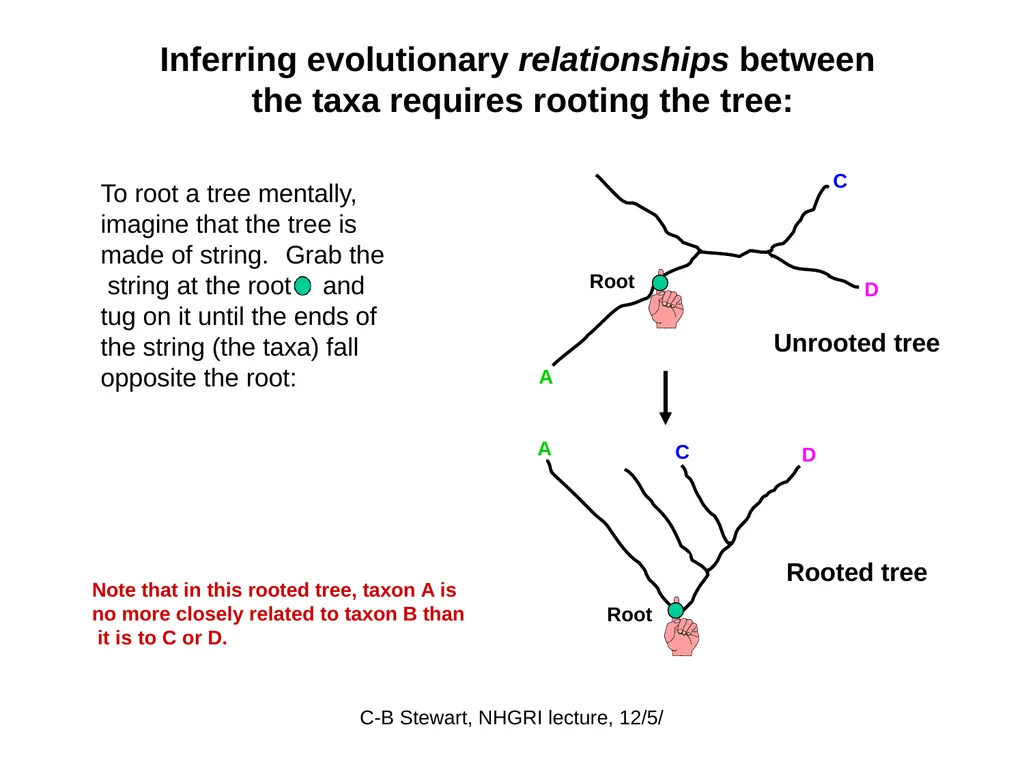
Inferring evolutionary relationships between the taxa requires rooting the tree: To root a tree mentally, imagine that the tree is made of string. Grab the string at the root and tug on it until the ends of the string (the taxa) fall opposite the root: A C Root D A C D Root Note that in this rooted tree, taxon A is no more closely related to taxon B than it is to C or D. Rooted tree Unrooted tree C-B Stewart, NHGRI lecture, 12/5/<br>
08
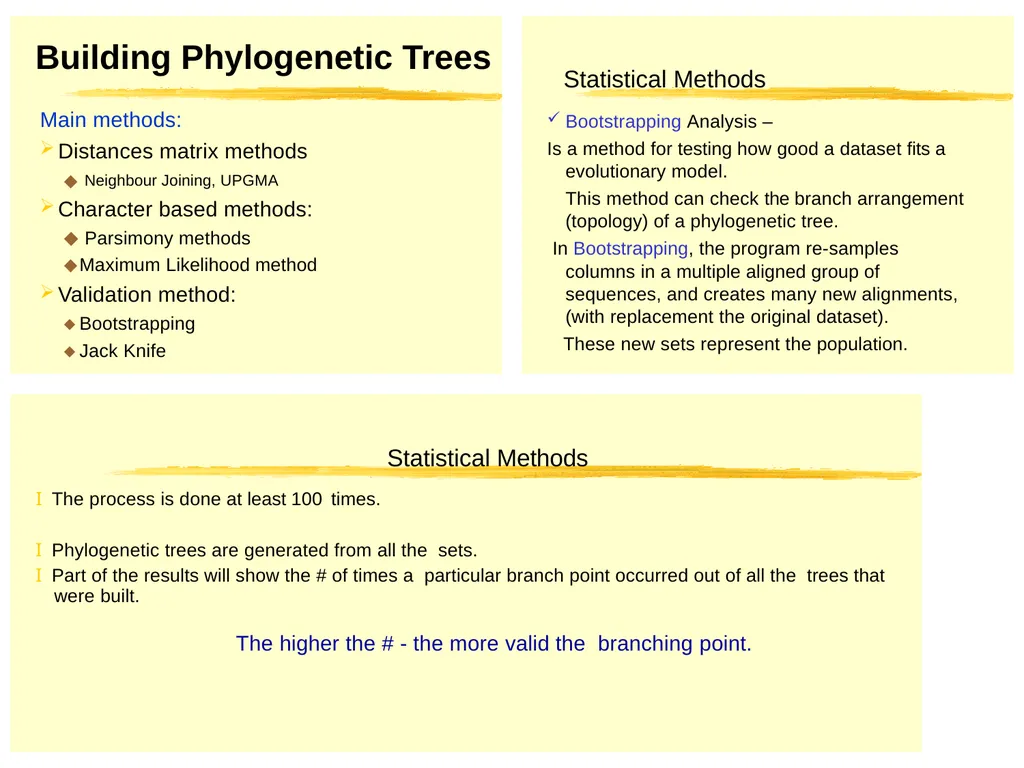
Building Phylogenetic Trees Main methods:
Distances matrix methods
Neighbour Joining, UPGMA
Character based methods:
Parsimony methods
Maximum Likelihood method
Validation method:
Bootstrapping
Jack Knife Statistical Methods Bootstrapping Analysis –
Is a method for testing how good a dataset fits a evolutionary model.
This method can check the branch arrangement (topology) of a phylogenetic tree.
In Bootstrapping, the program re-samples columns in a multiple aligned group of sequences, and creates many new alignments, (with replacement the original dataset).
These new sets represent the population. Statistical Methods
I The process is done at least 100 times.
I Phylogenetic trees are generated from all the sets.
I Part of the results will show the # of times a particular branch point occurred out of all the trees that were built.
The higher the # - the more valid the branching point.<br>
Distances matrix methods
Neighbour Joining, UPGMA
Character based methods:
Parsimony methods
Maximum Likelihood method
Validation method:
Bootstrapping
Jack Knife Statistical Methods Bootstrapping Analysis –
Is a method for testing how good a dataset fits a evolutionary model.
This method can check the branch arrangement (topology) of a phylogenetic tree.
In Bootstrapping, the program re-samples columns in a multiple aligned group of sequences, and creates many new alignments, (with replacement the original dataset).
These new sets represent the population. Statistical Methods
I The process is done at least 100 times.
I Phylogenetic trees are generated from all the sets.
I Part of the results will show the # of times a particular branch point occurred out of all the trees that were built.
The higher the # - the more valid the branching point.<br>
09
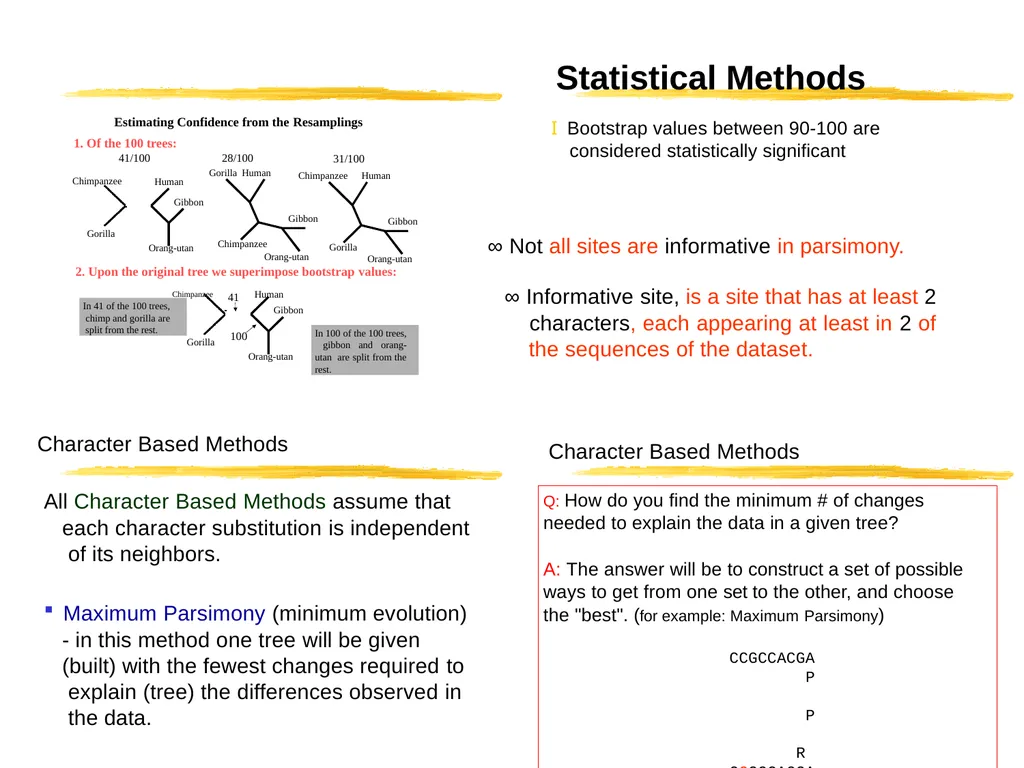
Chimpanzee Gorilla Gorilla Chimpanzee
Orang-utan Human Orang-utan Orang-utan Gibbon Gibbon Gibbon 41/100 28/100
Gorilla Human 31/100
Chimpanzee Human Gorilla Chimpanzee Human Orang-utan Gibbon 100 41 Estimating Confidence from the Resamplings
1. Of the 100 trees: In 100 of the 100 trees, gibbon and orang-utan are split from the rest. In 41 of the 100 trees, chimp and gorilla are split from the rest. 2. Upon the original tree we superimpose bootstrap values: Statistical Methods I Bootstrap values between 90-100 are considered statistically significant Character Based Methods All Character Based Methods assume that each character substitution is independent of its neighbors. Maximum Parsimony (minimum evolution)
- in this method one tree will be given (built) with the fewest changes required to explain (tree) the differences observed in the data. Character Based Methods Q: How do you find the minimum # of changes needed to explain the data in a given tree?
A: The answer will be to construct a set of possible ways to get from one set to the other, and choose the "best". (for example: Maximum Parsimony)
CCGCCACGA P P R CGGCCACGA R P R ∞ Not all sites are informative in parsimony. ∞ Informative site, is a site that has at least 2 characters, each appearing at least in 2 of the sequences of the dataset.<br>
Orang-utan Human Orang-utan Orang-utan Gibbon Gibbon Gibbon 41/100 28/100
Gorilla Human 31/100
Chimpanzee Human Gorilla Chimpanzee Human Orang-utan Gibbon 100 41 Estimating Confidence from the Resamplings
1. Of the 100 trees: In 100 of the 100 trees, gibbon and orang-utan are split from the rest. In 41 of the 100 trees, chimp and gorilla are split from the rest. 2. Upon the original tree we superimpose bootstrap values: Statistical Methods I Bootstrap values between 90-100 are considered statistically significant Character Based Methods All Character Based Methods assume that each character substitution is independent of its neighbors. Maximum Parsimony (minimum evolution)
- in this method one tree will be given (built) with the fewest changes required to explain (tree) the differences observed in the data. Character Based Methods Q: How do you find the minimum # of changes needed to explain the data in a given tree?
A: The answer will be to construct a set of possible ways to get from one set to the other, and choose the "best". (for example: Maximum Parsimony)
CCGCCACGA P P R CGGCCACGA R P R ∞ Not all sites are informative in parsimony. ∞ Informative site, is a site that has at least 2 characters, each appearing at least in 2 of the sequences of the dataset.<br>
10
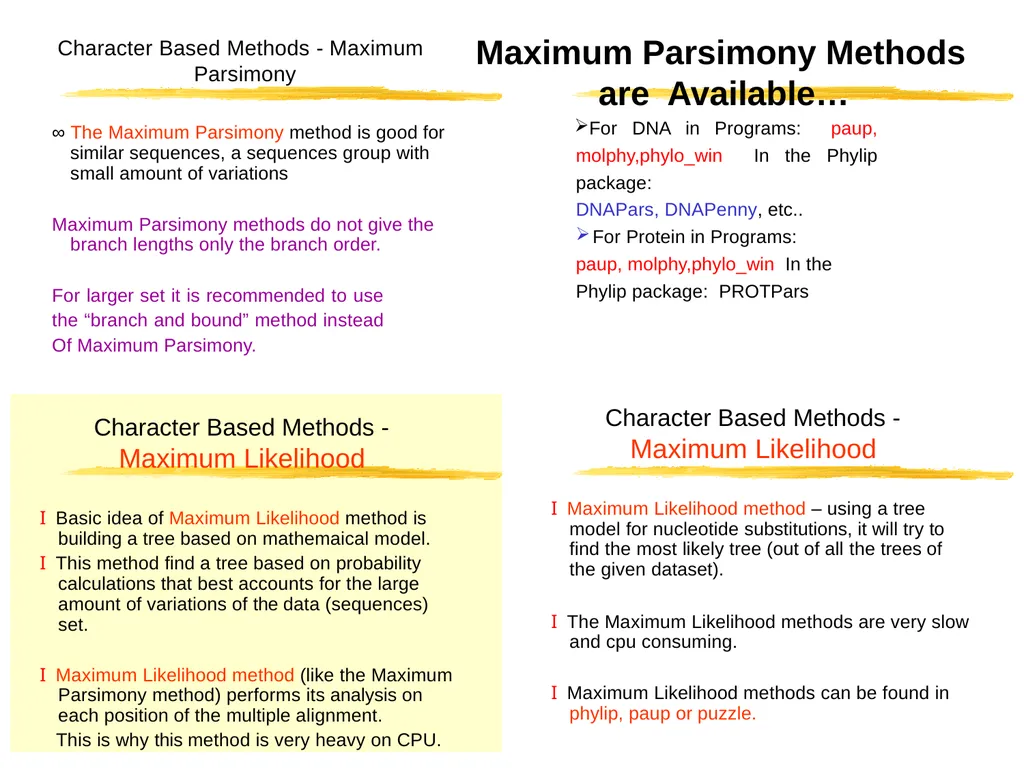
Character Based Methods - Maximum Parsimony Maximum Parsimony Methods are Available… For DNA in Programs: paup, molphy,phylo_win In the Phylip package:
DNAPars, DNAPenny, etc..
For Protein in Programs:
paup, molphy,phylo_win In the Phylip package: PROTPars ∞ The Maximum Parsimony method is good for similar sequences, a sequences group with small amount of variations
Maximum Parsimony methods do not give the branch lengths only the branch order.
For larger set it is recommended to use the “branch and bound” method instead Of Maximum Parsimony.
Character Based Methods -
Maximum Likelihood
I Basic idea of Maximum Likelihood method is building a tree based on mathemaical model.
I This method find a tree based on probability calculations that best accounts for the large amount of variations of the data (sequences) set.
I Maximum Likelihood method (like the Maximum Parsimony method) performs its analysis on each position of the multiple alignment.
This is why this method is very heavy on CPU. Character Based Methods -
Maximum Likelihood
I Maximum Likelihood method – using a tree model for nucleotide substitutions, it will try to find the most likely tree (out of all the trees of the given dataset).
I The Maximum Likelihood methods are very slow and cpu consuming.
I Maximum Likelihood methods can be found in phylip, paup or puzzle.<br>
DNAPars, DNAPenny, etc..
For Protein in Programs:
paup, molphy,phylo_win In the Phylip package: PROTPars ∞ The Maximum Parsimony method is good for similar sequences, a sequences group with small amount of variations
Maximum Parsimony methods do not give the branch lengths only the branch order.
For larger set it is recommended to use the “branch and bound” method instead Of Maximum Parsimony.
Character Based Methods -
Maximum Likelihood
I Basic idea of Maximum Likelihood method is building a tree based on mathemaical model.
I This method find a tree based on probability calculations that best accounts for the large amount of variations of the data (sequences) set.
I Maximum Likelihood method (like the Maximum Parsimony method) performs its analysis on each position of the multiple alignment.
This is why this method is very heavy on CPU. Character Based Methods -
Maximum Likelihood
I Maximum Likelihood method – using a tree model for nucleotide substitutions, it will try to find the most likely tree (out of all the trees of the given dataset).
I The Maximum Likelihood methods are very slow and cpu consuming.
I Maximum Likelihood methods can be found in phylip, paup or puzzle.<br>
11
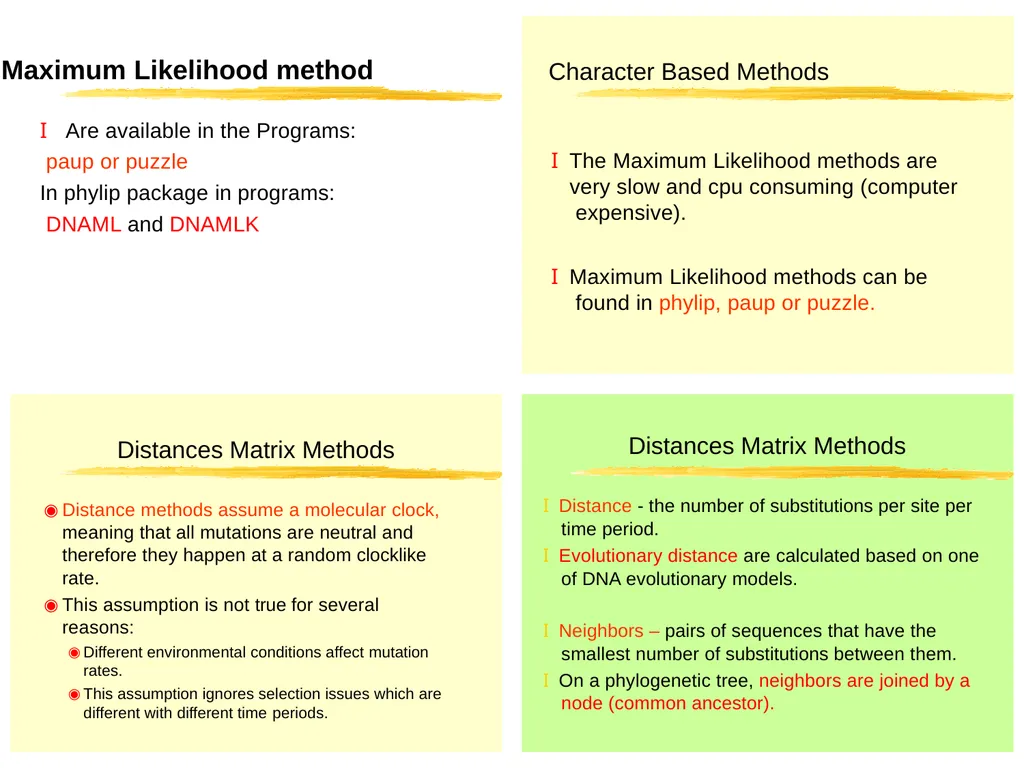
Maximum Likelihood method I Are available in the Programs: paup or puzzle
In phylip package in programs: DNAML and DNAMLK Character Based Methods I The Maximum Likelihood methods are very slow and cpu consuming (computer expensive).
I Maximum Likelihood methods can be found in phylip, paup or puzzle. Distances Matrix Methods
Distance methods assume a molecular clock, meaning that all mutations are neutral and therefore they happen at a random clocklike rate.
This assumption is not true for several reasons:
Different environmental conditions affect mutation rates.
This assumption ignores selection issues which are different with different time periods. Distances Matrix Methods
I Distance - the number of substitutions per site per time period.
I Evolutionary distance are calculated based on one of DNA evolutionary models.
I Neighbors – pairs of sequences that have the smallest number of substitutions between them.
I On a phylogenetic tree, neighbors are joined by a node (common ancestor).<br>
In phylip package in programs: DNAML and DNAMLK Character Based Methods I The Maximum Likelihood methods are very slow and cpu consuming (computer expensive).
I Maximum Likelihood methods can be found in phylip, paup or puzzle. Distances Matrix Methods
Distance methods assume a molecular clock, meaning that all mutations are neutral and therefore they happen at a random clocklike rate.
This assumption is not true for several reasons:
Different environmental conditions affect mutation rates.
This assumption ignores selection issues which are different with different time periods. Distances Matrix Methods
I Distance - the number of substitutions per site per time period.
I Evolutionary distance are calculated based on one of DNA evolutionary models.
I Neighbors – pairs of sequences that have the smallest number of substitutions between them.
I On a phylogenetic tree, neighbors are joined by a node (common ancestor).<br>
12
Distances Matrix Methods I Distance methods vary in the way they construct the trees.
I Distance methods try to place the correct positions of all the neighbors, and find the correct branches lengths.
I Distance based clustering methods:
I Neighbor-Joining (unrooted tree)
I UPGMA (rooted tree) Distance method steps Multiple alignments - based on all against all pairwise comparisons.
Building distance matrix of all the compared sequences (all pair of OTUs).
Disregard of the actual sequences.
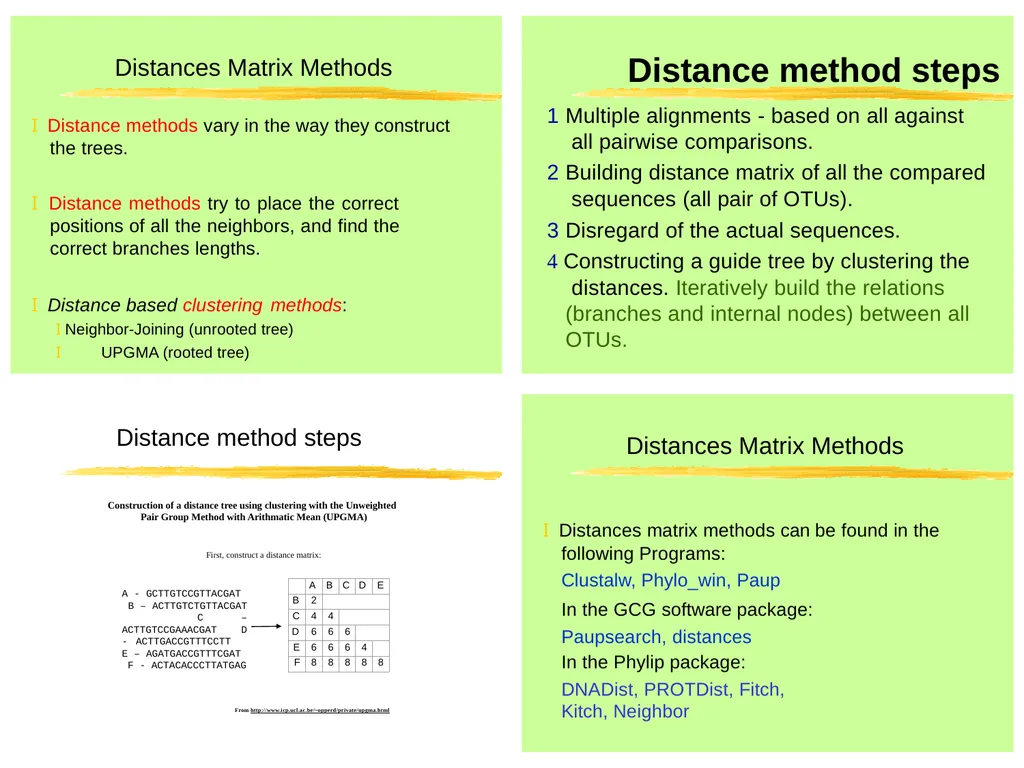
Constructing a guide tree by clustering the distances. Iteratively build the relations (branches and internal nodes) between all OTUs. Distance method steps Construction of a distance tree using clustering with the Unweighted Pair Group Method with Arithmatic Mean (UPGMA)
First, construct a distance matrix: From http://www.icp.ucl.ac.be/~opperd/private/upgma.html A - GCTTGTCCGTTACGAT B – ACTTGTCTGTTACGAT C – ACTTGTCCGAAACGAT D - ACTTGACCGTTTCCTT E – AGATGACCGTTTCGAT F - ACTACACCCTTATGAG Distances Matrix Methods I Distances matrix methods can be found in the following Programs:
Clustalw, Phylo_win, Paup
In the GCG software package: Paupsearch, distances
In the Phylip package:
DNADist, PROTDist, Fitch, Kitch, Neighbor<br>
I Distance methods try to place the correct positions of all the neighbors, and find the correct branches lengths.
I Distance based clustering methods:
I Neighbor-Joining (unrooted tree)
I UPGMA (rooted tree) Distance method steps Multiple alignments - based on all against all pairwise comparisons.
Building distance matrix of all the compared sequences (all pair of OTUs).
Disregard of the actual sequences.
Constructing a guide tree by clustering the distances. Iteratively build the relations (branches and internal nodes) between all OTUs. Distance method steps Construction of a distance tree using clustering with the Unweighted Pair Group Method with Arithmatic Mean (UPGMA)
First, construct a distance matrix: From http://www.icp.ucl.ac.be/~opperd/private/upgma.html A - GCTTGTCCGTTACGAT B – ACTTGTCTGTTACGAT C – ACTTGTCCGAAACGAT D - ACTTGACCGTTTCCTT E – AGATGACCGTTTCGAT F - ACTACACCCTTATGAG Distances Matrix Methods I Distances matrix methods can be found in the following Programs:
Clustalw, Phylo_win, Paup
In the GCG software package: Paupsearch, distances
In the Phylip package:
DNADist, PROTDist, Fitch, Kitch, Neighbor<br>