
Physical geography fieldwork enquiry: How and why
T
Published · 4 slides · 0 views

1 / 1
Description
Physical geography fieldwork enquiry: How and why does Cold Knap Beach change from west to east? Human geography fieldwork enquiry: Do social inequalities exist in Bristol? Lawrence Hill Stoke Bishop Site 1 Site 2 Fieldwork Process: Reasons
Related Topics
Share
Embed code
Download this presentation From Below
"Physical geography fieldwork enquiry: How and why" is the property of its rightful owner. Permission is granted to download and print the materials on this website for personal, non-commercial use only, and to display it on your personal computer provided you do not modify the materials and that you retain all copyright notices contained in the materials. By downloading content from our website, you accept the terms of this agreement.
Presentation Transcript
01
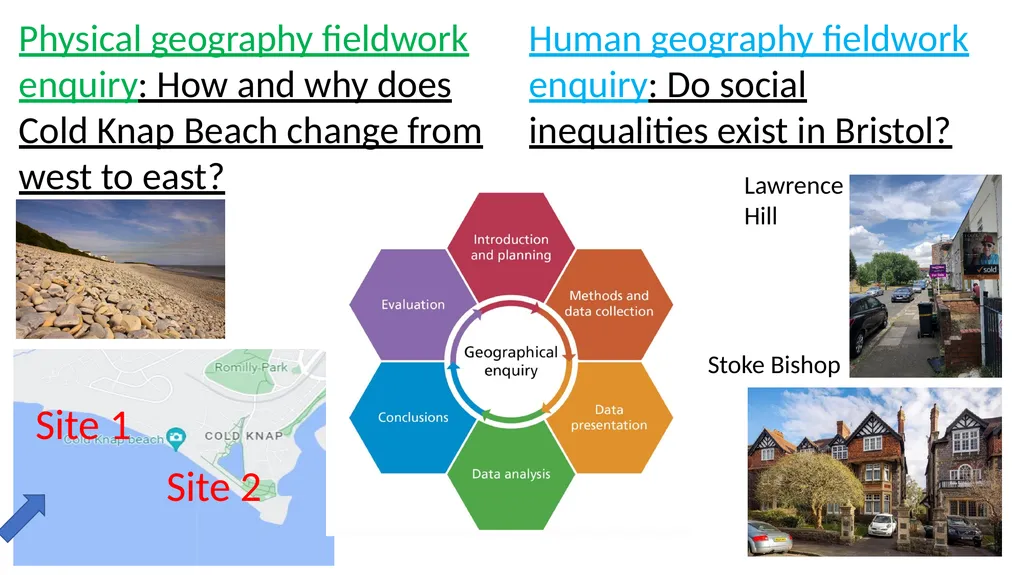
Physical geography fieldwork enquiry: How and why does Cold Knap Beach change from west to east? Human geography fieldwork enquiry: Do social inequalities exist in Bristol? Lawrence Hill Stoke Bishop Site 1 Site 2<br>
02
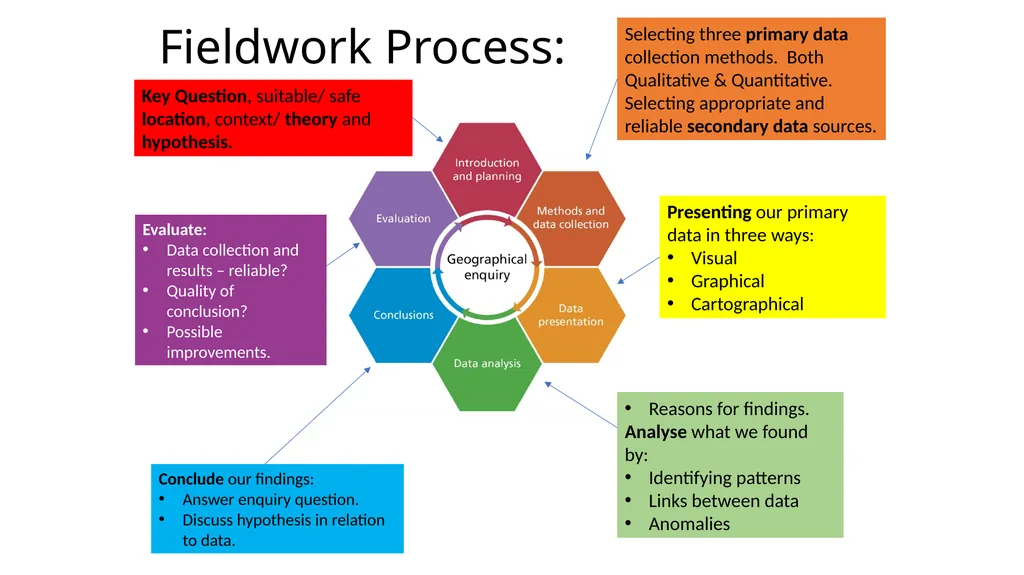
Fieldwork Process: Reasons for findings.
Analyse what we found by:
Identifying patterns
Links between data
Anomalies Conclude our findings:
Answer enquiry question.
Discuss hypothesis in relation to data. Evaluate:
Data collection and results – reliable?
Quality of conclusion?
Possible improvements.<br>
Analyse what we found by:
Identifying patterns
Links between data
Anomalies Conclude our findings:
Answer enquiry question.
Discuss hypothesis in relation to data. Evaluate:
Data collection and results – reliable?
Quality of conclusion?
Possible improvements.<br>
03
Physical geography fieldwork enquiry: How and why does Cold Knapp Beach Change from west to east?
Hypothesis: Site 2 (East) will have smaller round sediment and a wider/steeper beach.
Why is this location suitable for our enquiry?
Cold Knapp Beach has a wide pebble beach open to the SW prevailing wind.There is public-access and it is safe to walk along as the cliff is secure and tidal range small.
Risks and management strategies:
Falling in the Bristol Channel– stay at least 2 meters from the sea.
Getting lost – orientate using map, be aware of meeting points.
Slips, trips and falls – wear appropriate sturdy footwear.
Theory: Cold Knapp each experiences a SW prevailing wind, therefore swash will move towards the NE, therefore longshore drift will move in an E direction, attrition will also reduce the size of sediment the more LSD has occurred on the pebbles.
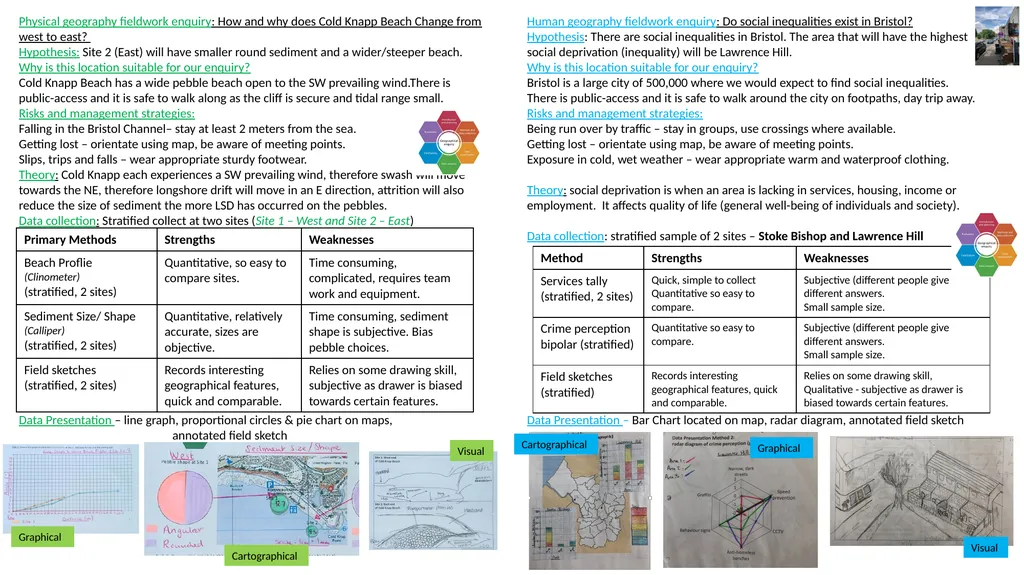
Data collection: Stratified collect at two sites (Site 1 – West and Site 2 – East)
Data Presentation – line graph, proportional circles & pie chart on maps, annotated field sketch Human geography fieldwork enquiry: Do social inequalities exist in Bristol?
Hypothesis: There are social inequalities in Bristol. The area that will have the highest social deprivation (inequality) will be Lawrence Hill.
Why is this location suitable for our enquiry?
Bristol is a large city of 500,000 where we would expect to find social inequalities.
There is public-access and it is safe to walk around the city on footpaths, day trip away.
Risks and management strategies:
Being run over by traffic – stay in groups, use crossings where available.
Getting lost – orientate using map, be aware of meeting points.
Exposure in cold, wet weather – wear appropriate warm and waterproof clothing.
Theory: social deprivation is when an area is lacking in services, housing, income or employment. It affects quality of life (general well-being of individuals and society).
Data collection: stratified sample of 2 sites – Stoke Bishop and Lawrence Hill
Data Presentation – Bar Chart located on map, radar diagram, annotated field sketch Visual Cartographical Graphical Visual Cartographical Graphical<br>
Hypothesis: Site 2 (East) will have smaller round sediment and a wider/steeper beach.
Why is this location suitable for our enquiry?
Cold Knapp Beach has a wide pebble beach open to the SW prevailing wind.There is public-access and it is safe to walk along as the cliff is secure and tidal range small.
Risks and management strategies:
Falling in the Bristol Channel– stay at least 2 meters from the sea.
Getting lost – orientate using map, be aware of meeting points.
Slips, trips and falls – wear appropriate sturdy footwear.
Theory: Cold Knapp each experiences a SW prevailing wind, therefore swash will move towards the NE, therefore longshore drift will move in an E direction, attrition will also reduce the size of sediment the more LSD has occurred on the pebbles.
Data collection: Stratified collect at two sites (Site 1 – West and Site 2 – East)
Data Presentation – line graph, proportional circles & pie chart on maps, annotated field sketch Human geography fieldwork enquiry: Do social inequalities exist in Bristol?
Hypothesis: There are social inequalities in Bristol. The area that will have the highest social deprivation (inequality) will be Lawrence Hill.
Why is this location suitable for our enquiry?
Bristol is a large city of 500,000 where we would expect to find social inequalities.
There is public-access and it is safe to walk around the city on footpaths, day trip away.
Risks and management strategies:
Being run over by traffic – stay in groups, use crossings where available.
Getting lost – orientate using map, be aware of meeting points.
Exposure in cold, wet weather – wear appropriate warm and waterproof clothing.
Theory: social deprivation is when an area is lacking in services, housing, income or employment. It affects quality of life (general well-being of individuals and society).
Data collection: stratified sample of 2 sites – Stoke Bishop and Lawrence Hill
Data Presentation – Bar Chart located on map, radar diagram, annotated field sketch Visual Cartographical Graphical Visual Cartographical Graphical<br>
04
Physical geography fieldwork enquiry: How and why does Cold Knapp Beach Change from west to east?
Secondary Data
No secondary data was used.
Analysis
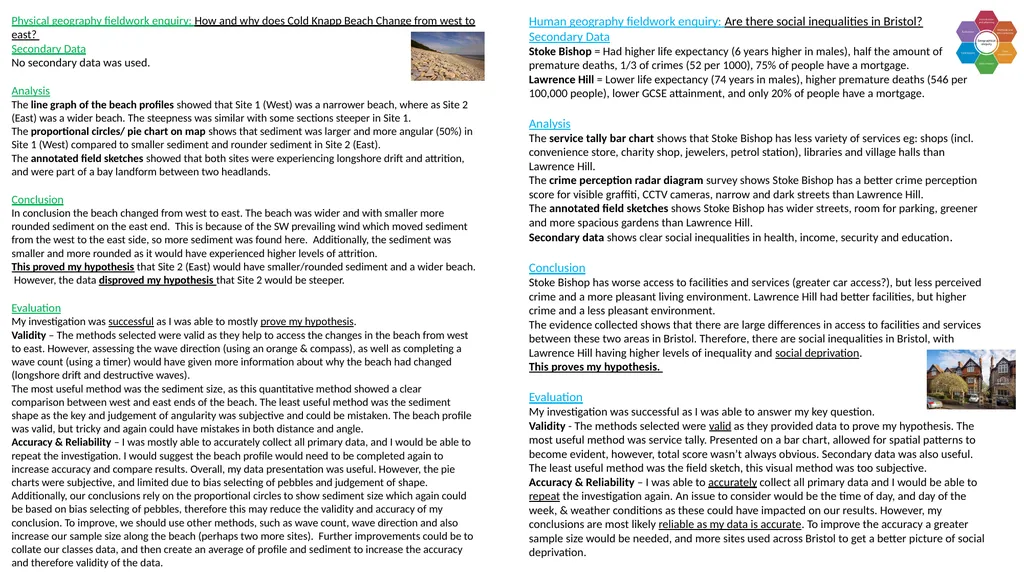
The line graph of the beach profiles showed that Site 1 (West) was a narrower beach, where as Site 2 (East) was a wider beach. The steepness was similar with some sections steeper in Site 1.
The proportional circles/ pie chart on map shows that sediment was larger and more angular (50%) in Site 1 (West) compared to smaller sediment and rounder sediment in Site 2 (East).
The annotated field sketches showed that both sites were experiencing longshore drift and attrition, and were part of a bay landform between two headlands.
Conclusion
In conclusion the beach changed from west to east. The beach was wider and with smaller more rounded sediment on the east end. This is because of the SW prevailing wind which moved sediment from the west to the east side, so more sediment was found here. Additionally, the sediment was smaller and more rounded as it would have experienced higher levels of attrition.
This proved my hypothesis that Site 2 (East) would have smaller/rounded sediment and a wider beach. However, the data disproved my hypothesis that Site 2 would be steeper.
Evaluation
My investigation was successful as I was able to mostly prove my hypothesis.
Validity – The methods selected were valid as they help to access the changes in the beach from west to east. However, assessing the wave direction (using an orange & compass), as well as completing a wave count (using a timer) would have given more information about why the beach had changed (longshore drift and destructive waves).
The most useful method was the sediment size, as this quantitative method showed a clear comparison between west and east ends of the beach. The least useful method was the sediment shape as the key and judgement of angularity was subjective and could be mistaken. The beach profile was valid, but tricky and again could have mistakes in both distance and angle.
Accuracy & Reliability – I was mostly able to accurately collect all primary data, and I would be able to repeat the investigation. I would suggest the beach profile would need to be completed again to increase accuracy and compare results. Overall, my data presentation was useful. However, the pie charts were subjective, and limited due to bias selecting of pebbles and judgement of shape. Additionally, our conclusions rely on the proportional circles to show sediment size which again could be based on bias selecting of pebbles, therefore this may reduce the validity and accuracy of my conclusion. To improve, we should use other methods, such as wave count, wave direction and also increase our sample size along the beach (perhaps two more sites). Further improvements could be to collate our classes data, and then create an average of profile and sediment to increase the accuracy and therefore validity of the data. Human geography fieldwork enquiry: Are there social inequalities in Bristol?
Secondary Data
Stoke Bishop = Had higher life expectancy (6 years higher in males), half the amount of premature deaths, 1/3 of crimes (52 per 1000), 75% of people have a mortgage.
Lawrence Hill = Lower life expectancy (74 years in males), higher premature deaths (546 per 100,000 people), lower GCSE attainment, and only 20% of people have a mortgage.
Analysis
The service tally bar chart shows that Stoke Bishop has less variety of services eg: shops (incl. convenience store, charity shop, jewelers, petrol station), libraries and village halls than Lawrence Hill.
The crime perception radar diagram survey shows Stoke Bishop has a better crime perception score for visible graffiti, CCTV cameras, narrow and dark streets than Lawrence Hill.
The annotated field sketches shows Stoke Bishop has wider streets, room for parking, greener and more spacious gardens than Lawrence Hill.
Secondary data shows clear social inequalities in health, income, security and education.
Conclusion
Stoke Bishop has worse access to facilities and services (greater car access?), but less perceived crime and a more pleasant living environment. Lawrence Hill had better facilities, but higher crime and a less pleasant environment.
The evidence collected shows that there are large differences in access to facilities and services between these two areas in Bristol. Therefore, there are social inequalities in Bristol, with Lawrence Hill having higher levels of inequality and social deprivation.
This proves my hypothesis.
Evaluation
My investigation was successful as I was able to answer my key question.
Validity - The methods selected were valid as they provided data to prove my hypothesis. The most useful method was service tally. Presented on a bar chart, allowed for spatial patterns to become evident, however, total score wasn’t always obvious. Secondary data was also useful. The least useful method was the field sketch, this visual method was too subjective.
Accuracy & Reliability – I was able to accurately collect all primary data and I would be able to repeat the investigation again. An issue to consider would be the time of day, and day of the week, & weather conditions as these could have impacted on our results. However, my conclusions are most likely reliable as my data is accurate. To improve the accuracy a greater sample size would be needed, and more sites used across Bristol to get a better picture of social deprivation.<br>
Secondary Data
No secondary data was used.
Analysis
The line graph of the beach profiles showed that Site 1 (West) was a narrower beach, where as Site 2 (East) was a wider beach. The steepness was similar with some sections steeper in Site 1.
The proportional circles/ pie chart on map shows that sediment was larger and more angular (50%) in Site 1 (West) compared to smaller sediment and rounder sediment in Site 2 (East).
The annotated field sketches showed that both sites were experiencing longshore drift and attrition, and were part of a bay landform between two headlands.
Conclusion
In conclusion the beach changed from west to east. The beach was wider and with smaller more rounded sediment on the east end. This is because of the SW prevailing wind which moved sediment from the west to the east side, so more sediment was found here. Additionally, the sediment was smaller and more rounded as it would have experienced higher levels of attrition.
This proved my hypothesis that Site 2 (East) would have smaller/rounded sediment and a wider beach. However, the data disproved my hypothesis that Site 2 would be steeper.
Evaluation
My investigation was successful as I was able to mostly prove my hypothesis.
Validity – The methods selected were valid as they help to access the changes in the beach from west to east. However, assessing the wave direction (using an orange & compass), as well as completing a wave count (using a timer) would have given more information about why the beach had changed (longshore drift and destructive waves).
The most useful method was the sediment size, as this quantitative method showed a clear comparison between west and east ends of the beach. The least useful method was the sediment shape as the key and judgement of angularity was subjective and could be mistaken. The beach profile was valid, but tricky and again could have mistakes in both distance and angle.
Accuracy & Reliability – I was mostly able to accurately collect all primary data, and I would be able to repeat the investigation. I would suggest the beach profile would need to be completed again to increase accuracy and compare results. Overall, my data presentation was useful. However, the pie charts were subjective, and limited due to bias selecting of pebbles and judgement of shape. Additionally, our conclusions rely on the proportional circles to show sediment size which again could be based on bias selecting of pebbles, therefore this may reduce the validity and accuracy of my conclusion. To improve, we should use other methods, such as wave count, wave direction and also increase our sample size along the beach (perhaps two more sites). Further improvements could be to collate our classes data, and then create an average of profile and sediment to increase the accuracy and therefore validity of the data. Human geography fieldwork enquiry: Are there social inequalities in Bristol?
Secondary Data
Stoke Bishop = Had higher life expectancy (6 years higher in males), half the amount of premature deaths, 1/3 of crimes (52 per 1000), 75% of people have a mortgage.
Lawrence Hill = Lower life expectancy (74 years in males), higher premature deaths (546 per 100,000 people), lower GCSE attainment, and only 20% of people have a mortgage.
Analysis
The service tally bar chart shows that Stoke Bishop has less variety of services eg: shops (incl. convenience store, charity shop, jewelers, petrol station), libraries and village halls than Lawrence Hill.
The crime perception radar diagram survey shows Stoke Bishop has a better crime perception score for visible graffiti, CCTV cameras, narrow and dark streets than Lawrence Hill.
The annotated field sketches shows Stoke Bishop has wider streets, room for parking, greener and more spacious gardens than Lawrence Hill.
Secondary data shows clear social inequalities in health, income, security and education.
Conclusion
Stoke Bishop has worse access to facilities and services (greater car access?), but less perceived crime and a more pleasant living environment. Lawrence Hill had better facilities, but higher crime and a less pleasant environment.
The evidence collected shows that there are large differences in access to facilities and services between these two areas in Bristol. Therefore, there are social inequalities in Bristol, with Lawrence Hill having higher levels of inequality and social deprivation.
This proves my hypothesis.
Evaluation
My investigation was successful as I was able to answer my key question.
Validity - The methods selected were valid as they provided data to prove my hypothesis. The most useful method was service tally. Presented on a bar chart, allowed for spatial patterns to become evident, however, total score wasn’t always obvious. Secondary data was also useful. The least useful method was the field sketch, this visual method was too subjective.
Accuracy & Reliability – I was able to accurately collect all primary data and I would be able to repeat the investigation again. An issue to consider would be the time of day, and day of the week, & weather conditions as these could have impacted on our results. However, my conclusions are most likely reliable as my data is accurate. To improve the accuracy a greater sample size would be needed, and more sites used across Bristol to get a better picture of social deprivation.<br>