Price and Supply Risk Forecasting June 2023 Arthurnelle Wade Life Science Commodity Manager Systemwide Procurement, UCOP 1.U.S. Bureau of Labor Statistics May 2023 release June 2023. 2.BLS releases data for San Diego, Riverside Area, and
Related Topics
Share
Embed code
Download this presentation From Below
"Price and Supply Risk Forecasting June 2023" is the property of its rightful owner. Permission is granted to
download and print the materials on this website for personal, non-commercial use only, and to display it
on your personal computer provided you do not modify the materials and that you retain all copyright
notices contained in the materials. By downloading content from our website, you accept the terms of this
agreement.
Presentation Transcript
01
Price and Supply Risk Forecasting June 2023 Arthurnelle Wade
Life Science Commodity Manager
Systemwide Procurement, UCOP<br>
02
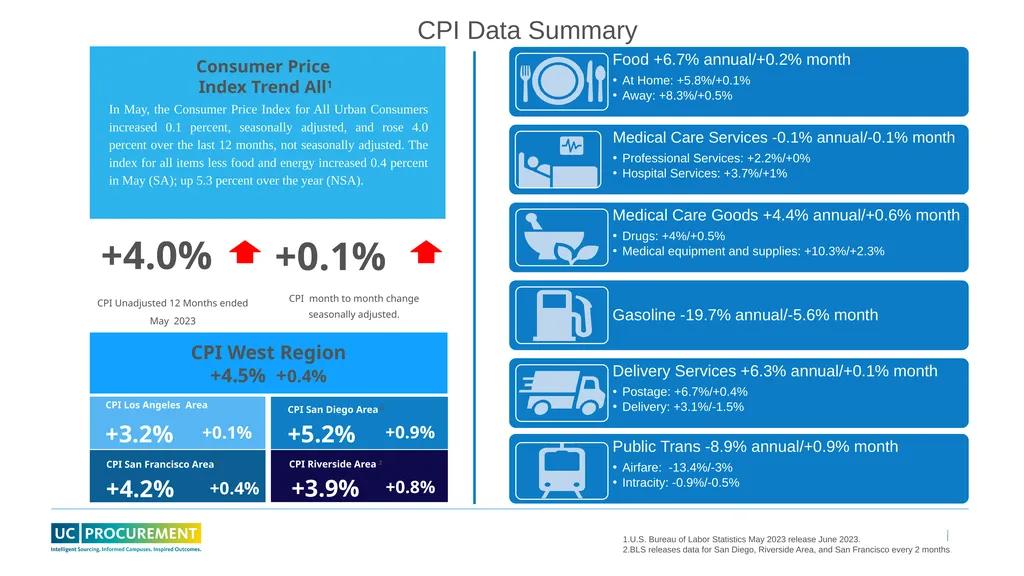
1.U.S. Bureau of Labor Statistics May 2023 release June 2023.
2.BLS releases data for San Diego, Riverside Area, and San Francisco every 2 months. CPI Data Summary CPI West Region
+4.5% +0.4%<br>
03
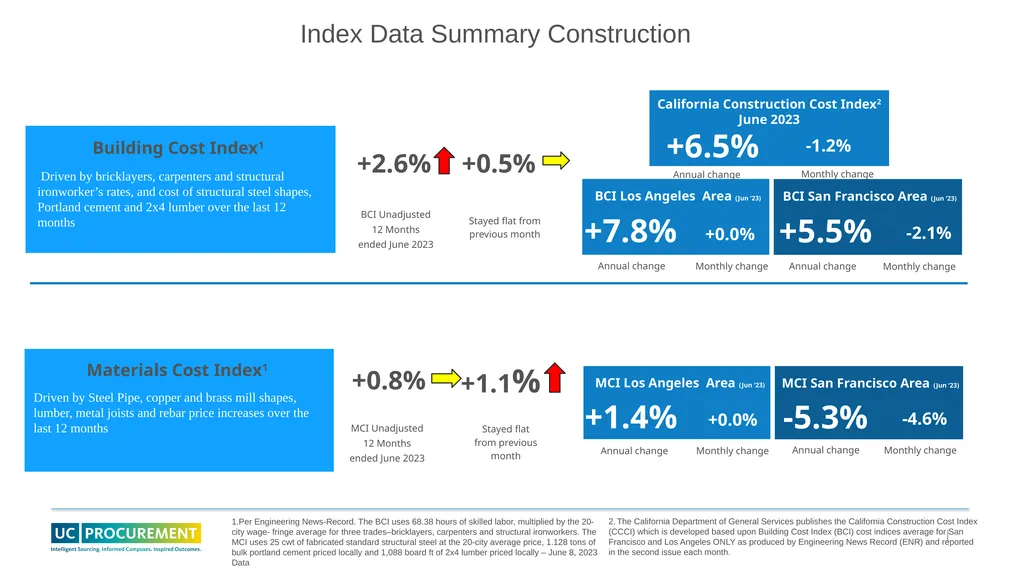
1.Per Engineering News-Record. The BCI uses 68.38 hours of skilled labor, multiplied by the 20-city wage- fringe average for three trades–bricklayers, carpenters and structural ironworkers. The MCI uses 25 cwt of fabricated standard structural steel at the 20-city average price, 1.128 tons of bulk portland cement priced locally and 1,088 board ft of 2x4 lumber priced locally – June 8, 2023 Data Index Data Summary Construction 2. The California Department of General Services publishes the California Construction Cost Index (CCCI) which is developed based upon Building Cost Index (BCI) cost indices average for San Francisco and Los Angeles ONLY as produced by Engineering News Record (ENR) and reported in the second issue each month.<br>
04
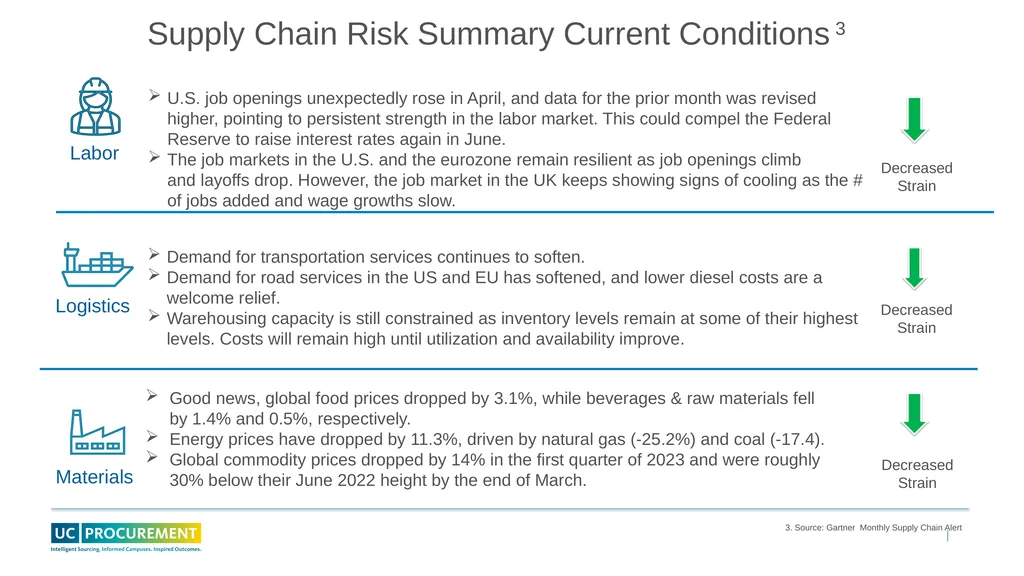
3. Source: Gartner Monthly Supply Chain Alert Supply Chain Risk Summary Current Conditions 3 Labor Logistics Materials Decreased Strain Decreased Strain Decreased Strain Good news, global food prices dropped by 3.1%, while beverages & raw materials fell by 1.4% and 0.5%, respectively.
Energy prices have dropped by 11.3%, driven by natural gas (-25.2%) and coal (-17.4).
Global commodity prices dropped by 14% in the first quarter of 2023 and were roughly 30% below their June 2022 height by the end of March. Demand for transportation services continues to soften.
Demand for road services in the US and EU has softened, and lower diesel costs are a welcome relief.
Warehousing capacity is still constrained as inventory levels remain at some of their highest levels. Costs will remain high until utilization and availability improve. U.S. job openings unexpectedly rose in April, and data for the prior month was revised higher, pointing to persistent strength in the labor market. This could compel the Federal Reserve to raise interest rates again in June.
The job markets in the U.S. and the eurozone remain resilient as job openings climb and layoffs drop. However, the job market in the UK keeps showing signs of cooling as the # of jobs added and wage growths slow.<br>
05
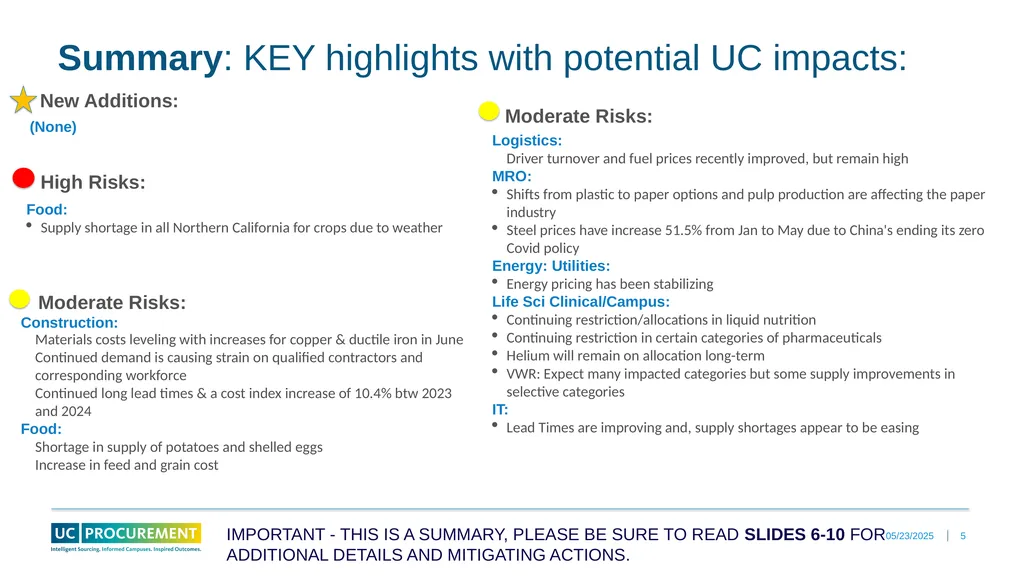
6/22/2023 5 Summary: KEY highlights with potential UC impacts: IMPORTANT - THIS IS A SUMMARY, PLEASE BE SURE TO READ SLIDES 6-10 FOR ADDITIONAL DETAILS AND MITIGATING ACTIONS. High Risks: Moderate Risks: Food:
Supply shortage in all Northern California for crops due to weather Logistics:
Driver turnover and fuel prices recently improved, but remain high
MRO:
Shifts from plastic to paper options and pulp production are affecting the paper industry
Steel prices have increase 51.5% from Jan to May due to China's ending its zero Covid policy
Energy: Utilities:
Energy pricing has been stabilizing
Life Sci Clinical/Campus:
Continuing restriction/allocations in liquid nutrition
Continuing restriction in certain categories of pharmaceuticals
Helium will remain on allocation long-term
VWR: Expect many impacted categories but some supply improvements in selective categories
IT:
Lead Times are improving and, supply shortages appear to be easing New Additions: (None) Materials costs leveling with increases for copper & ductile iron in June
Continued demand is causing strain on qualified contractors and corresponding workforce
Continued long lead times & a cost index increase of 10.4% btw 2023 and 2024
Food:
Shortage in supply of potatoes and shelled eggs
Increase in feed and grain cost Moderate Risks: Construction:<br>
06
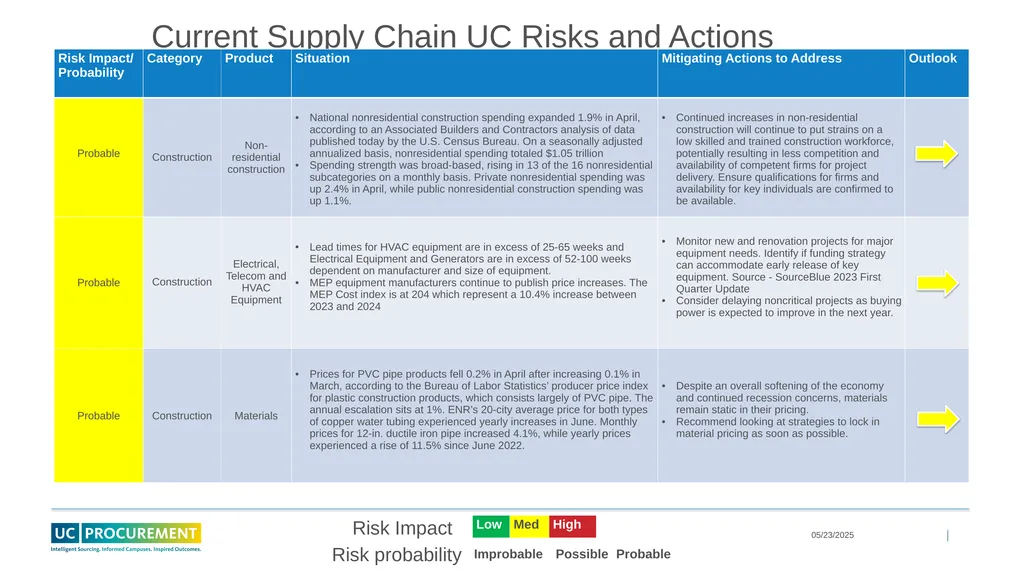
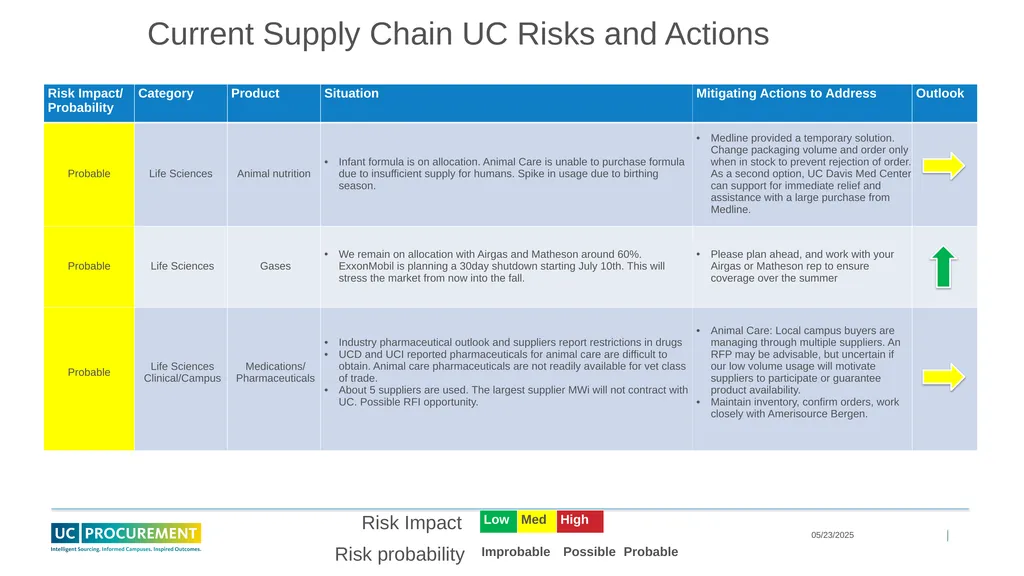
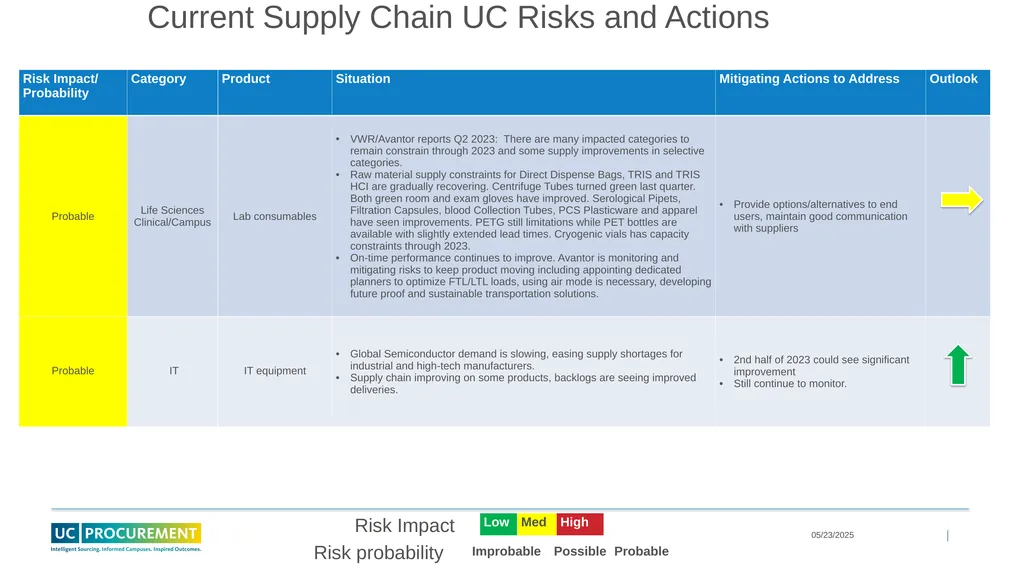
6/22/2023 Current Supply Chain UC Risks and Actions Risk probability Risk Impact<br>
07
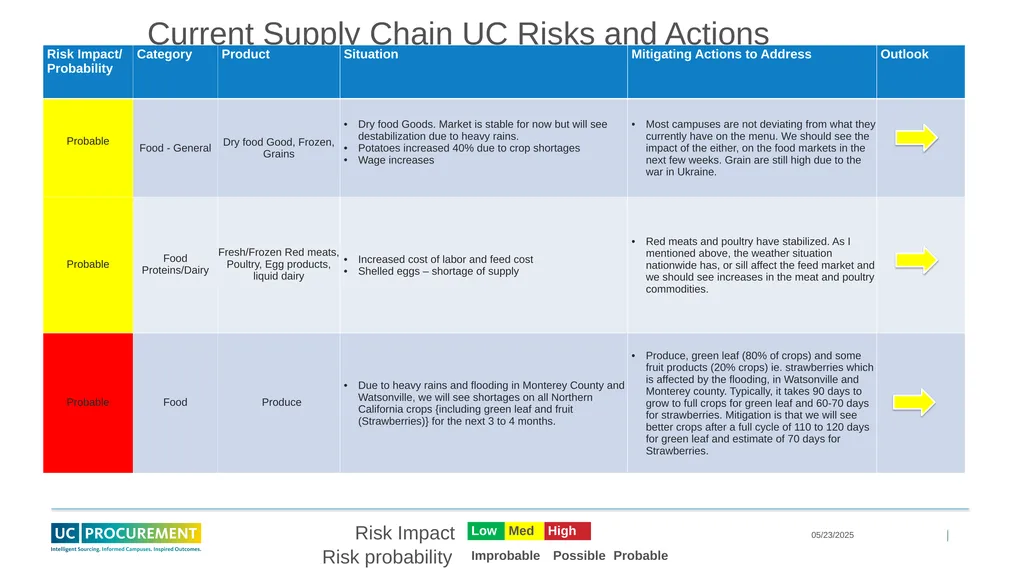
6/22/2023 Current Supply Chain UC Risks and Actions Risk probability Risk Impact<br>
08
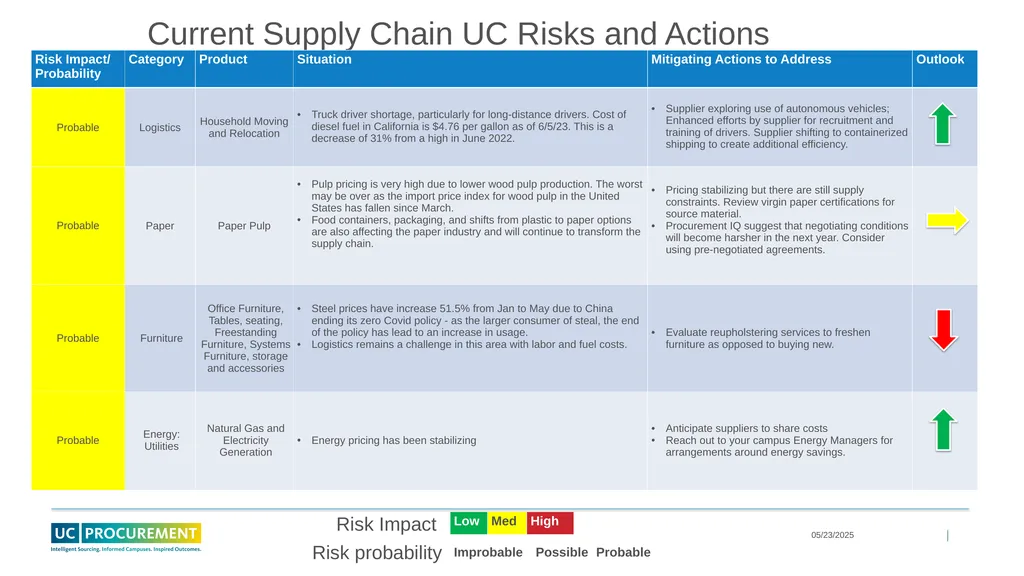
6/22/2023 Current Supply Chain UC Risks and Actions Risk probability Risk Impact <br>
09
6/22/2023 Current Supply Chain UC Risks and Actions Risk probability Risk Impact<br>
10
6/22/2023 Current Supply Chain UC Risks and Actions Risk probability Risk Impact<br>
11
Thank You Questions or Feedback, Please contact Arthurnelle Wade Arthurnelle.Wade@ucop.edu<br>