04
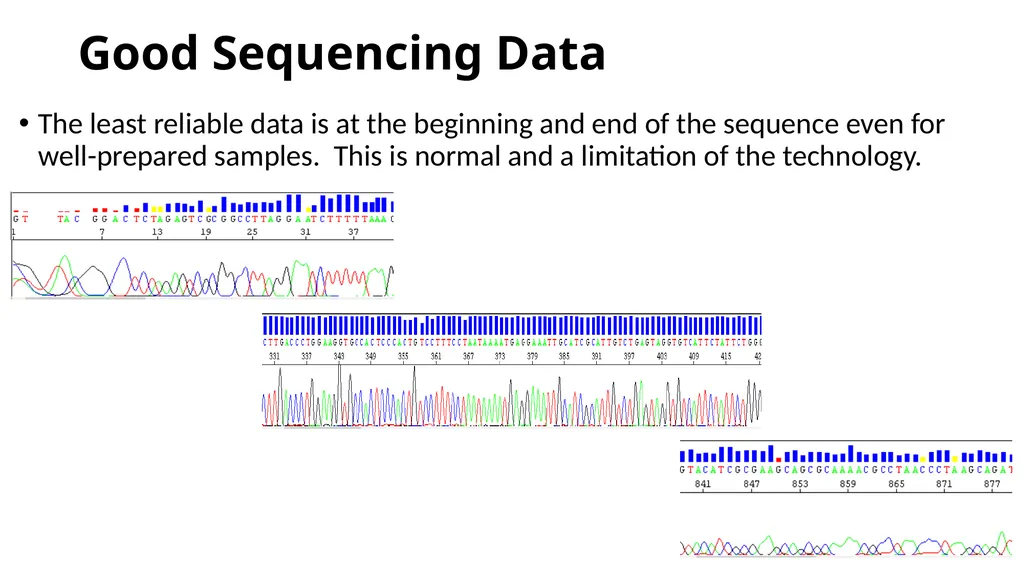
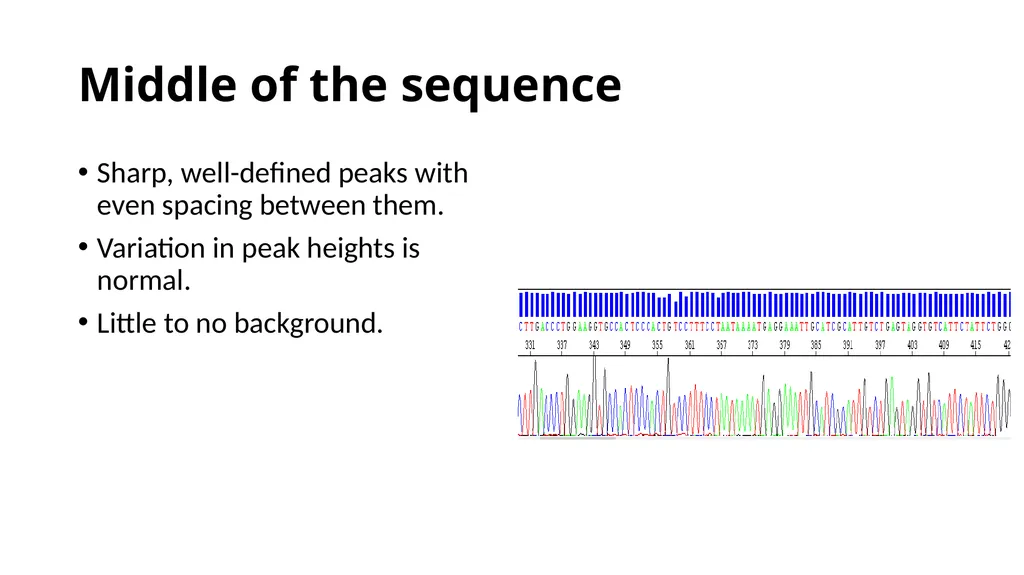
Middle of the sequence Sharp, well-defined peaks with even spacing between them.
Variation in peak heights is normal.
Little to no background.<br>
05
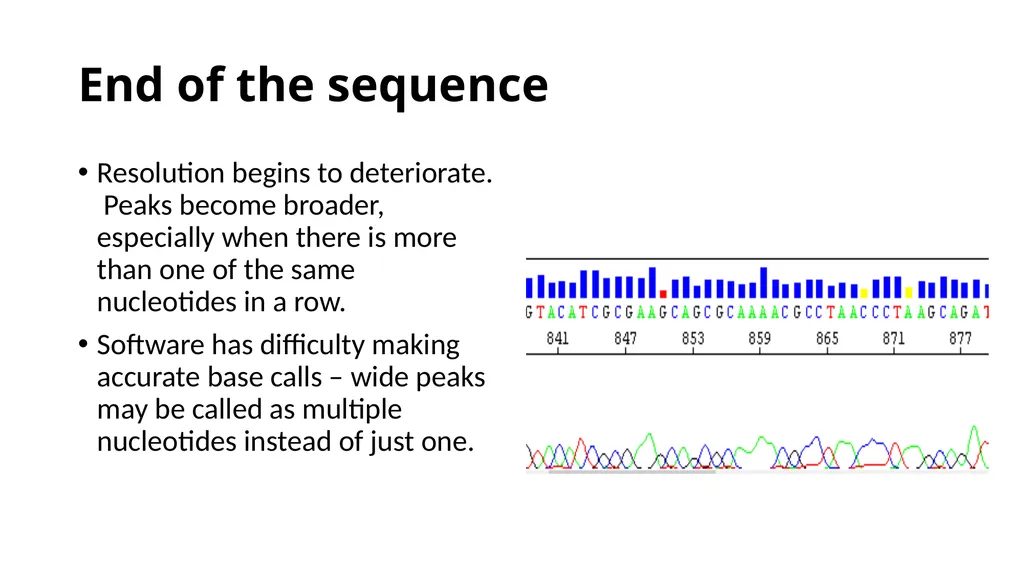
End of the sequence Resolution begins to deteriorate. Peaks become broader, especially when there is more than one of the same nucleotides in a row.
Software has difficulty making accurate base calls – wide peaks may be called as multiple nucleotides instead of just one.<br>
06
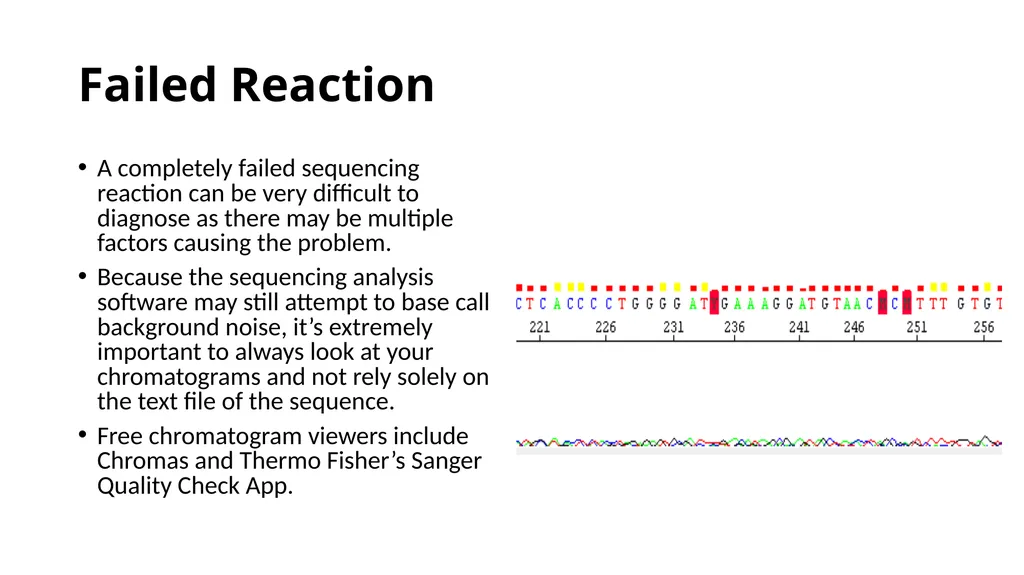
Failed Reaction A completely failed sequencing reaction can be very difficult to diagnose as there may be multiple factors causing the problem.
Because the sequencing analysis software may still attempt to base call background noise, it’s extremely important to always look at your chromatograms and not rely solely on the text file of the sequence.
Free chromatogram viewers include Chromas and Thermo Fisher’s Sanger Quality Check App.<br>
07
The two most common causes for sequencing failure or poor quality data are:��DNA Purity and Concentration<br>
08
DNA Purity and Quality Important for both quality data and to avoid damage to the DNA sequencer.<br>
09
Common Contaminants: Salts (EDTA, NaCl, NaOAc)
Do NOT submit your sample in TE buffer because EDTA chelates the magnesium required by the DNA Polymerase.
High levels of salts may also cause current instabilities which damage the capillary array.
Proteins, detergents (SDS, Triton X), organic chemicals (ethanol, chloroform, phenol), RNA
Note: Submit samples in water.<br>
10
DNA Purity and Quality Tips:
Avoid excessive freeze-thawing, exposure to UV light, etc. that DNA could degrade the DNA.
Some bacterial strains are better than others for template preparation.
Some strains are known to release large amounts of endonucleases, inhibitory factors, etc. during lysis that may be difficult to remove.
Don’t overload your plasmid prep kits as many impurities can be left behind.
Do not aggressively vortex during plasmid preps to avoid nicking the DNA.<br>
11
DNA Concentration�Both low template concentration and high template concentration cause problems. Low Concentration Results have low signal intensity.
Analysis software has difficulty in resolving the base peaks from background noise. High Concentration May cause electrophoresis issues by blocking the capillary and inhibiting the current, causing the sequencing reaction to move through the capillary abnormally.
Too much template can also deplete the dNTPs early in the sequencing reaction, leading to a premature termination of the reaction.<br>
12
Other Considerations Design your primer to function at the annealing temperature (60 C) that we use in the core.
Because of the volume of samples we process we must use consensus cycling conditions for everyone.
Double check your calculations to insure you are submitting the correct amount of template and primer.
Do not use genomic DNA as a template. First amplify the region of interest using PCR. Sequence directly from the PCR product or by cloning it into a plasmid.<br>
13
“My sample worked fine before but this time it failed.” Your sample may have a weak signal.
A weak sample may often “work” or fail when repeated.
This is because there is bleed through of signal from adjacent capillaries.
If your sample is in a capillary adjacent to a sample with a high signal, that sample’s signal will overpower the signal coming from your weak sample, making it appear as if it failed.
If your weak sample was run adjacent to a blank capillary it will appear to “work” albeit with low signal.
The signal from a neighboring capillary may be so strong that the sequence from that sample shows up in your data, making you think that the core has made a mistake in processing your samples.<br>
14
Troubleshooting Sequencing Data Dye Blobs
Spikes
Homopolymeric Regions
Hard Stops (Truncated Sequences)
Mixed Peaks
Primer Dimers
Primer N-1<br>
15
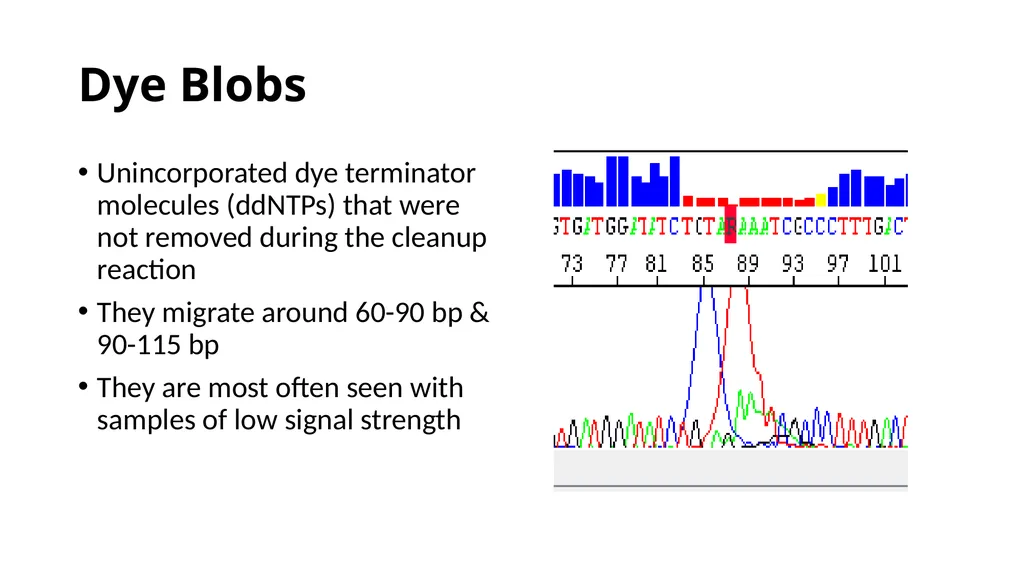
Dye Blobs Unincorporated dye terminator molecules (ddNTPs) that were not removed during the cleanup reaction
They migrate around 60-90 bp & 90-115 bp
They are most often seen with samples of low signal strength<br>
16
Causes of Dye Blobs Problem occurred during the sequencing clean up protocol.
Suboptimal sequencing reaction results in poor incorporation of ddNTPs, leading to an excess of unincorporated ddNTPs that can’t be removed by the clean up protocol.
Contaminates in the sample inhibited the sequencing reaction
Too little starting template means less overall proportion of ddNTPs are incorporated<br>
17
Solutions for Dye Blobs Optimize the sequencing reaction – make sure correct amounts of template and primer are used. Make sure template and primers are pure.
Sequence from the reverse direction to obtain the sequence obscured by the dye blob.
Design a primer further upstream so that the region of interest is no longer obscured by the dye blob.<br>
18
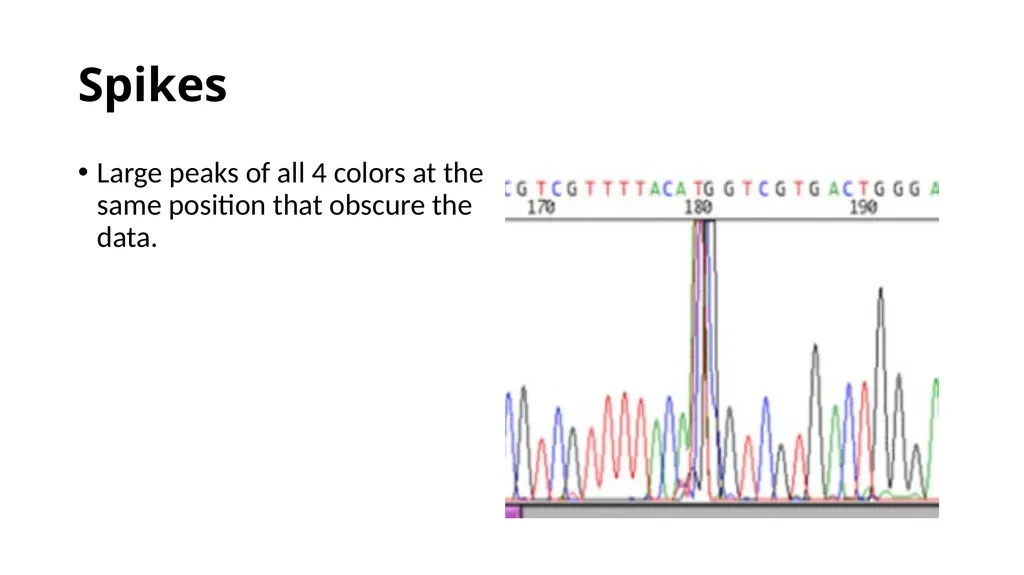
Spikes Large peaks of all 4 colors at the same position that obscure the data.<br>
19
Spikes Causes of Spikes Small air bubbles, dust, or polymer crystals moving in the capillary through the path of the laser beam causing the laser light to refract onto the CCD camera. Solution for Spikes Re-run sample<br>
20
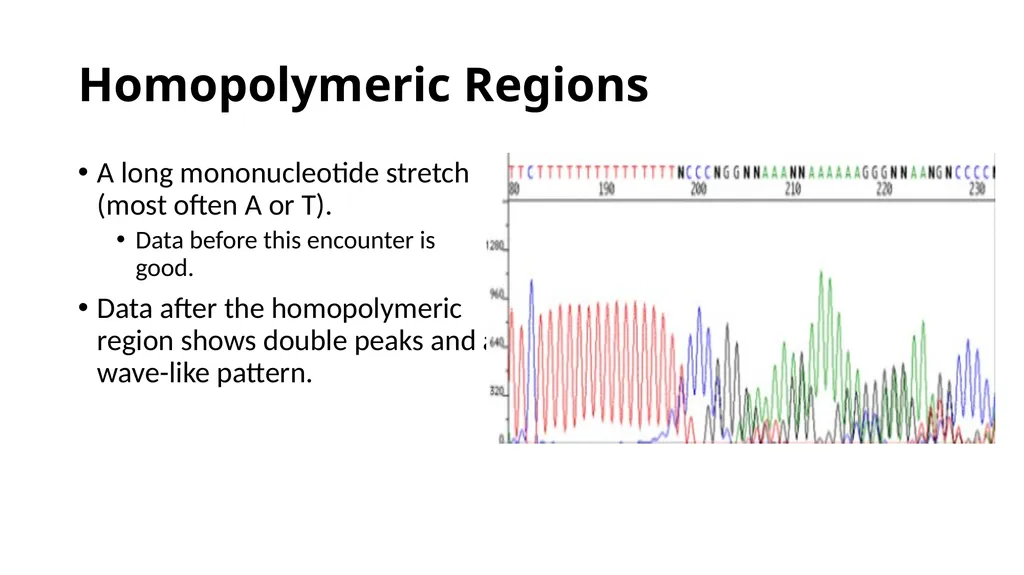
Homopolymeric Regions A long mononucleotide stretch (most often A or T).
Data before this encounter is good.
Data after the homopolymeric region shows double peaks and a wave-like pattern.<br>
21
What Causes Homopolymeric Regions? During the sequencing reaction the growing strand may dissociate and reanneal at an incorrect location in the homopolymeric region of the template. This results in the production of multiple products with varying lengths.<br>
22
Solutions for Homopolymeric Regions Try sequencing in the opposite direction.
It may help to design and use a primer which hybridizes close to the repeat region.
For poly A regions, use an oligo dT (12-15) primer containing C, A or G on the 3’ end as an anchor.<br>
23
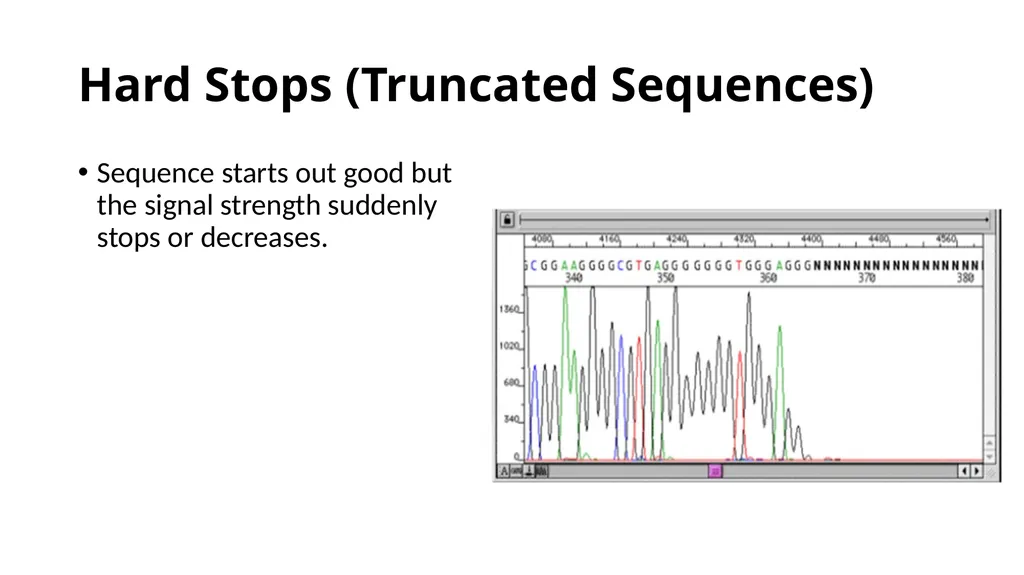
Hard Stops (Truncated Sequences) Sequence starts out good but the signal strength suddenly stops or decreases.<br>
24
Cause of Hard Stops The DNA polymerase has difficulty moving through particular sequences
Regions with a high percentage of G’s and/or C’s
Hairpins and secondary structures<br>
25
Solutions for Hard Stops The addition of a denaturant such as betaine or DMSO to the sequencing reaction may help.
Try sequencing the complementary strand.
Use a primer that binds close to the hairpin.
dGTP BigDye Terminator Cycle Sequencing Kit – not offered by the GSR due to cost ($1316/100 reactions)<br>
26
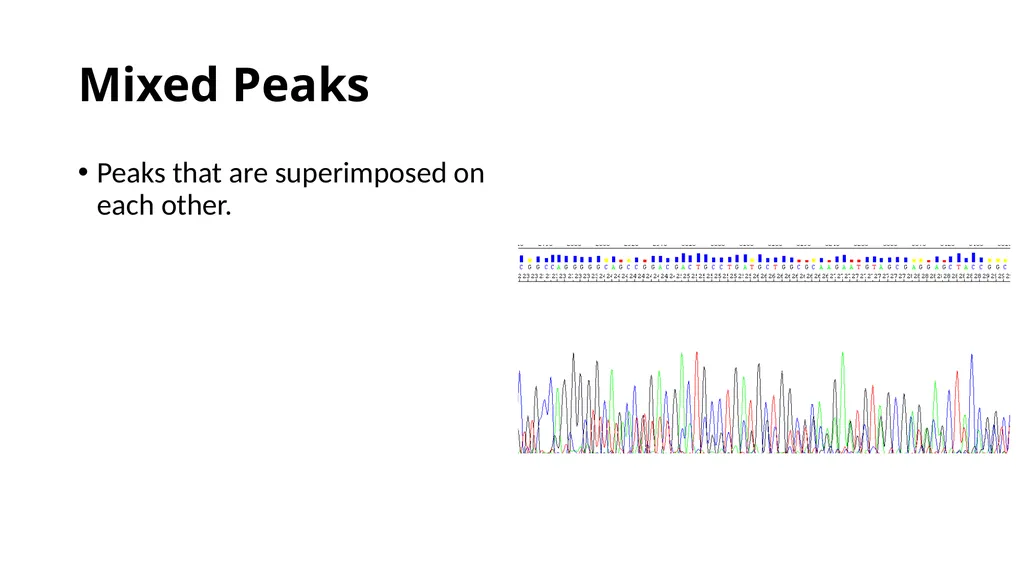
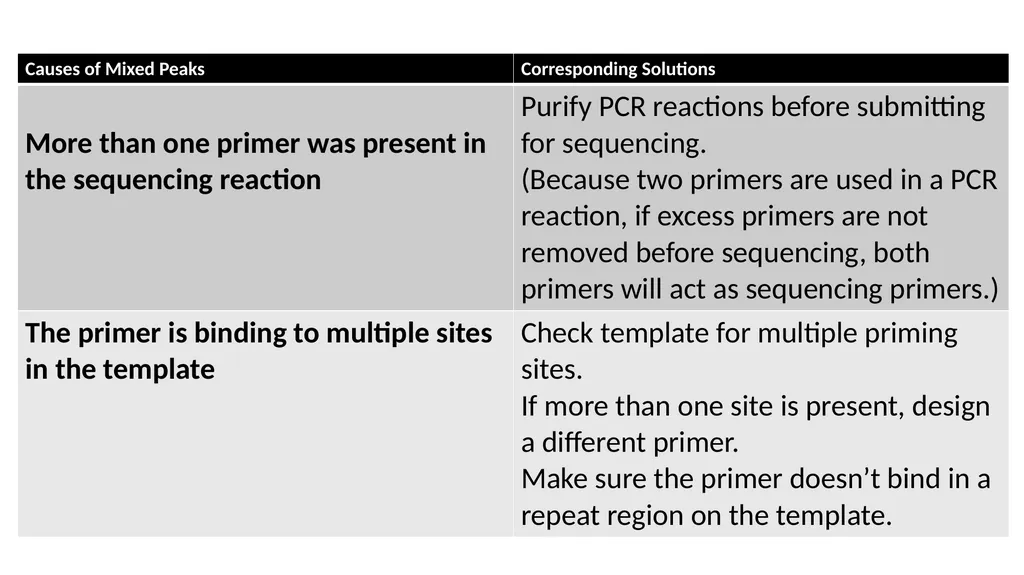
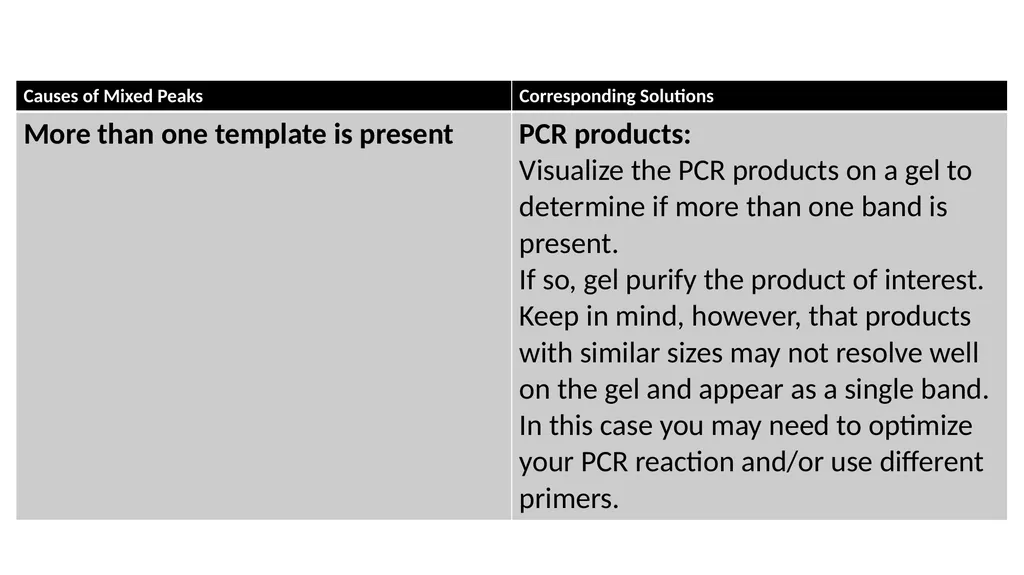
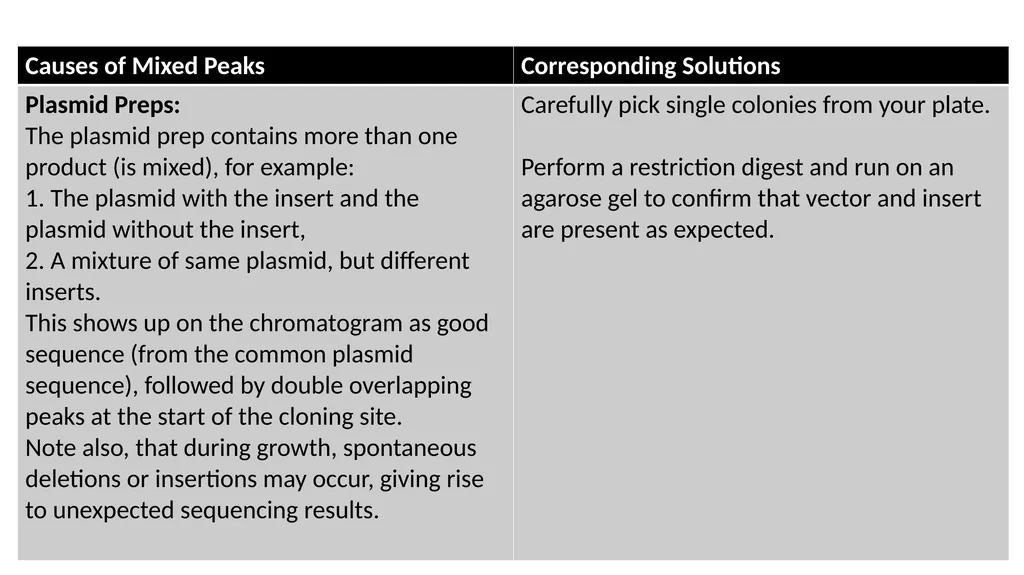
Mixed Peaks Peaks that are superimposed on each other.<br>
27
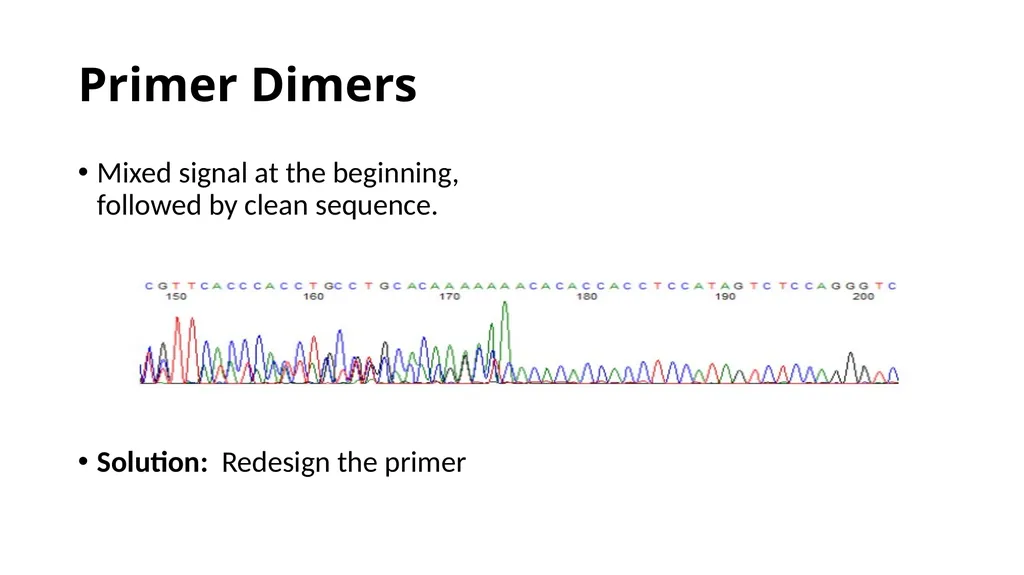
Primer Dimers Mixed signal at the beginning, followed by clean sequence.
Solution: Redesign the primer<br>
28
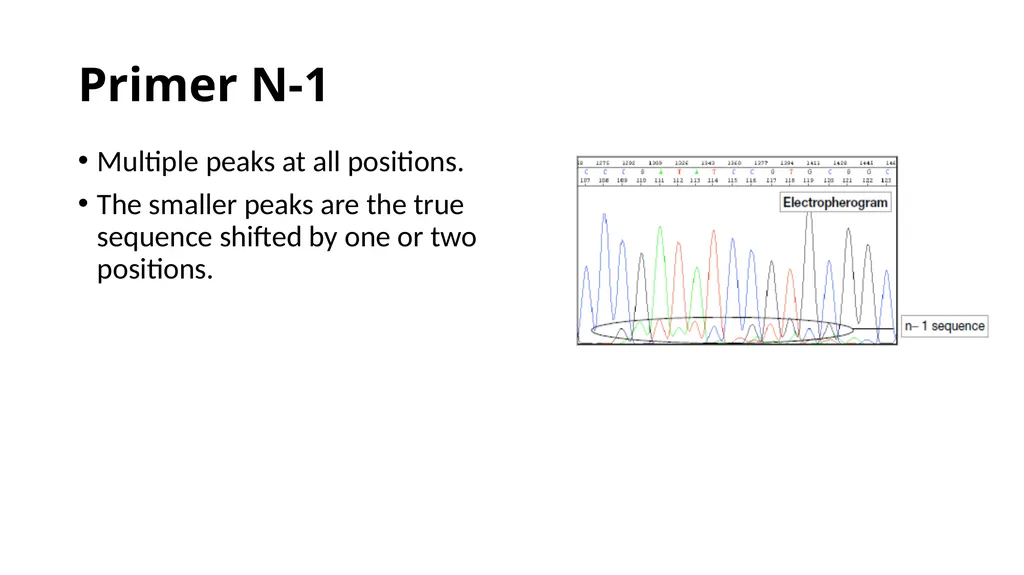
Primer N-1 Multiple peaks at all positions.
The smaller peaks are the true sequence shifted by one or two positions.<br>
29
Primer N-1 Cause Caused by poor quality synthesis of the primers which leads to a mixture of full length primers and primers missing one or two bases on the 5’end. Solution Resynthesize the primer<br>
30
When Submitting Samples DOs Label your tubes with consecutive #’s
Indicate on your form the name of your sample name that corresponds with the tube #
Submit a filled out printed form with your samples AND upload your form to eRAMP
Label your submission with the eRAMP # and your NAME (first and last) DON’Ts Don’t parafilm or tape your tubes together
Makes tubes difficult to separate and ink is removed when we remove parafilm/tape
Don’t use symbols in your sample names
Don’t submit more than 16 individual tubes
17+ put in strip tubes or plate
Don’t use flat bottom plates
Use only PCR plates so samples don’t evaporate and can be removed from wells easily.<br>