STEP OVERVIEW PRESENTATION TAKING THE NEXT S.T.E.P. IN SAFETY People Power Safety AGENDA STEP PURPOSE STEP VISION DEFINITIONS STEP PROCESS ELEMENTS EXPECTATIONS STEP CHECKLISTS STEP ACTIONS CONCLUSION PURPOSE We will achieve Safety Through
"STEP OVERVIEW PRESENTATION TAKING THE NEXT" is the property of its rightful owner. Permission is granted to
download and print the materials on this website for personal, non-commercial use only, and to display it
on your personal computer provided you do not modify the materials and that you retain all copyright
notices contained in the materials. By downloading content from our website, you accept the terms of this
agreement.
Presentation Transcript
01
STEP OVERVIEW PRESENTATION TAKING THE NEXT S.T.E.P. IN SAFETY<br>
02
People Power Safety<br>
03
AGENDA STEP PURPOSE
STEP VISION
DEFINITIONS
STEP PROCESS ELEMENTS
EXPECTATIONS
STEP CHECKLISTS
STEP ACTIONS
CONCLUSION<br>
04
PURPOSE We will achieve… Safety Through Everyone's Participation.
We will do this through actively engaging the department staff, contractors, and their craft to look out for the health and safety of each other.
We will identify and prevent situations that could result in serious injury or the loss of a life.
This information will be communicated on a regular bases with solutions and fixes.
We will strive to have better safety conversations<br>
05
To create a dependable, repeatable method to measure safety success using leading indicators instead of solely relying on RIR. STEP VISION<br>
06
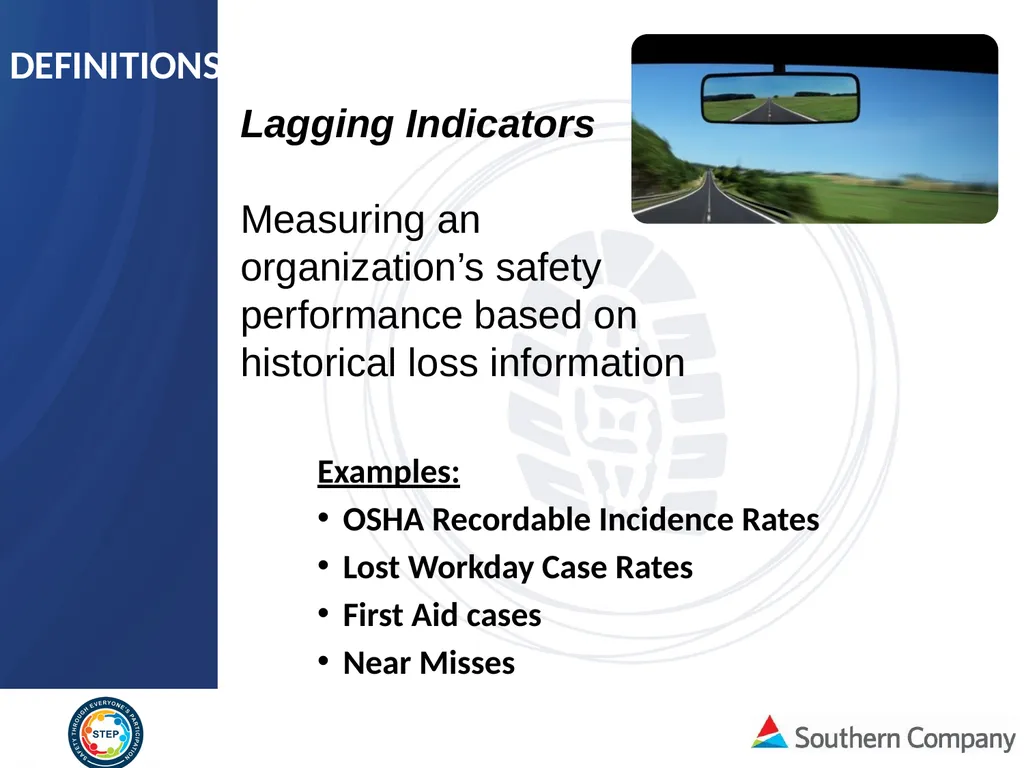
Lagging Indicators
Measuring an organization’s safety performance based on historical loss information Examples:
OSHA Recordable Incidence Rates
Lost Workday Case Rates
First Aid cases
Near Misses DEFINITIONS<br>
07
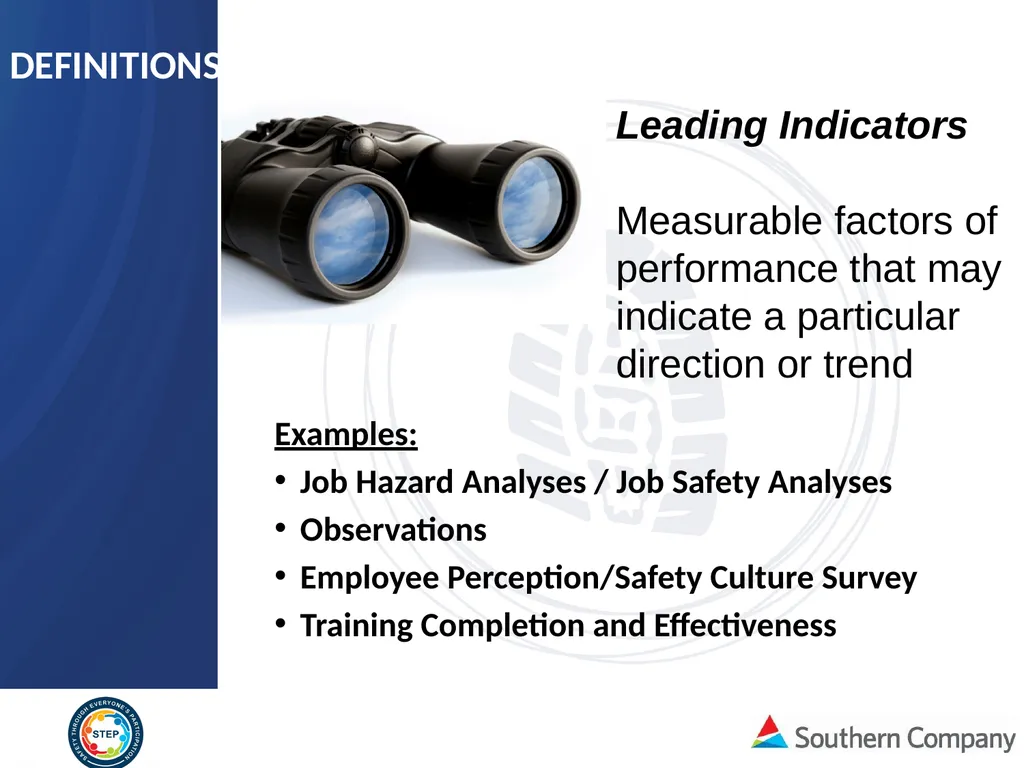
Leading Indicators
Measurable factors of performance that may indicate a particular direction or trend Examples:
Job Hazard Analyses / Job Safety Analyses
Observations
Employee Perception/Safety Culture Survey
Training Completion and Effectiveness DEFINITIONS<br>
08
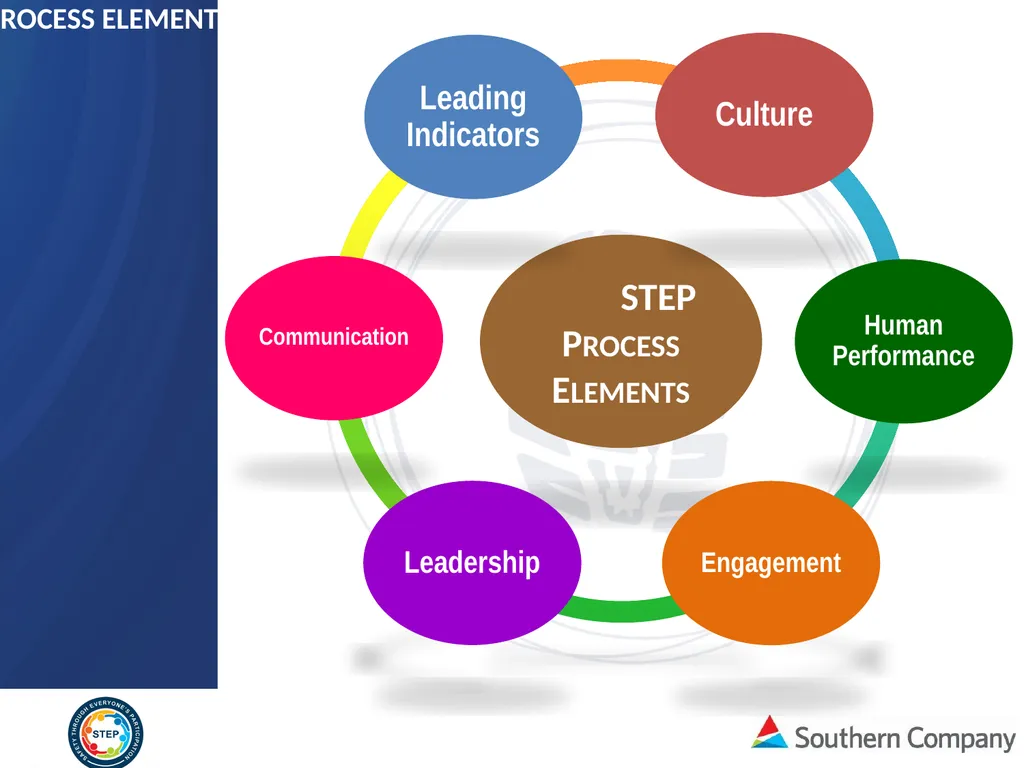
PROCESS ELEMENTS<br>
09
EXPECTATIONS Organizational Level: Create a “shared leadership safety culture” though the new process.
Provide all levels of employees with the same “Safety Philosophy.”
Supply all employees with time and resources to make a difference.
Give employees common tools to increase their safety effectiveness.<br>
10
EXPECTATIONS Personal Level: Commit to using new tools to improve your own safety culture.
Use new safety communication tools to reinforce the culture change.
Examine your own safety leadership behaviors to ensure success.
Engage other employees to help create safety momentum.<br>
11
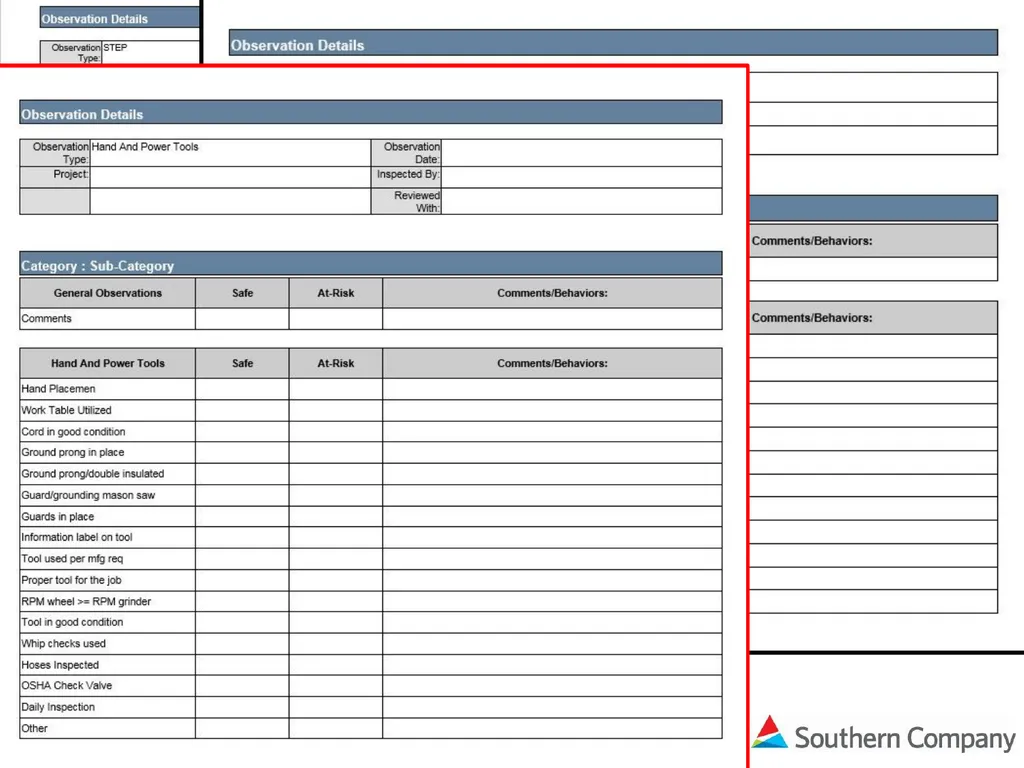
CHECKLISTS<br>
12
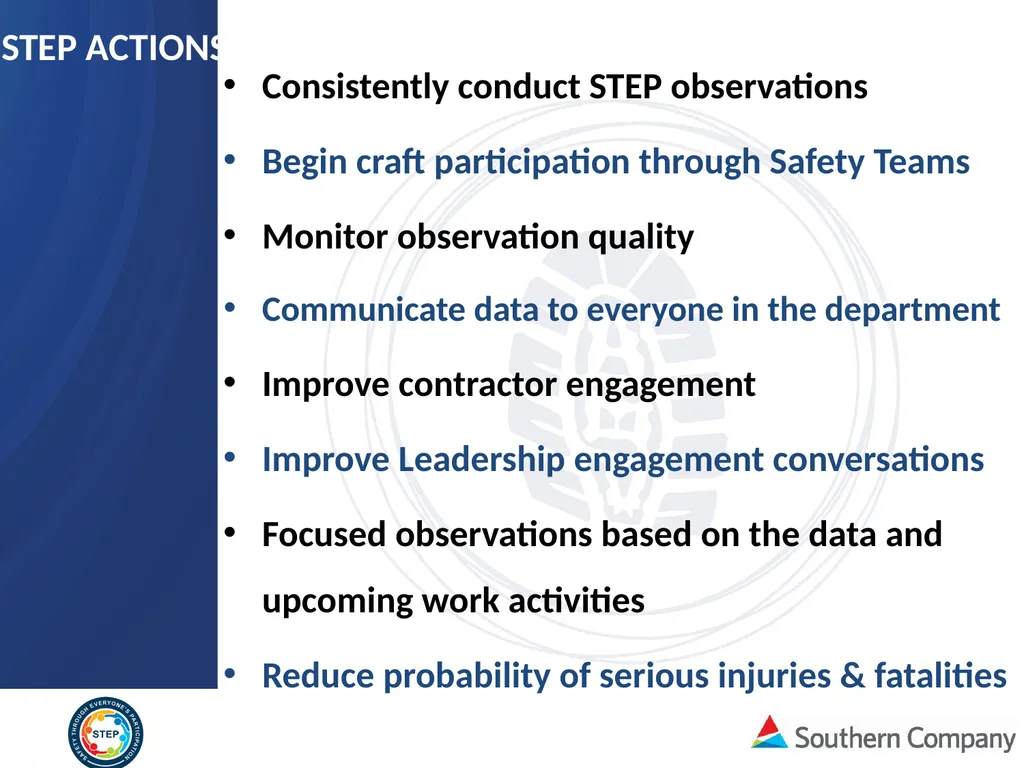
STEP ACTIONS Consistently conduct STEP observations
Begin craft participation through Safety Teams
Monitor observation quality
Communicate data to everyone in the department
Improve contractor engagement
Improve Leadership engagement conversations
Focused observations based on the data and upcoming work activities
Reduce probability of serious injuries & fatalities<br>
13
CONCLUSION We Need to STOP
Reacting to Injuries… And START
Predicting Them!<br>