Topographical Maps: Contour Lines Social Sciences: Mapwork Skills What are we going to learn? How to tell height from maps and orthophotos Contour lines what they are and how we read them What relief is and how to identify it on a map New
"Topographical Maps: Contour Lines Social Sciences:" is the property of its rightful owner. Permission is granted to
download and print the materials on this website for personal, non-commercial use only, and to display it
on your personal computer provided you do not modify the materials and that you retain all copyright
notices contained in the materials. By downloading content from our website, you accept the terms of this
agreement.
Presentation Transcript
01
Topographical Maps:
Contour Lines Social Sciences: Mapwork Skills<br>
02
What are we going to learn? How to tell height from maps and orthophotos
Contour lines – what they are and how we read them
What relief is and how to identify it on a map<br>
03
New words Contour:
A line on a level and joining points of the same height
Contour interval:
Height difference between contours line
Gradient:
The steepness of a slope
Wedge:
A triangular piece of land where two rivers meet, tapering to a point
Spur:
A mountain of hill that sticks out from the main mountain or range of mountains<br>
04
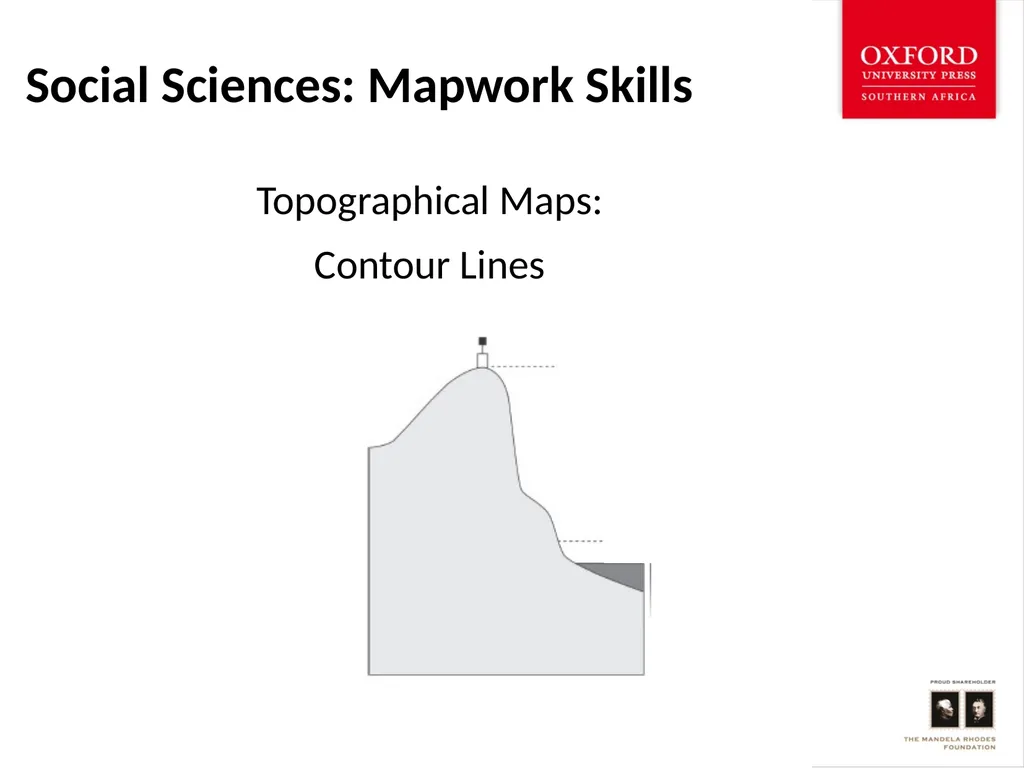
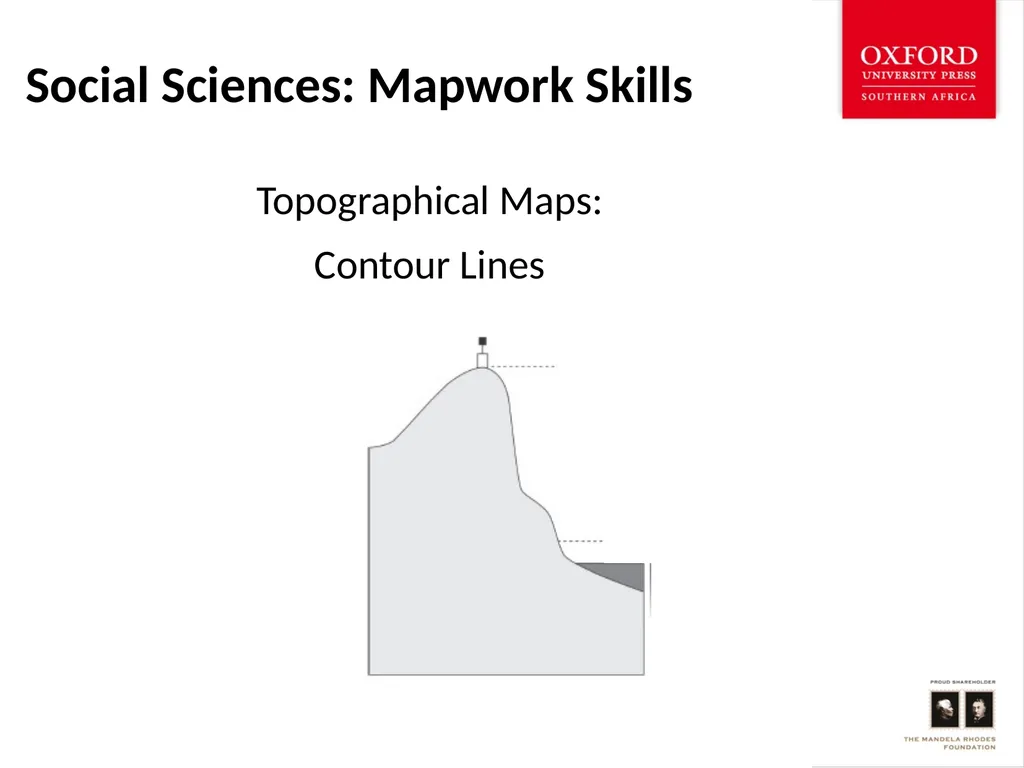
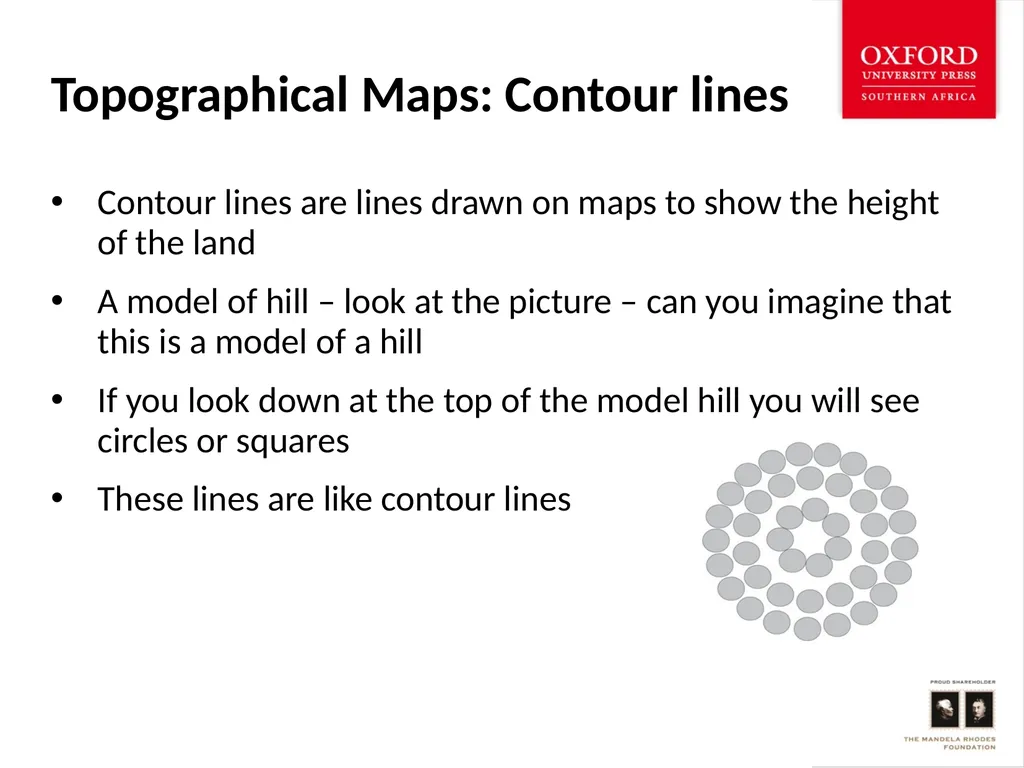
Topographical Maps: Contour lines Contour lines are lines drawn on maps to show the height of the land
A model of hill – look at the picture – can you imagine that this is a model of a hill
If you look down at the top of the model hill you will see circles or squares
These lines are like contour lines<br>
05
Contour lines on a map A contour is a line on a map, joining all places that are the same height above sea level
Sea level is 0
Contour lines have heights in metres written on them in spaces along the line
Each contour has a higher or lower value, depending on whether it is up or down the slope
The height difference between any two contours is the same – it is called a contour interval<br>
06
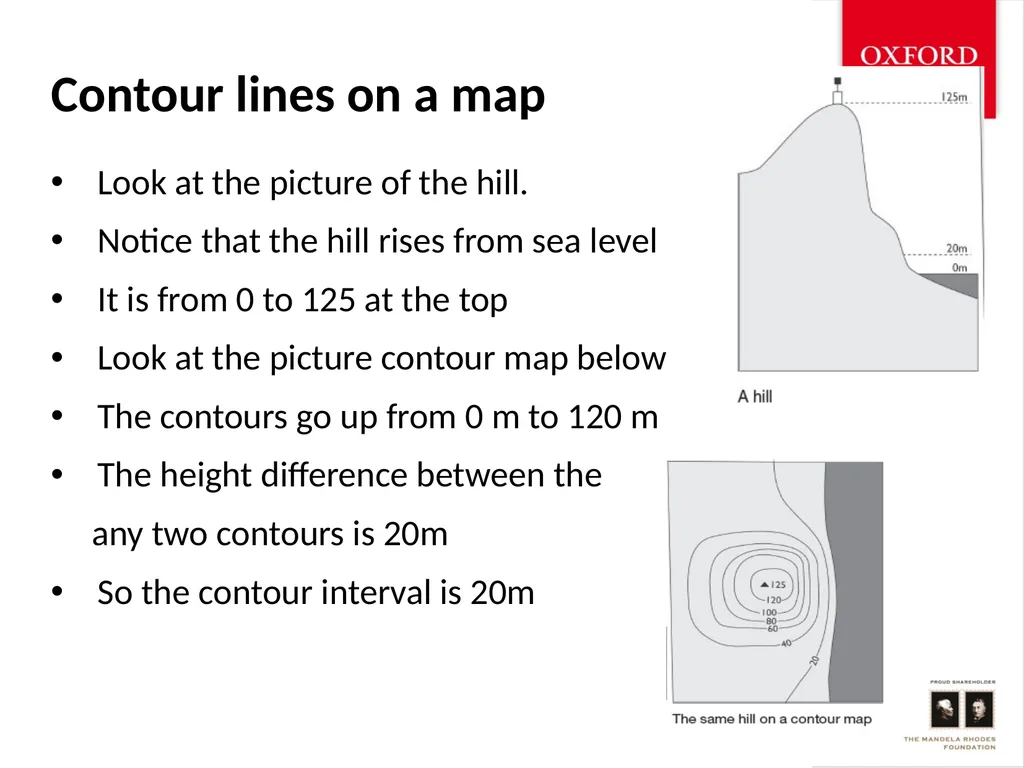
Contour lines on a map Look at the picture of the hill.
Notice that the hill rises from sea level
It is from 0 to 125 at the top
Look at the picture contour map below
The contours go up from 0 m to 120 m
The height difference between the
any two contours is 20m
So the contour interval is 20m<br>
07
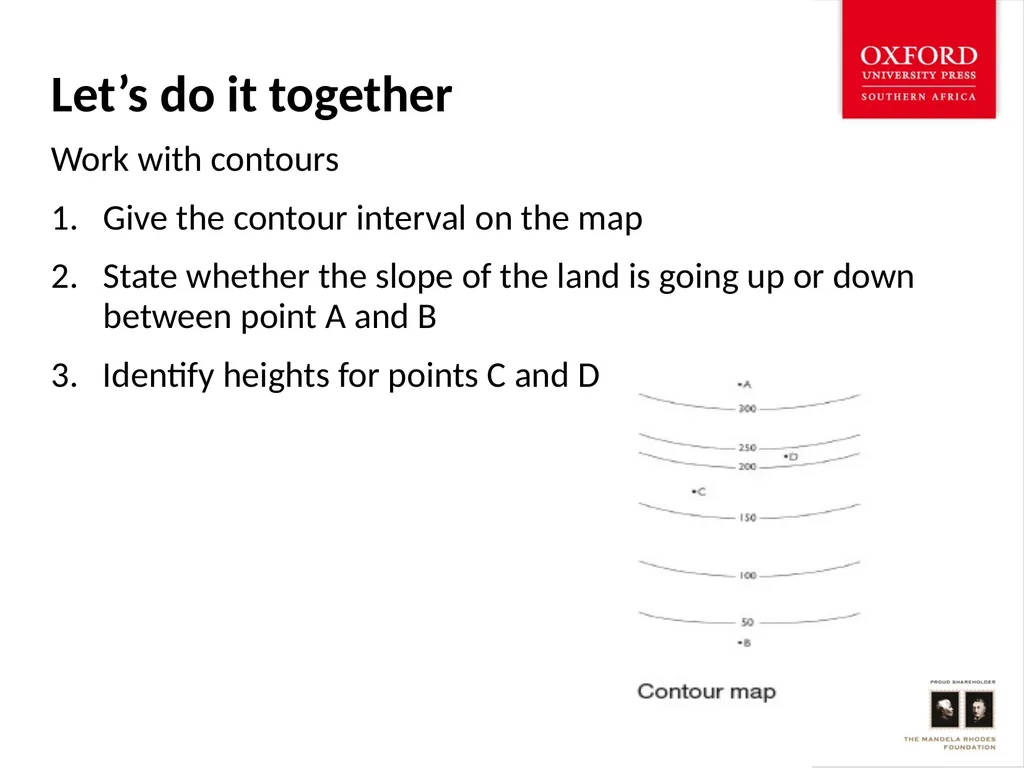
Let’s do it together Work with contours
Give the contour interval on the map
State whether the slope of the land is going up or down between point A and B
3. Identify heights for points C and D<br>
08
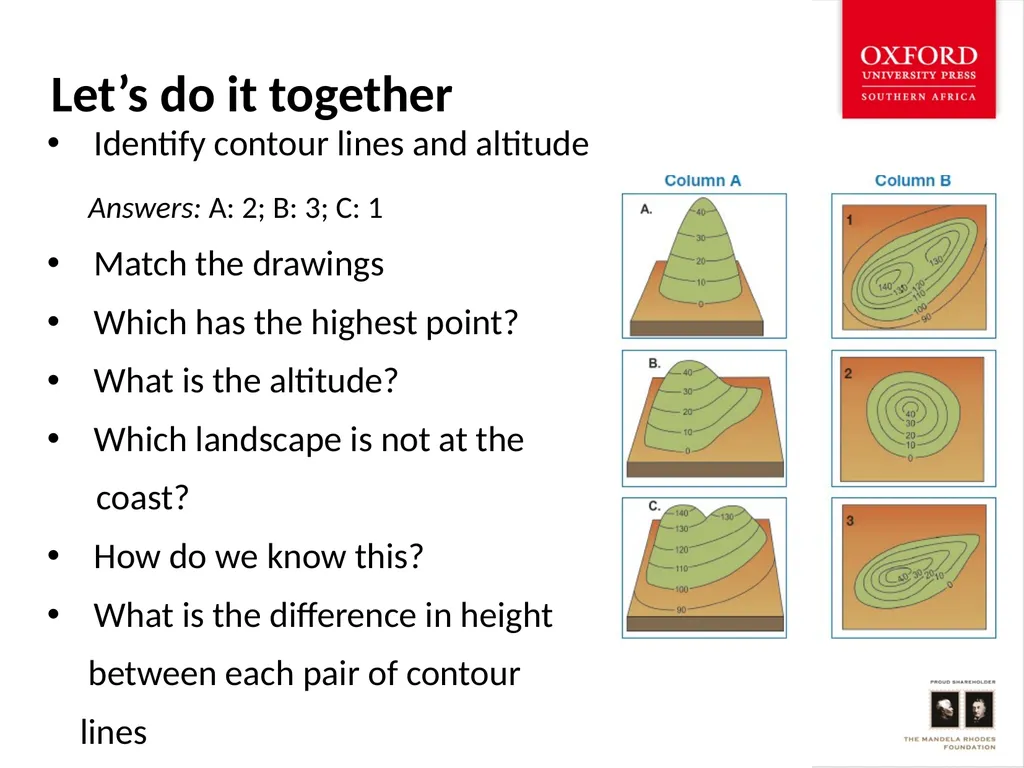
Let’s do it together Identify contour lines and altitude
Answers: A: 2; B: 3; C: 1
Match the drawings
Which has the highest point?
What is the altitude?
Which landscape is not at the
coast?
How do we know this?
What is the difference in height
between each pair of contour
lines<br>
09
Contour patterns The patterns that contours make on a map show us what the land looks like on the ground
By looking at contour patterns, we can recognise landforms such as hills, valleys, slopes and cliffs
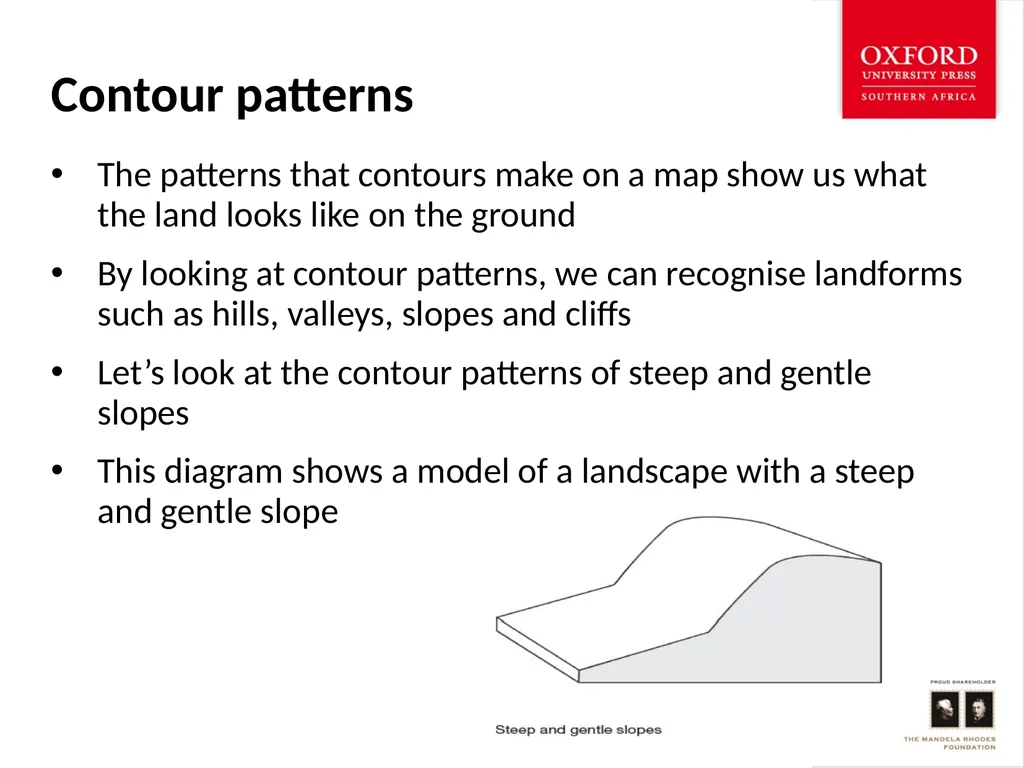
Let’s look at the contour patterns of steep and gentle slopes
This diagram shows a model of a landscape with a steep and gentle slope<br>
10
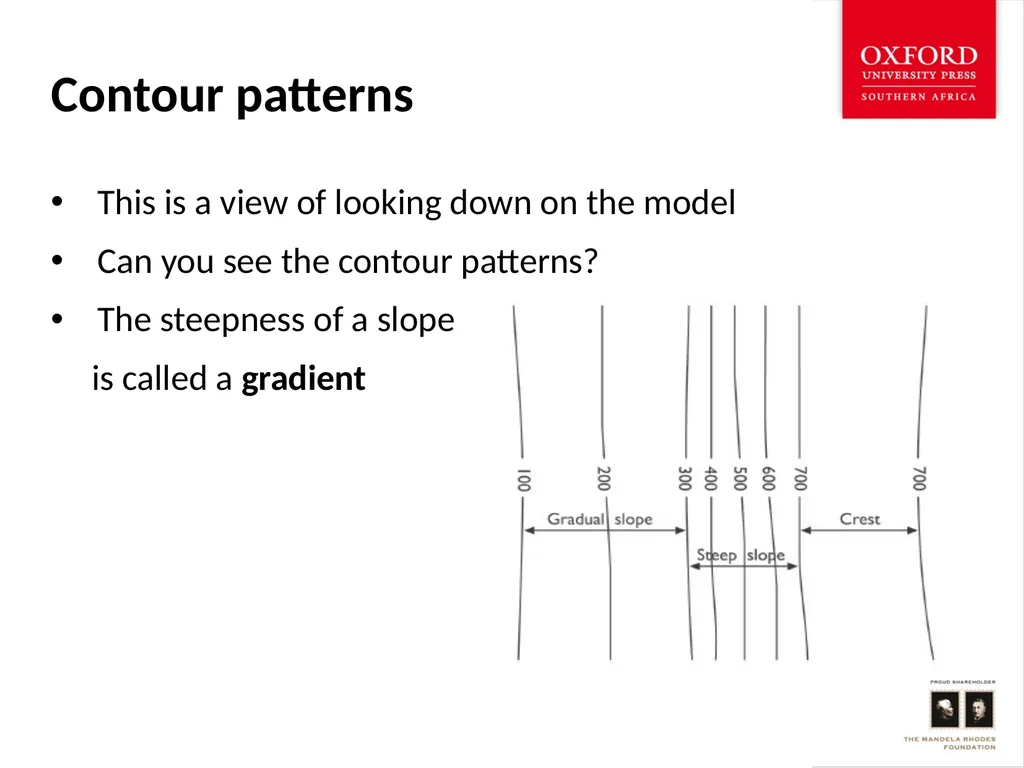
Contour patterns This is a view of looking down on the model
Can you see the contour patterns?
The steepness of a slope
is called a gradient<br>
11
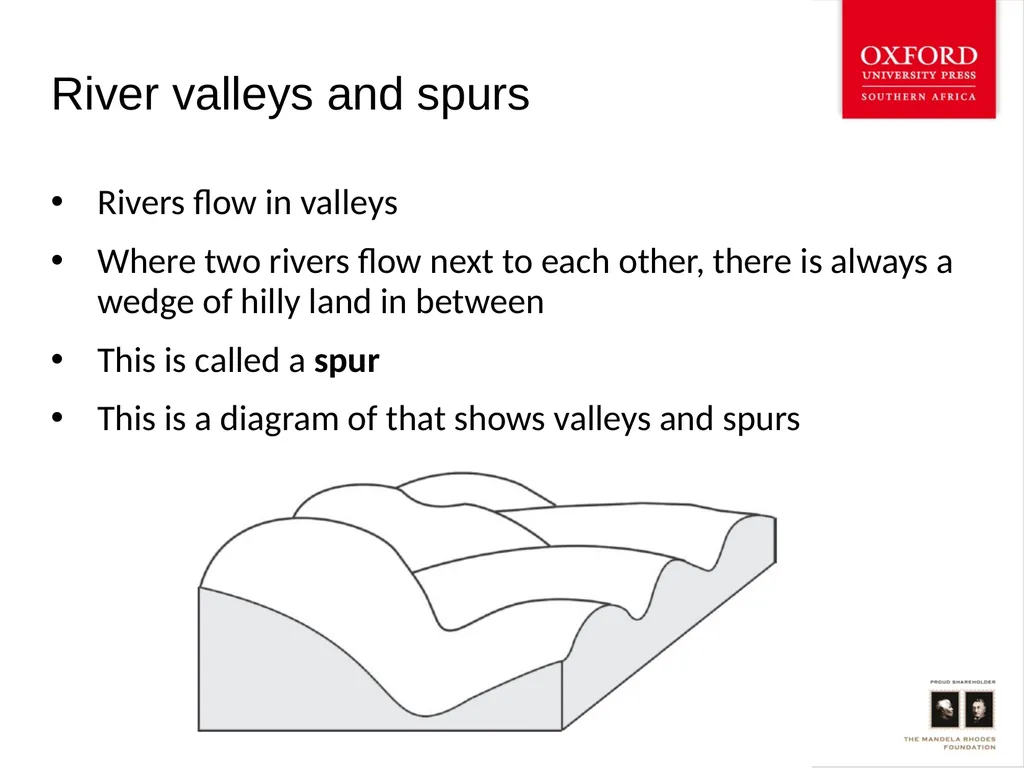
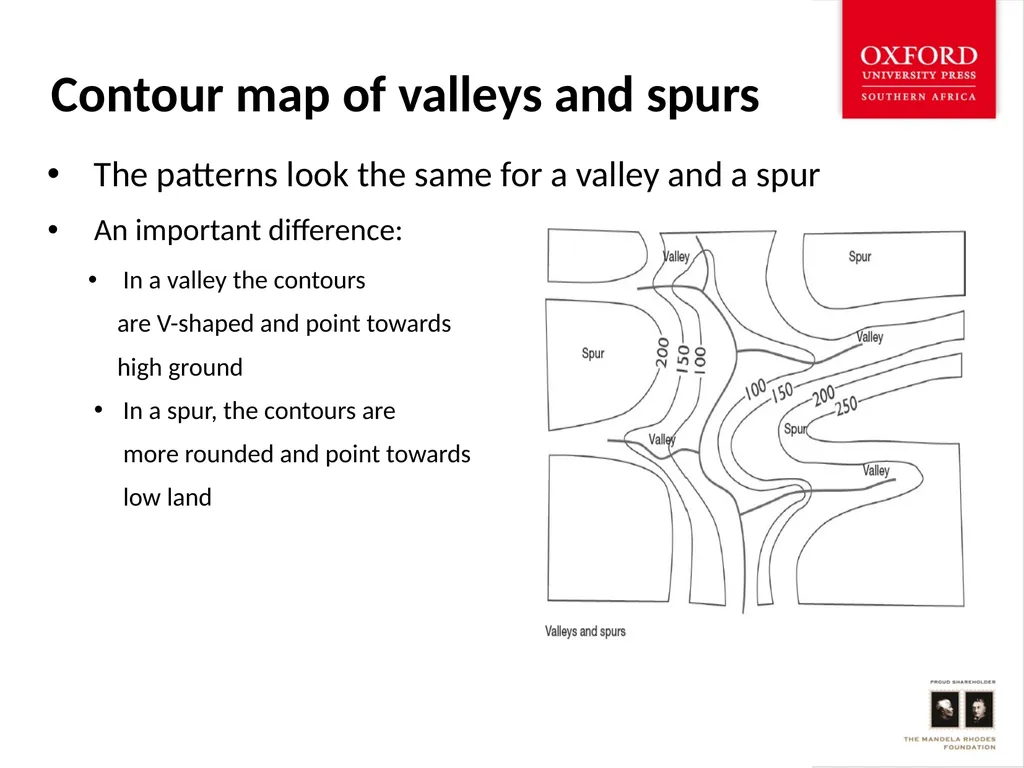
River valleys and spurs Rivers flow in valleys
Where two rivers flow next to each other, there is always a wedge of hilly land in between
This is called a spur
This is a diagram of that shows valleys and spurs<br>
12
Contour map of valleys and spurs The patterns look the same for a valley and a spur
An important difference:
In a valley the contours
are V-shaped and point towards
high ground
In a spur, the contours are
more rounded and point towards
low land<br>
13
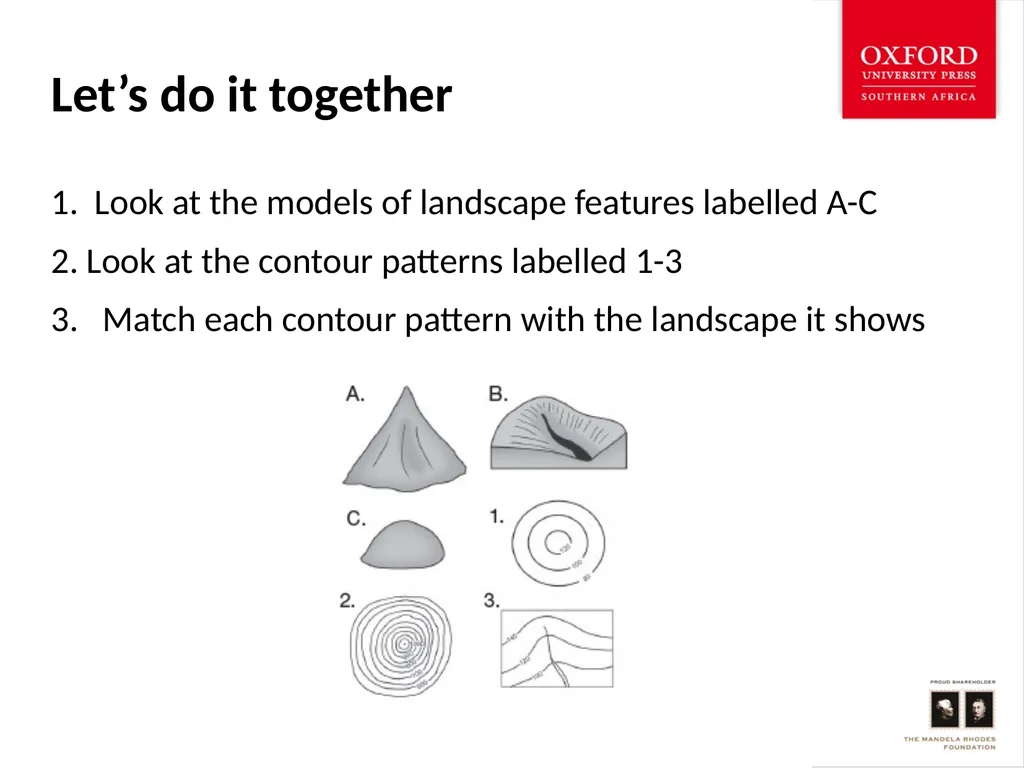
Let’s do it together 1. Look at the models of landscape features labelled A-C
2. Look at the contour patterns labelled 1-3
3. Match each contour pattern with the landscape it shows<br>