
Unit 2 Research Methods: Thinking Critically With
LO
Published · 167 slides · 0 views

1 / 1







Description
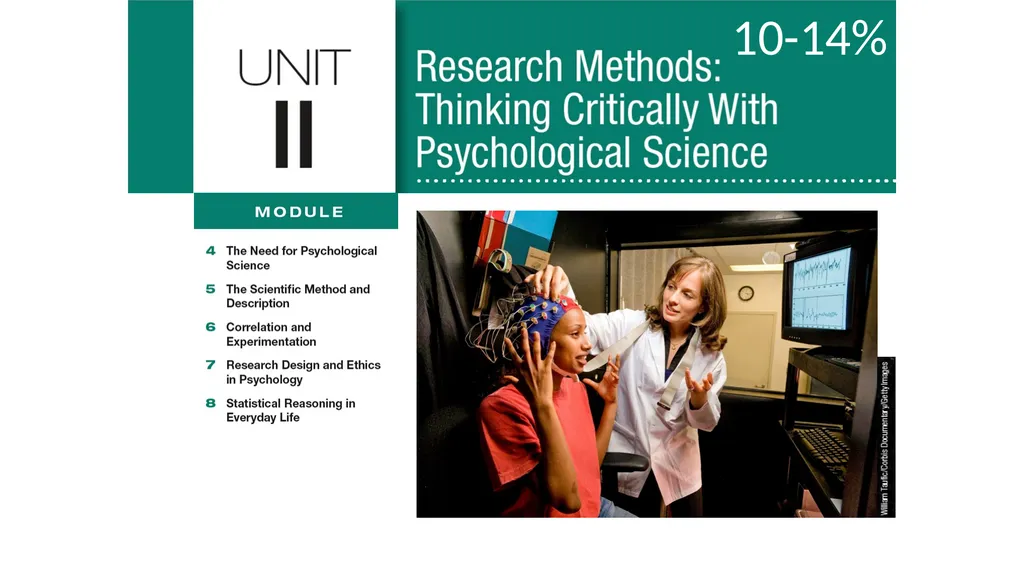
Unit 2 Research Methods: Thinking Critically With Psychological Science 10-14 Module 4 The Need for Psychological Science Module 4 The Need for Psychological Science Learning Targets 4-1 How do hindsight bias, overconfidence, and the
Related Topics
Share
Embed code
Download this presentation From Below
"Unit 2 Research Methods: Thinking Critically With" is the property of its rightful owner. Permission is granted to download and print the materials on this website for personal, non-commercial use only, and to display it on your personal computer provided you do not modify the materials and that you retain all copyright notices contained in the materials. By downloading content from our website, you accept the terms of this agreement.
Presentation Transcript
01
Unit 2
Research Methods: Thinking Critically With Psychological Science 10-14%<br>
02
Module 4
The Need for Psychological Science Module 4 The Need
for Psychological Science Learning Targets 4-1 How do hindsight bias, overconfidence, and the tendency to perceive order in random events illustrate why science-based answers are more valid than those based on common sense?<br>
for Psychological Science Learning Targets 4-1 How do hindsight bias, overconfidence, and the tendency to perceive order in random events illustrate why science-based answers are more valid than those based on common sense?<br>
03
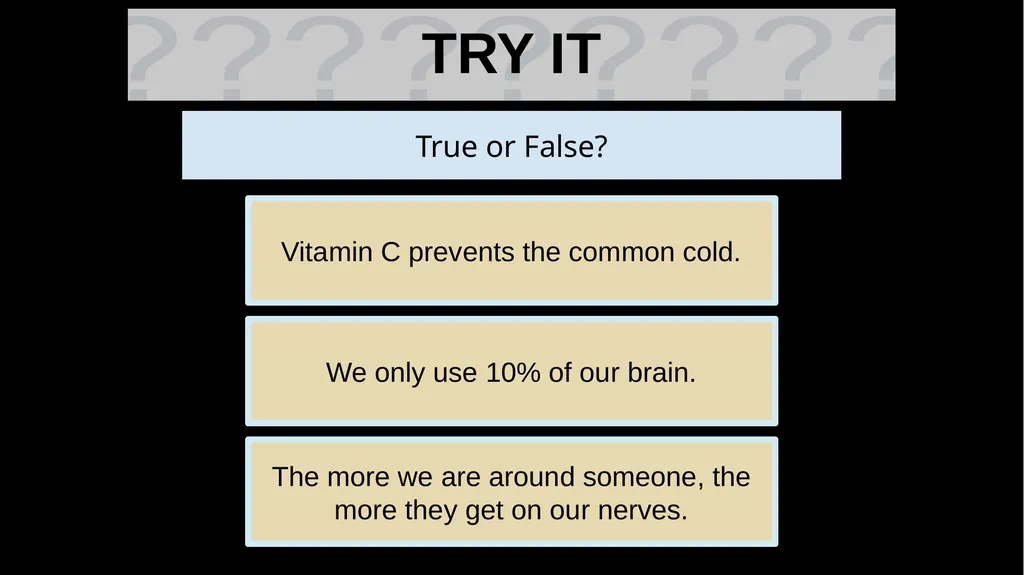
TRY IT True or False? Vitamin C prevents the common cold. We only use 10% of our brain. The more we are around someone, the more they get on our nerves.<br>
04
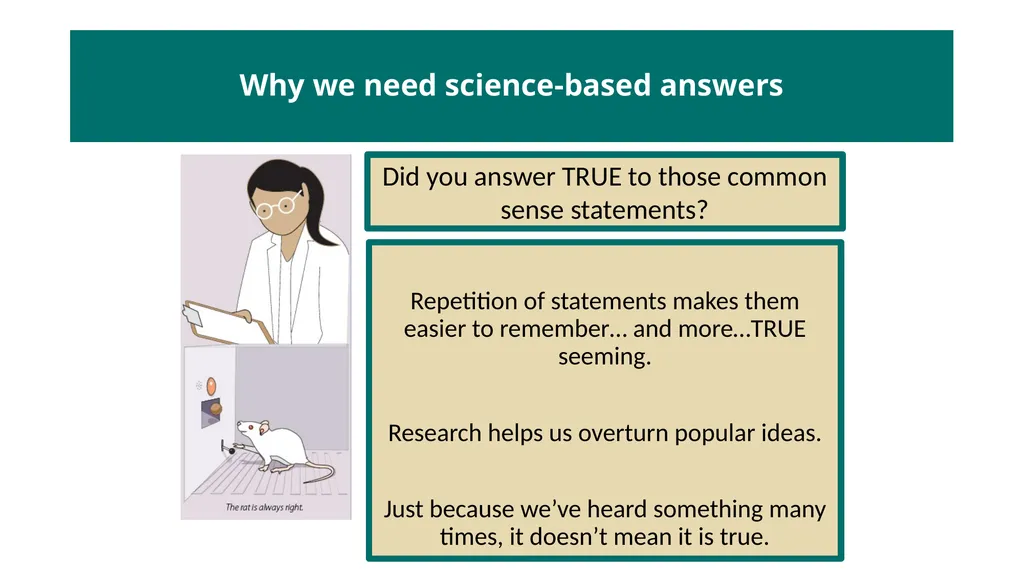
Why we need science-based answers Did you answer TRUE to those common sense statements? Repetition of statements makes them easier to remember… and more…TRUE seeming.
Research helps us overturn popular ideas.
Just because we’ve heard something many times, it doesn’t mean it is true.<br>
Research helps us overturn popular ideas.
Just because we’ve heard something many times, it doesn’t mean it is true.<br>
05
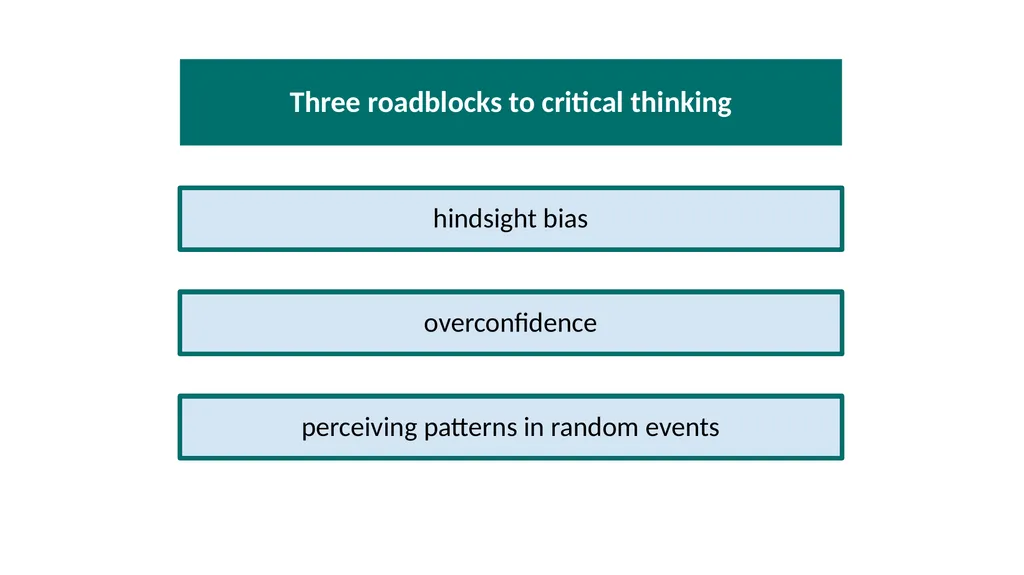
Three roadblocks to critical thinking Three roadblocks to critical thinking hindsight bias overconfidence perceiving patterns in random events<br>
06
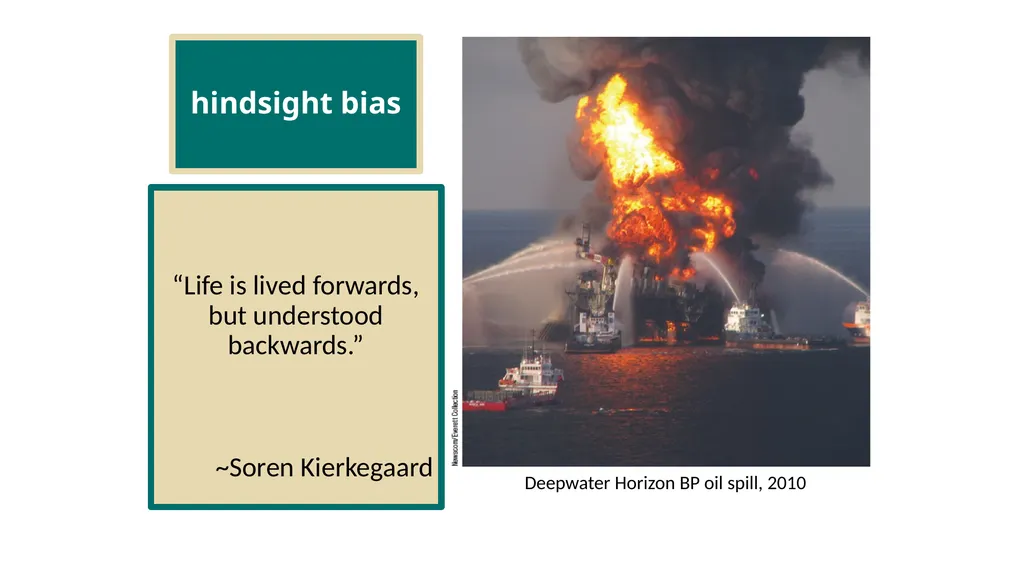
hindsight bias “Life is lived forwards, but understood backwards.”
~Soren Kierkegaard Deepwater Horizon BP oil spill, 2010<br>
~Soren Kierkegaard Deepwater Horizon BP oil spill, 2010<br>
07
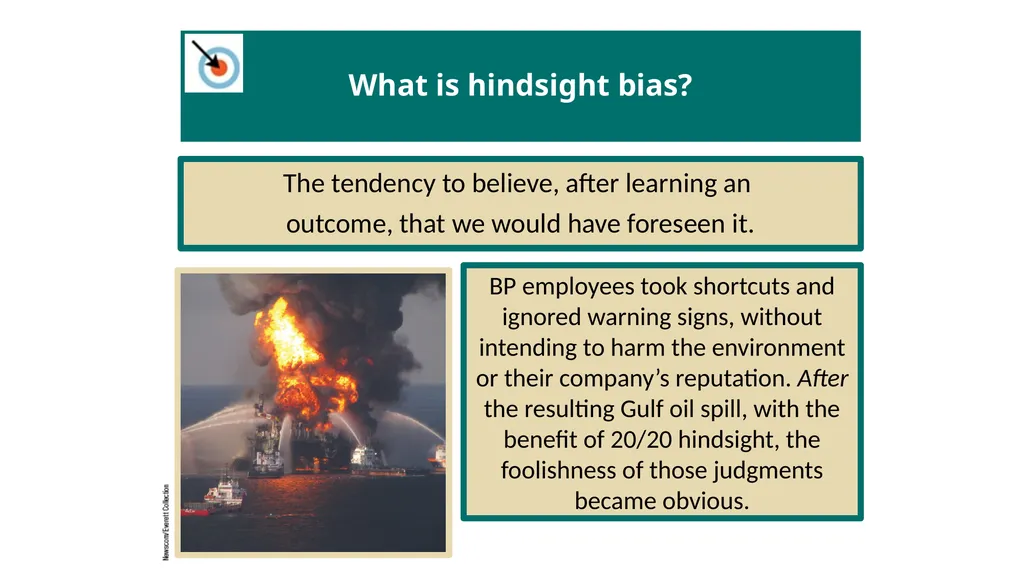
What is hindsight bias? The tendency to believe, after learning an
outcome, that we would have foreseen it. BP employees took shortcuts and
ignored warning signs, without intending to harm the environment or their company’s reputation. After the resulting Gulf oil spill, with the benefit of 20/20 hindsight, the foolishness of those judgments became obvious.<br>
outcome, that we would have foreseen it. BP employees took shortcuts and
ignored warning signs, without intending to harm the environment or their company’s reputation. After the resulting Gulf oil spill, with the benefit of 20/20 hindsight, the foolishness of those judgments became obvious.<br>
08
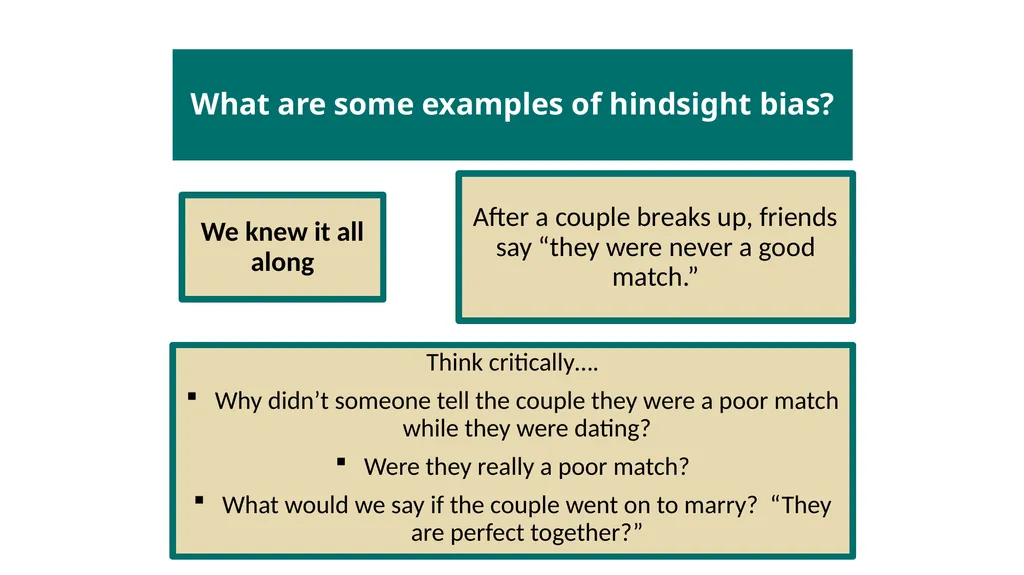
What are some examples of hindsight bias? We knew it all along After a couple breaks up, friends say “they were never a good match.” Think critically….
Why didn’t someone tell the couple they were a poor match while they were dating?
Were they really a poor match?
What would we say if the couple went on to marry? “They are perfect together?”<br>
Why didn’t someone tell the couple they were a poor match while they were dating?
Were they really a poor match?
What would we say if the couple went on to marry? “They are perfect together?”<br>
09
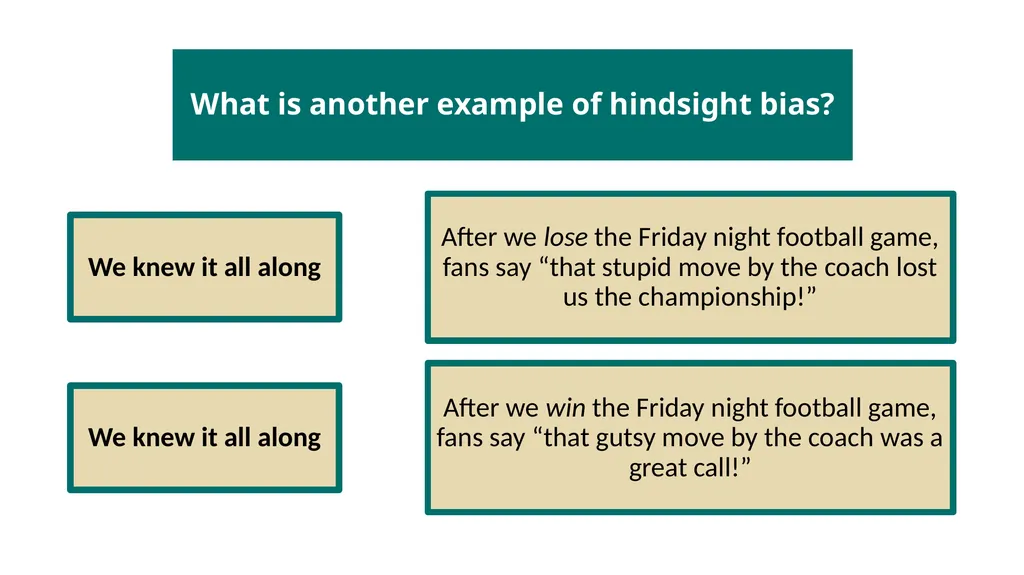
What is another example of hindsight bias? We knew it all along After we lose the Friday night football game, fans say “that stupid move by the coach lost us the championship!” We knew it all along After we win the Friday night football game, fans say “that gutsy move by the coach was a great call!”<br>
10
Let’s look at the research on hindsight bias… Separation weakens
romantic attraction. When presented with the statement above, most find this “true” statement unsurprising.
“Out of sight, out of mind” Separation strengthens romantic attraction. When presented with the statement above, most find
this “true” statement unsurprising.
“Absence makes the heart grow fonder”<br>
romantic attraction. When presented with the statement above, most find this “true” statement unsurprising.
“Out of sight, out of mind” Separation strengthens romantic attraction. When presented with the statement above, most find
this “true” statement unsurprising.
“Absence makes the heart grow fonder”<br>
11
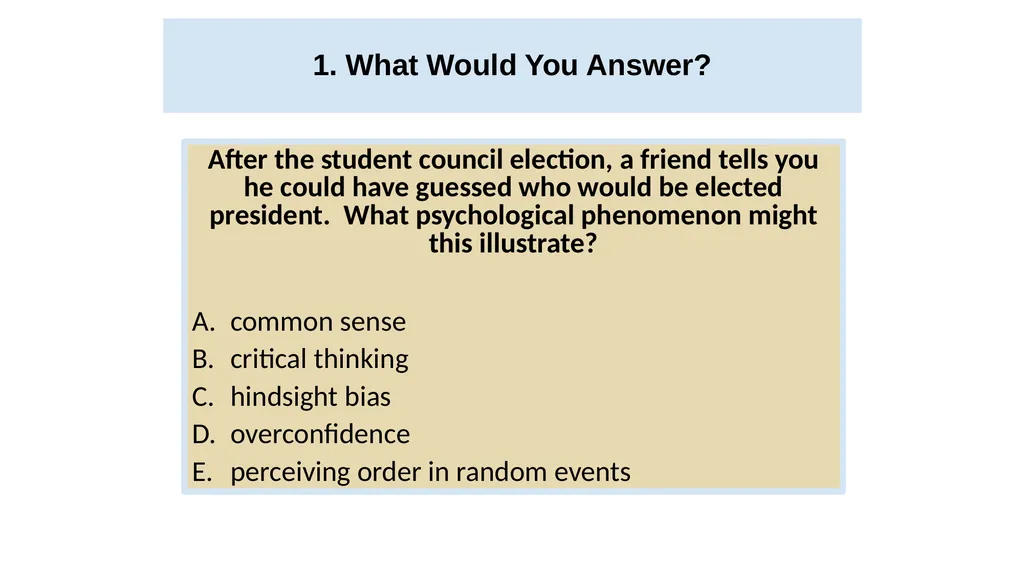
What Would You Answer? 1. What Would You Answer? After the student council election, a friend tells you he could have guessed who would be elected president. What psychological phenomenon might this illustrate?
common sense
critical thinking
hindsight bias
overconfidence
perceiving order in random events<br>
common sense
critical thinking
hindsight bias
overconfidence
perceiving order in random events<br>
12
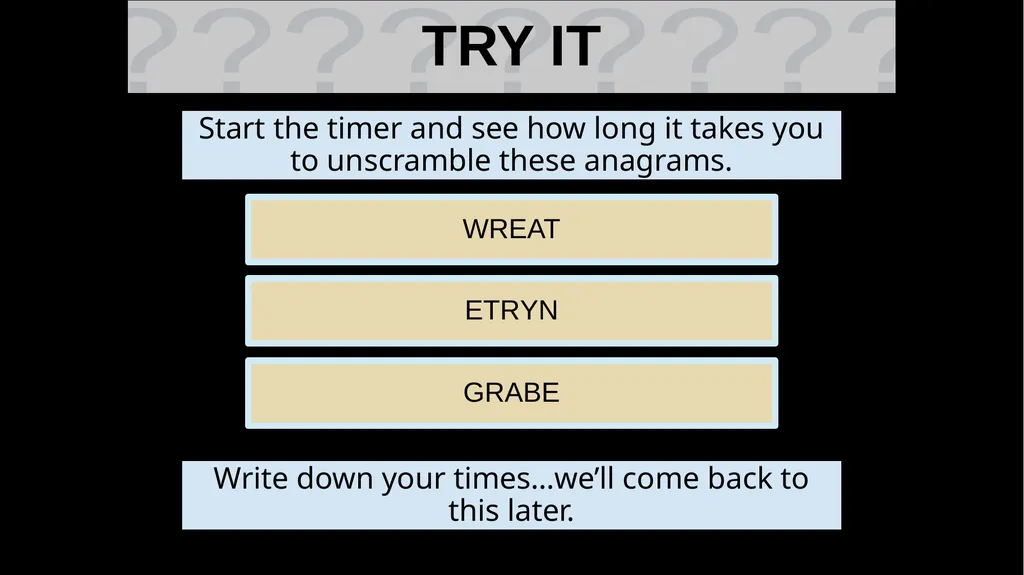
TRY IT Start the timer and see how long it takes you to unscramble these anagrams. WREAT ETRYN GRABE Write down your times…we’ll come back to this later.<br>
13
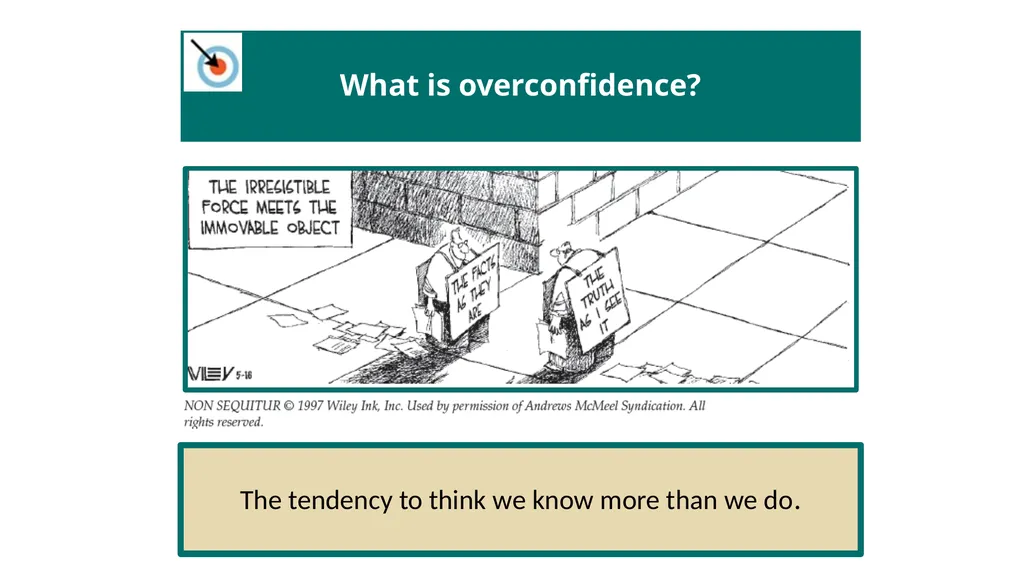
What is overconfidence? The tendency to think we know more than we do.<br>
14
Let’s look at the research on overconfidence… solution time without answers given The average problem solver spends 3 minutes. solution time estimate with answers given The estimate of how long it might have taken …
10 seconds. Think critically…
How long did it take YOU to unscramble those anagrams?
Do your times match up with what researchers found?
Why do you think subjects estimated a much shorter time when they could also see the answers?
How does this demonstrate overconfidence?<br>
10 seconds. Think critically…
How long did it take YOU to unscramble those anagrams?
Do your times match up with what researchers found?
Why do you think subjects estimated a much shorter time when they could also see the answers?
How does this demonstrate overconfidence?<br>
15
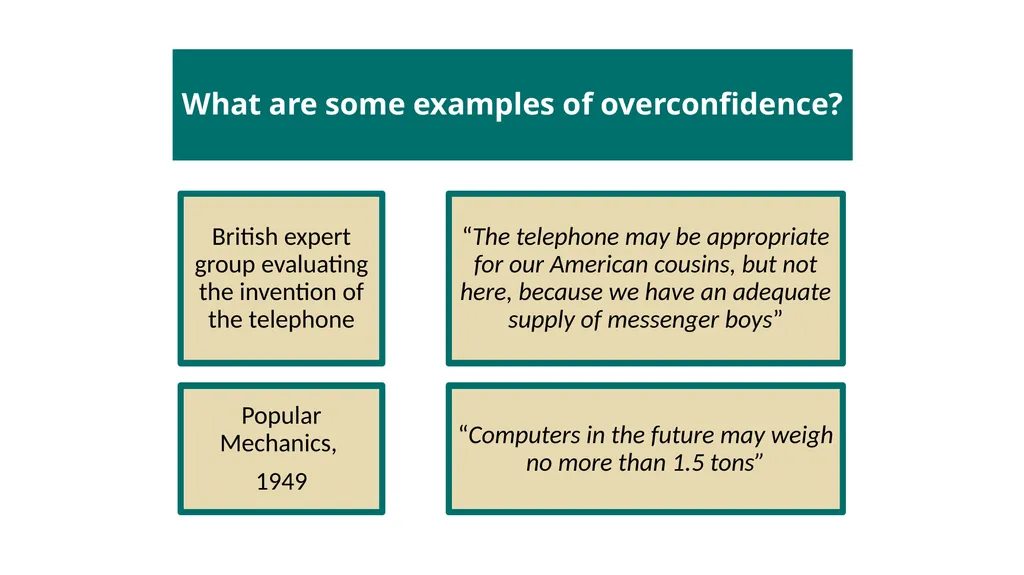
What are some examples of overconfidence? British expert group evaluating the invention of the telephone “The telephone may be appropriate for our American cousins, but not here, because we have an adequate supply of messenger boys” Popular Mechanics,
1949 “Computers in the future may weigh no more than 1.5 tons”<br>
1949 “Computers in the future may weigh no more than 1.5 tons”<br>
16
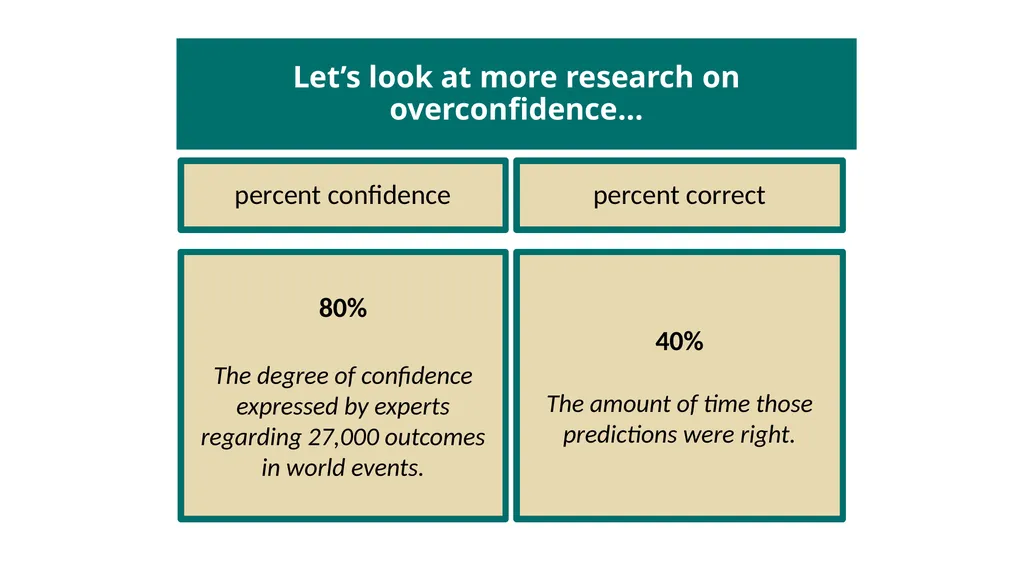
Let’s look at more research on overconfidence… percent confidence 80%
The degree of confidence expressed by experts regarding 27,000 outcomes in world events. percent correct 40%
The amount of time those predictions were right.<br>
The degree of confidence expressed by experts regarding 27,000 outcomes in world events. percent correct 40%
The amount of time those predictions were right.<br>
17
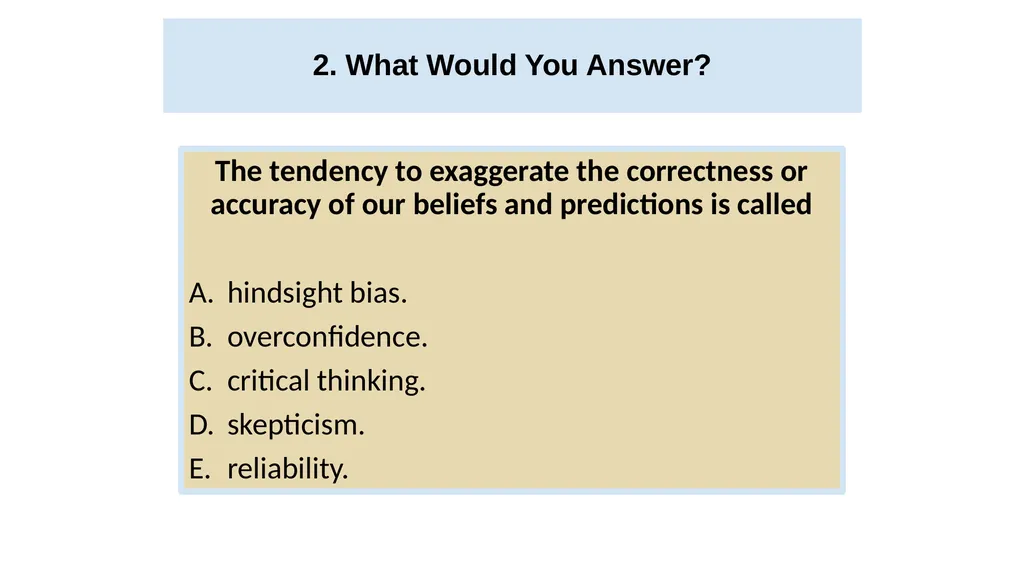
2. What Would You Answer? 2. What Would You Answer? The tendency to exaggerate the correctness or accuracy of our beliefs and predictions is called
hindsight bias.
overconfidence.
critical thinking.
skepticism.
reliability.<br>
hindsight bias.
overconfidence.
critical thinking.
skepticism.
reliability.<br>
18
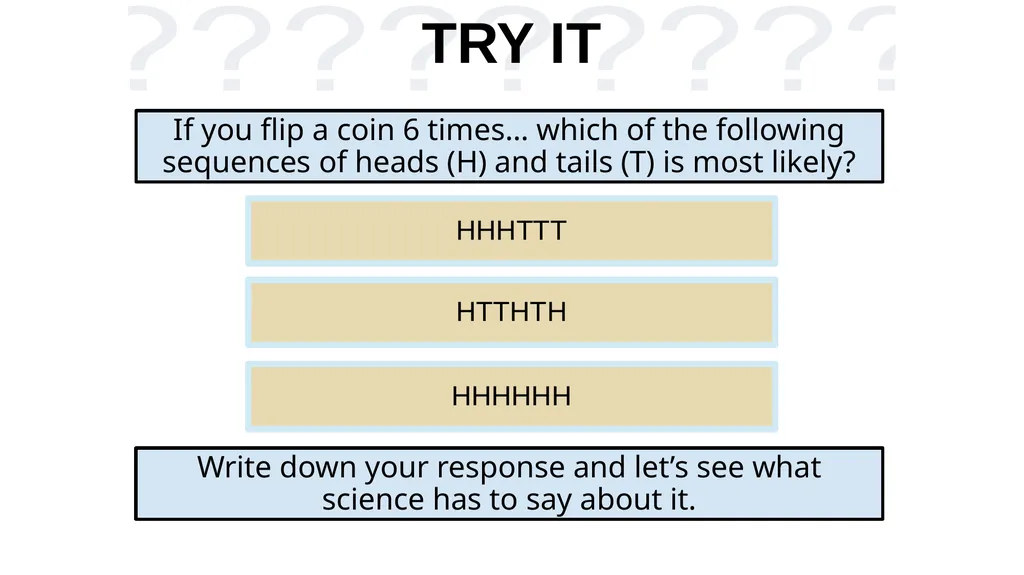
TRY IT If you flip a coin 6 times… which of the following sequences of heads (H) and tails (T) is most likely? HHHTTT HTTHTH HHHHHH Write down your response and let’s see what science has to say about it.<br>
19
Let’s look at the research on perceived order in random events… Most people believe HTTHTH is most likely. Actually…
all 3 are equally likely … or unlikely. Random sequences often don’t look random.
Fraud experts can detect embezzlers who are trying to make their withdrawals look random.
“With a large enough sample, any outrageous thing is likely to happen.”
Persi Diaconis and
Frederick Mosteller,1989
statisticians<br>
all 3 are equally likely … or unlikely. Random sequences often don’t look random.
Fraud experts can detect embezzlers who are trying to make their withdrawals look random.
“With a large enough sample, any outrageous thing is likely to happen.”
Persi Diaconis and
Frederick Mosteller,1989
statisticians<br>
20
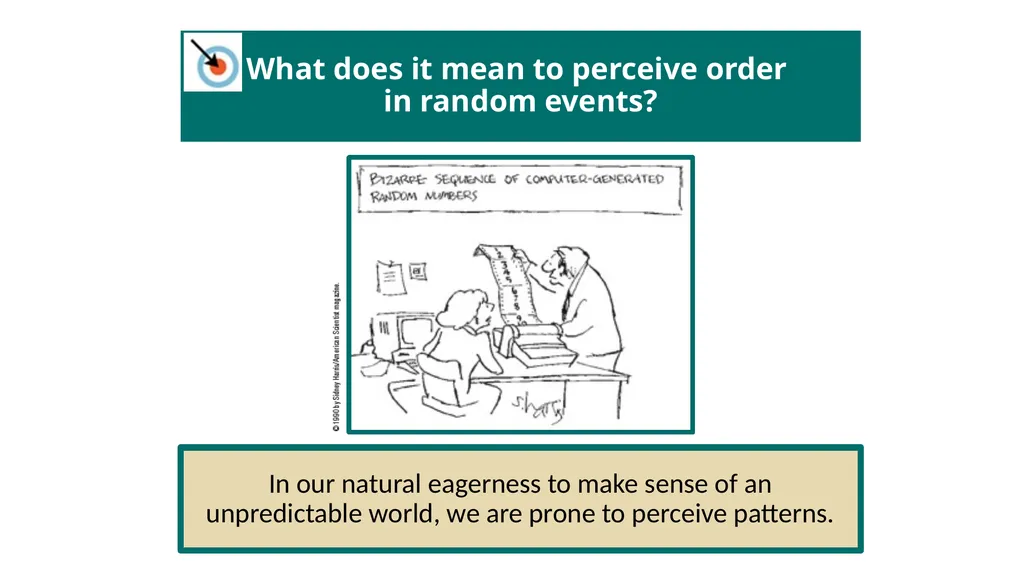
What does it mean to perceive order
in random events? In our natural eagerness to make sense of an unpredictable world, we are prone to perceive patterns.<br>
21
3. What Would You Answer? 3. What Would You Answer? A local basketball team has won three championships in a row and is on a winning streak going into the final game.
Explain how their fans might use the following to explain a loss in the final game:
Hindsight bias
Overconfidence
The tendency to perceive patterns in random events<br>
Explain how their fans might use the following to explain a loss in the final game:
Hindsight bias
Overconfidence
The tendency to perceive patterns in random events<br>
22
Learning Target 4-1 Review How do hindsight bias,
overconfidence, and the tendency to
perceive order in random events illustrate why science-based answers are more valid than those based on common sense? Hindsight bias, overconfidence and our eagerness to perceive patterns in random events, lead us to overestimate the weight of commonsense thinking.
Scientific inquiry can help us overcome such biases and shortcomings.<br>
overconfidence, and the tendency to
perceive order in random events illustrate why science-based answers are more valid than those based on common sense? Hindsight bias, overconfidence and our eagerness to perceive patterns in random events, lead us to overestimate the weight of commonsense thinking.
Scientific inquiry can help us overcome such biases and shortcomings.<br>
23
Module 5
The Scientific Method and Description Module 5
The Scientific Method and Description Learning Targets 5-1 Describe how theories advance psychological science. 5-2 Explain how psychologists use case studies, naturalistic observations, and surveys to observe and describe behavior, and why random sampling is important.<br>
The Scientific Method and Description Learning Targets 5-1 Describe how theories advance psychological science. 5-2 Explain how psychologists use case studies, naturalistic observations, and surveys to observe and describe behavior, and why random sampling is important.<br>
24
In Module 1 we discussed the three elements
of the scientific attitude. curiosity skepticism humility<br>
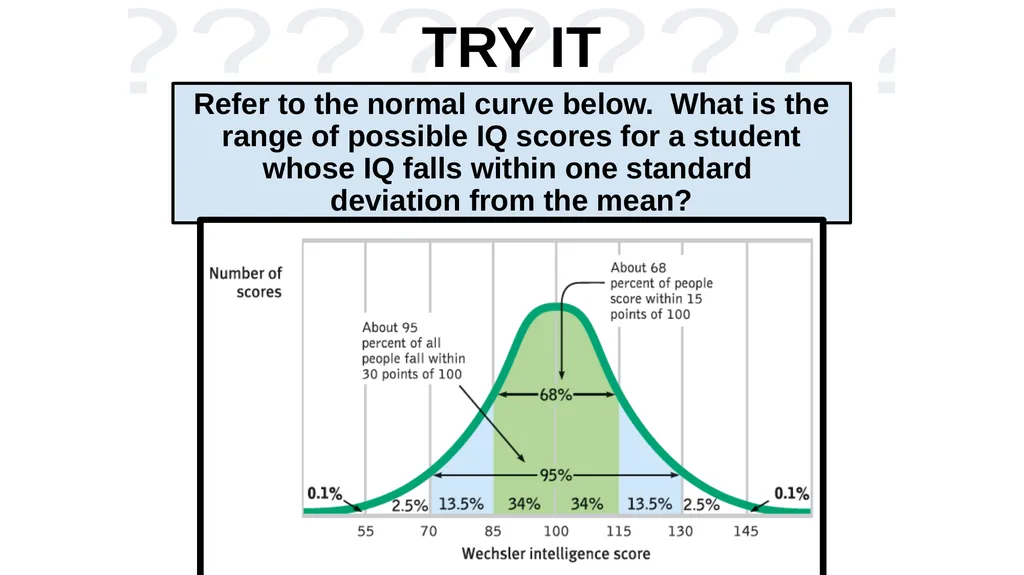
25
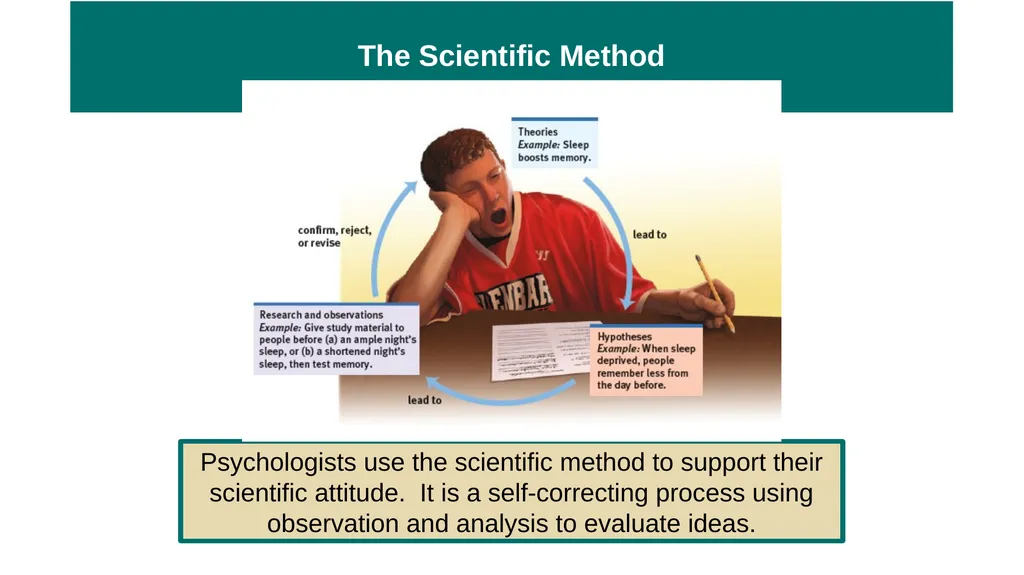
The Scientific Method Psychologists use the scientific method to support their scientific attitude. It is a self-correcting process using observation and analysis to evaluate ideas.<br>
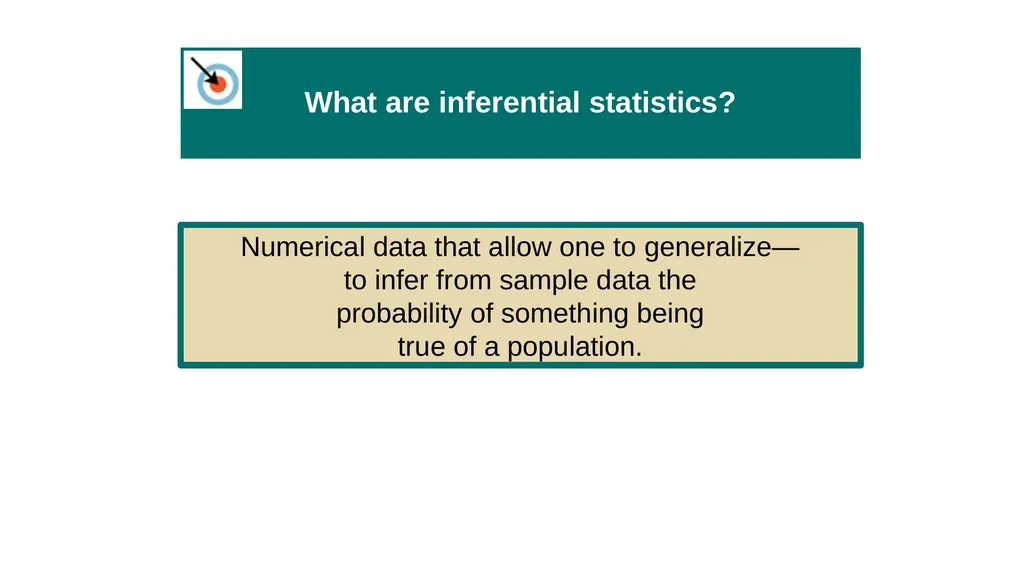
26
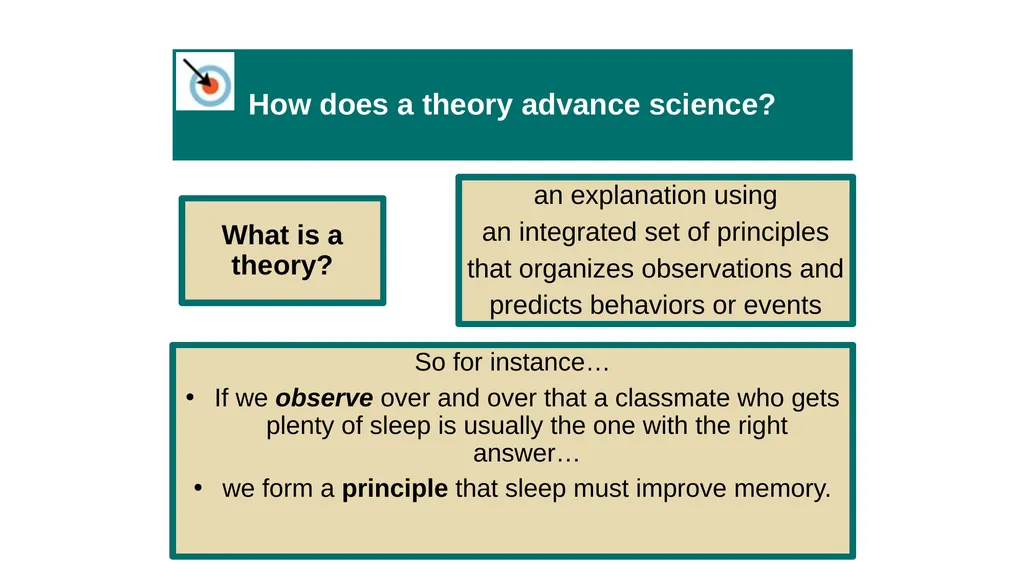
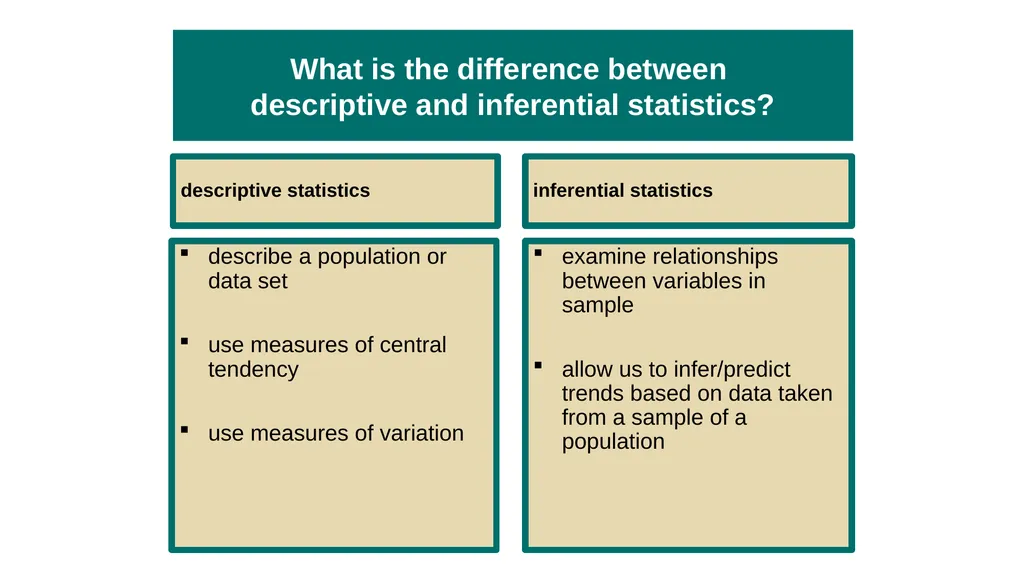
How does a theory advance science? What is a theory? an explanation using
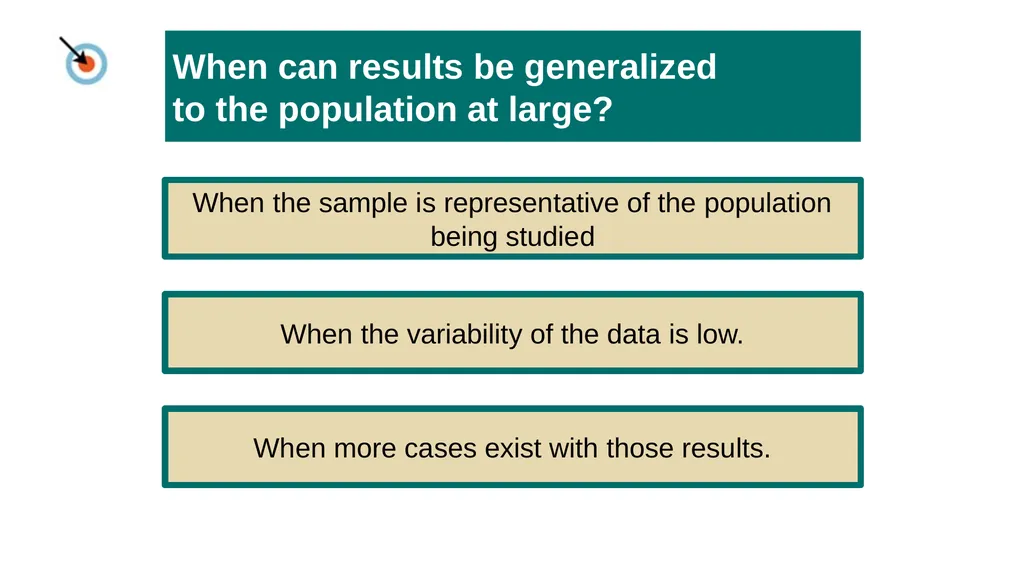
an integrated set of principles
that organizes observations and
predicts behaviors or events So for instance…
If we observe over and over that a classmate who gets plenty of sleep is usually the one with the right answer…
we form a principle that sleep must improve memory.<br>
an integrated set of principles
that organizes observations and
predicts behaviors or events So for instance…
If we observe over and over that a classmate who gets plenty of sleep is usually the one with the right answer…
we form a principle that sleep must improve memory.<br>
27
TRY IT What theories do you have about…. …how exercise relates to stress? …the way caffeine impacts memory? …how smiling impacts mood?<br>
28
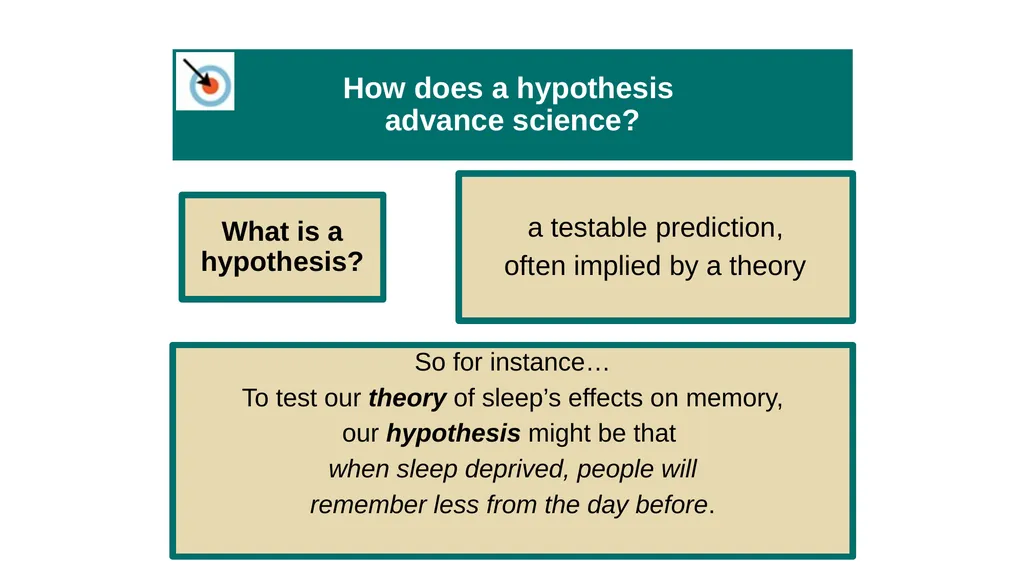
How does a hypothesis
advance science? What is a hypothesis? a testable prediction,
often implied by a theory So for instance…
To test our theory of sleep’s effects on memory,
our hypothesis might be that
when sleep deprived, people will
remember less from the day before.<br>
often implied by a theory So for instance…
To test our theory of sleep’s effects on memory,
our hypothesis might be that
when sleep deprived, people will
remember less from the day before.<br>
29
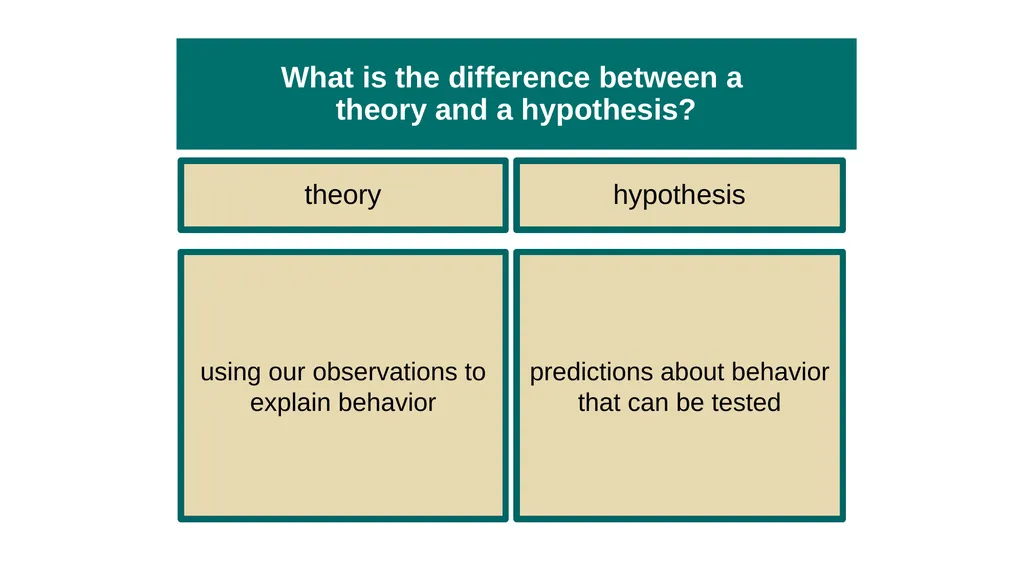
What is the difference between a
theory and a hypothesis? theory using our observations to explain behavior hypothesis predictions about behavior that can be tested<br>
30
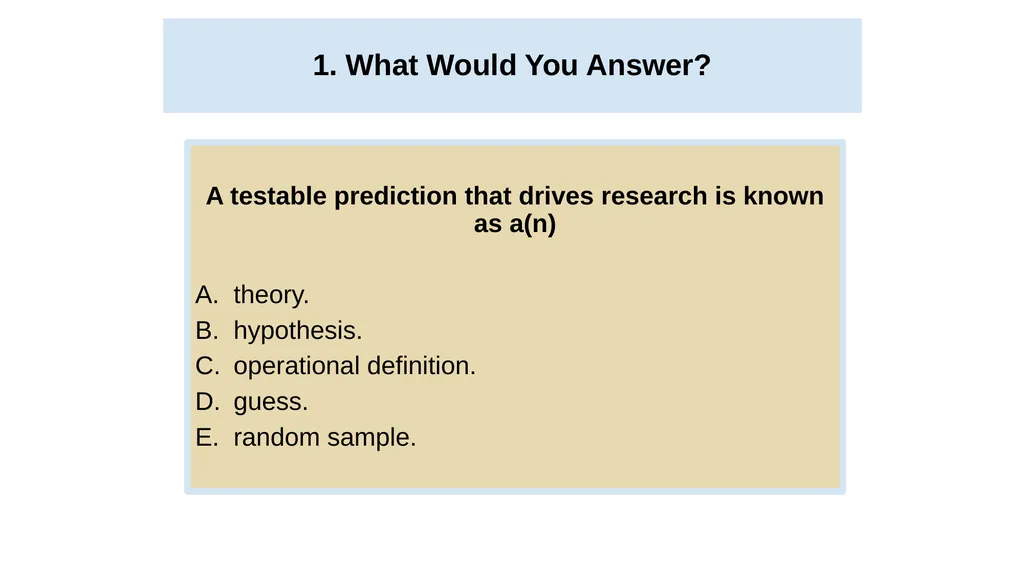
1. What Would You Answer? A testable prediction that drives research is known as a(n)
theory.
hypothesis.
operational definition.
guess.
random sample. 1. What Would You Answer?<br>
theory.
hypothesis.
operational definition.
guess.
random sample. 1. What Would You Answer?<br>
31
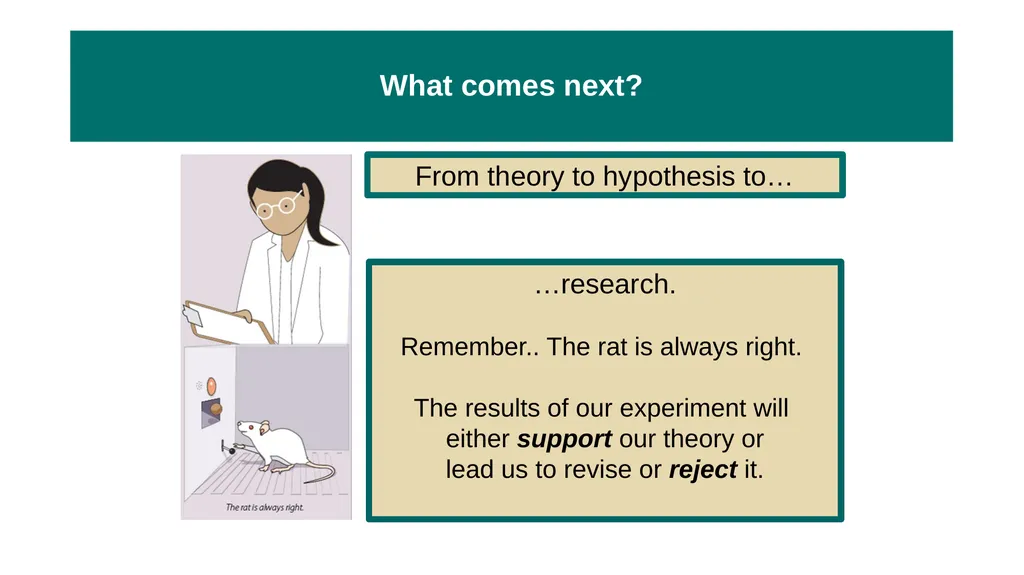
What comes next? From theory to hypothesis to… …research.
Remember.. The rat is always right.
The results of our experiment will
either support our theory or
lead us to revise or reject it.<br>
Remember.. The rat is always right.
The results of our experiment will
either support our theory or
lead us to revise or reject it.<br>
32
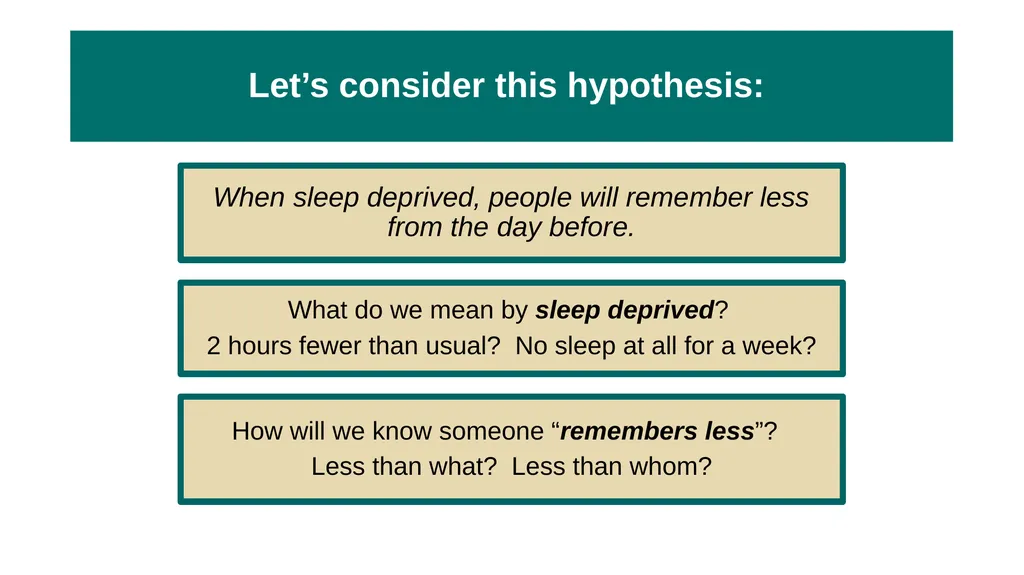
Let’s consider this hypothesis: When sleep deprived, people will remember less from the day before. What do we mean by sleep deprived?
2 hours fewer than usual? No sleep at all for a week? How will we know someone “remembers less”?
Less than what? Less than whom?<br>
2 hours fewer than usual? No sleep at all for a week? How will we know someone “remembers less”?
Less than what? Less than whom?<br>
33
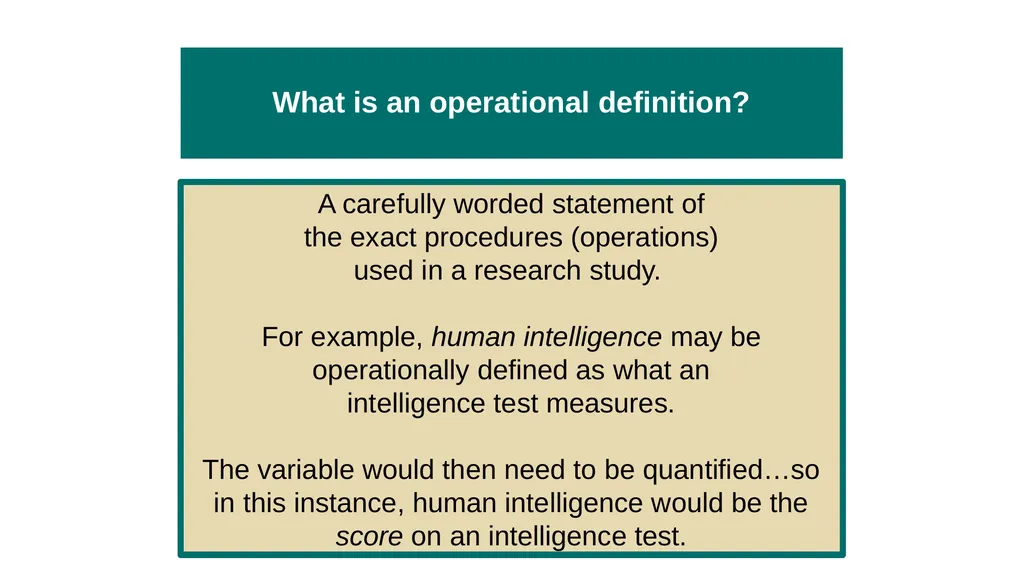
What is an operational definition? A carefully worded statement of
the exact procedures (operations)
used in a research study.
For example, human intelligence may be
operationally defined as what an
intelligence test measures.
The variable would then need to be quantified…so in this instance, human intelligence would be the score on an intelligence test.<br>
the exact procedures (operations)
used in a research study.
For example, human intelligence may be
operationally defined as what an
intelligence test measures.
The variable would then need to be quantified…so in this instance, human intelligence would be the score on an intelligence test.<br>
34
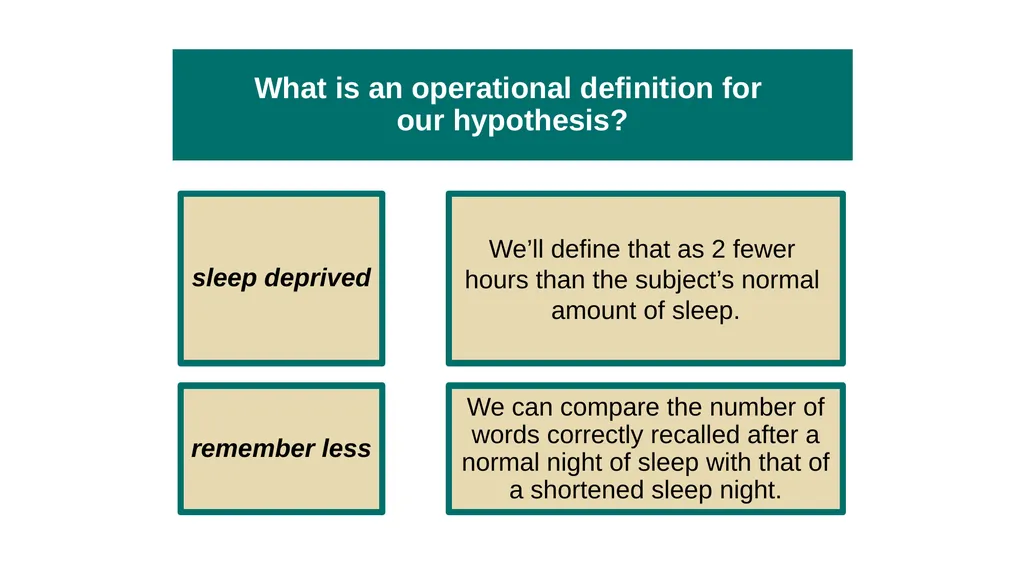
What is an operational definition for
our hypothesis? sleep deprived We’ll define that as 2 fewer
hours than the subject’s normal
amount of sleep. remember less We can compare the number of words correctly recalled after a normal night of sleep with that of a shortened sleep night.<br>
hours than the subject’s normal
amount of sleep. remember less We can compare the number of words correctly recalled after a normal night of sleep with that of a shortened sleep night.<br>
35
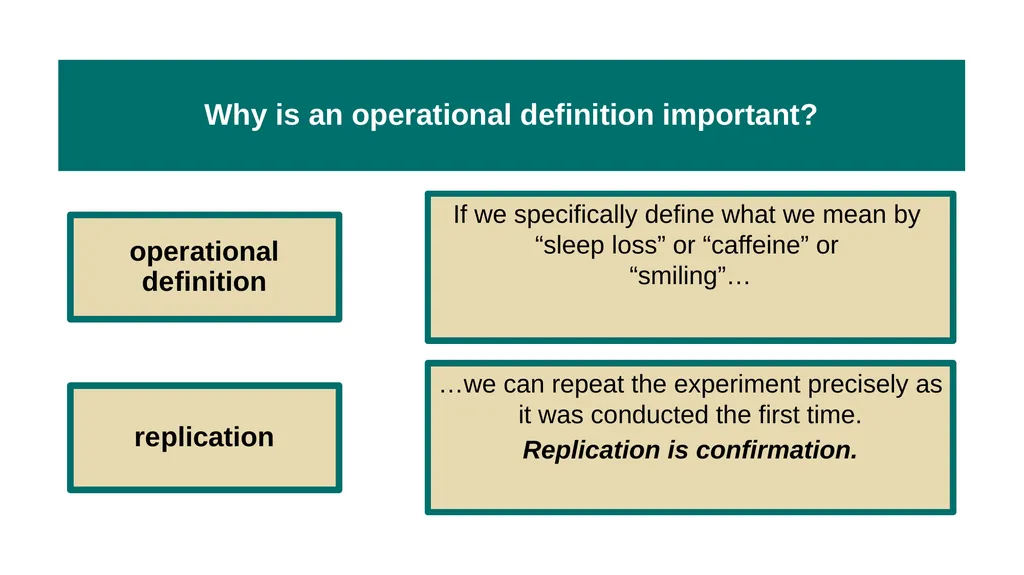
Why is an operational definition important? operational definition If we specifically define what we mean by
“sleep loss” or “caffeine” or
“smiling”… replication …we can repeat the experiment precisely as it was conducted the first time.
Replication is confirmation.<br>
“sleep loss” or “caffeine” or
“smiling”… replication …we can repeat the experiment precisely as it was conducted the first time.
Replication is confirmation.<br>
36
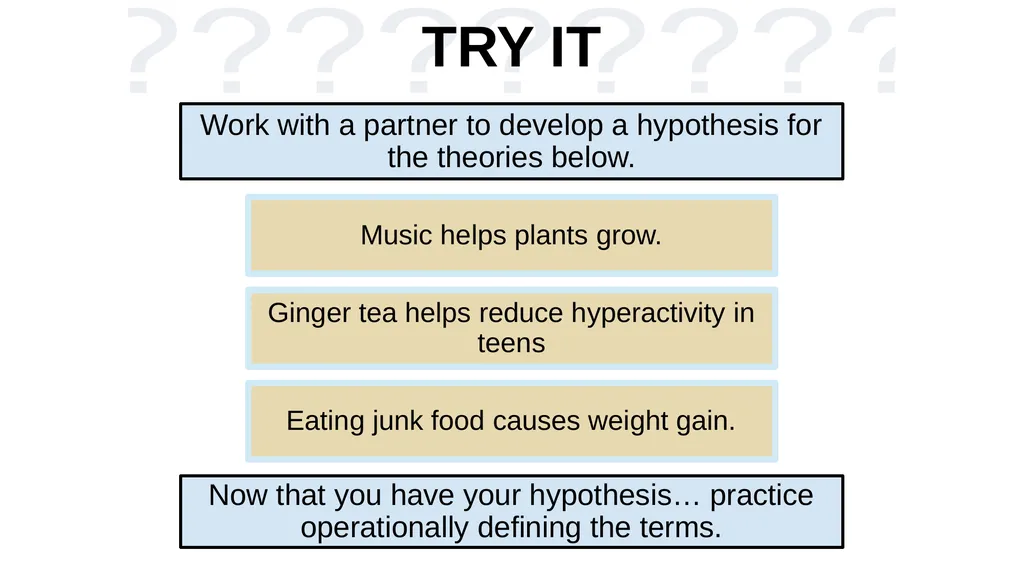
TRY IT Work with a partner to develop a hypothesis for the theories below. Music helps plants grow. Ginger tea helps reduce hyperactivity in teens Eating junk food causes weight gain. Now that you have your hypothesis… practice operationally defining the terms.<br>
37
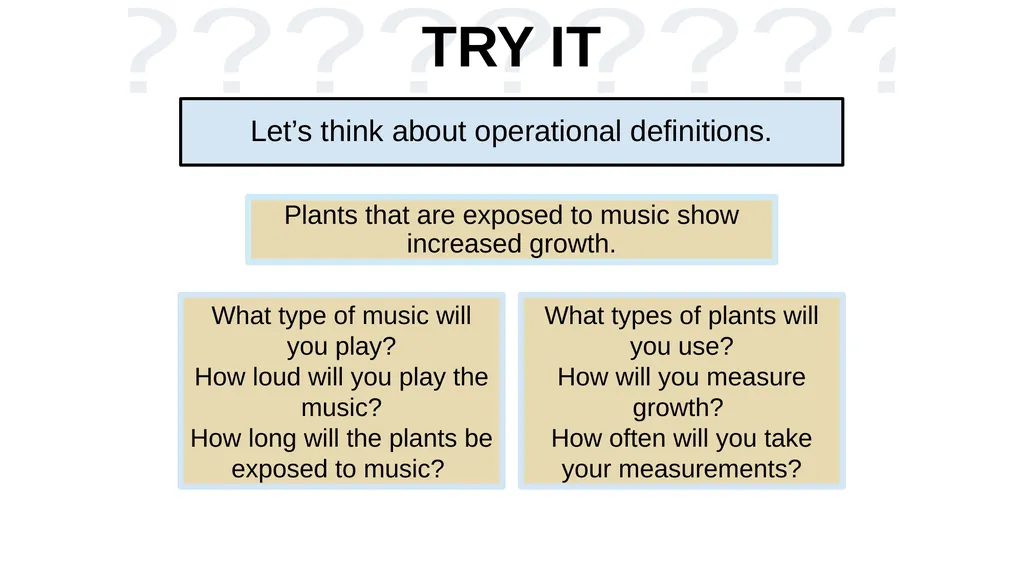
TRY IT Let’s think about operational definitions. Plants that are exposed to music show increased growth. What type of music will you play?
How loud will you play the music?
How long will the plants be exposed to music? What types of plants will you use?
How will you measure growth?
How often will you take your measurements?<br>
How loud will you play the music?
How long will the plants be exposed to music? What types of plants will you use?
How will you measure growth?
How often will you take your measurements?<br>
38
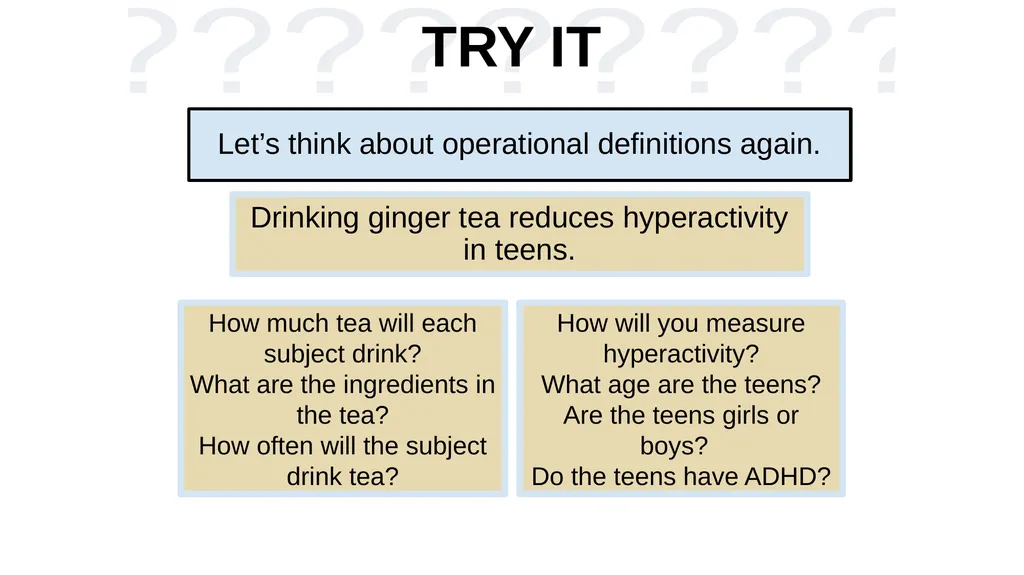
TRY IT Let’s think about operational definitions again. Drinking ginger tea reduces hyperactivity in teens. How much tea will each subject drink?
What are the ingredients in the tea?
How often will the subject drink tea? How will you measure hyperactivity?
What age are the teens?
Are the teens girls or boys?
Do the teens have ADHD?<br>
What are the ingredients in the tea?
How often will the subject drink tea? How will you measure hyperactivity?
What age are the teens?
Are the teens girls or boys?
Do the teens have ADHD?<br>
39
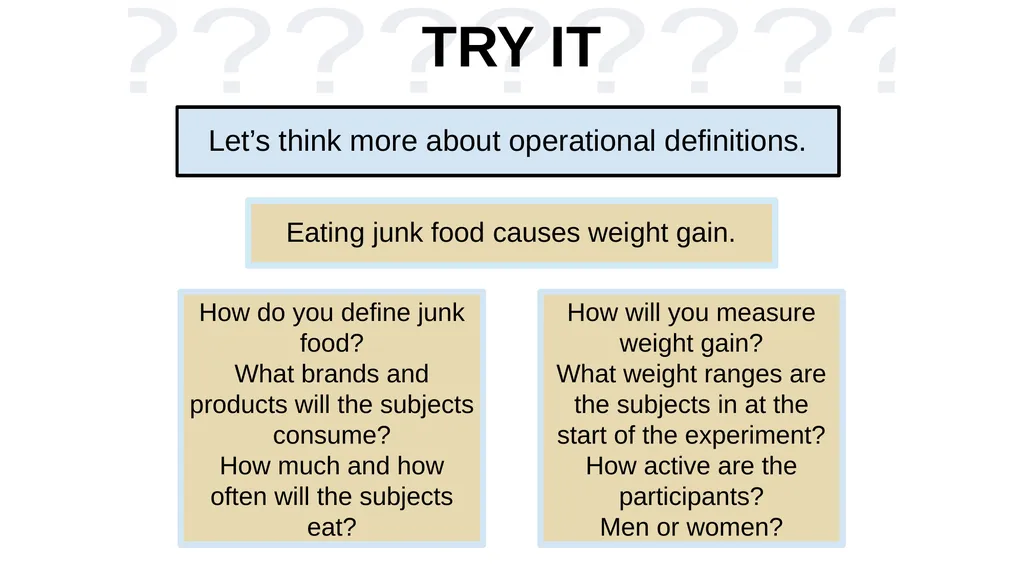
TRY IT Let’s think more about operational definitions. Eating junk food causes weight gain. How do you define junk food?
What brands and products will the subjects consume?
How much and how often will the subjects eat? How will you measure weight gain?
What weight ranges are the subjects in at the start of the experiment?
How active are the participants?
Men or women?<br>
What brands and products will the subjects consume?
How much and how often will the subjects eat? How will you measure weight gain?
What weight ranges are the subjects in at the start of the experiment?
How active are the participants?
Men or women?<br>
40
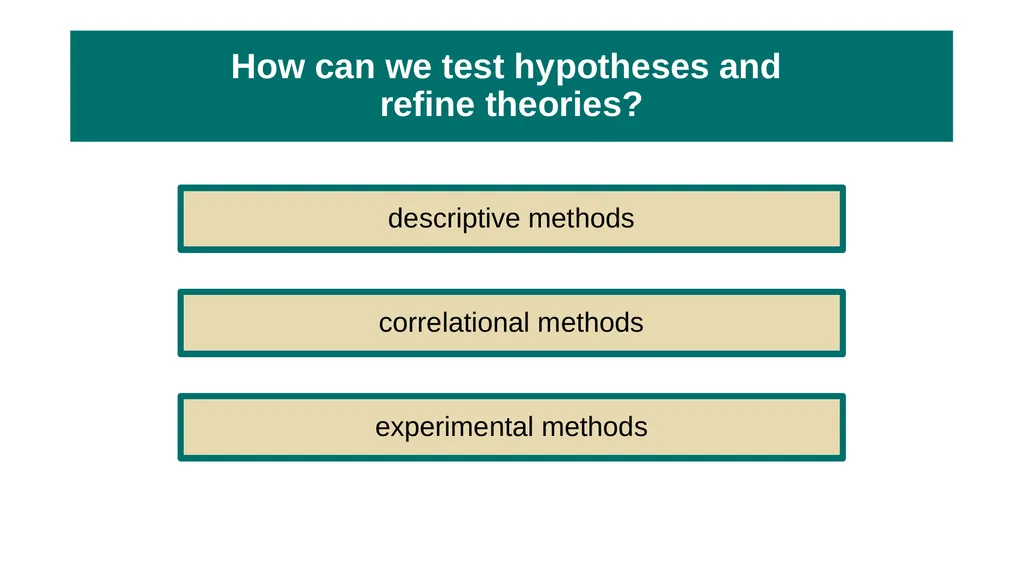
How can we test hypotheses and
refine theories? descriptive methods correlational methods experimental methods<br>
41
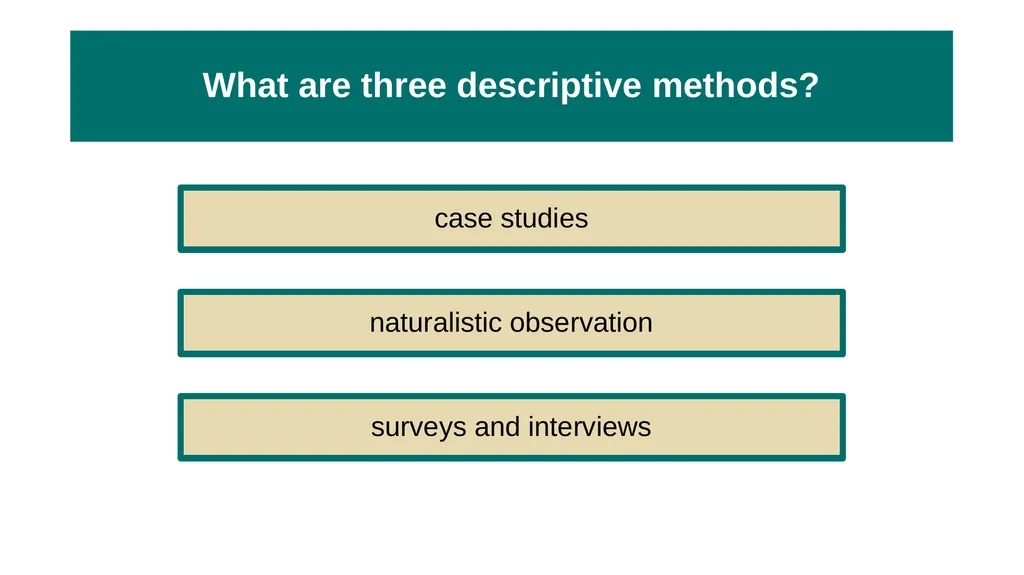
What are three descriptive methods? case studies naturalistic observation surveys and interviews<br>
42
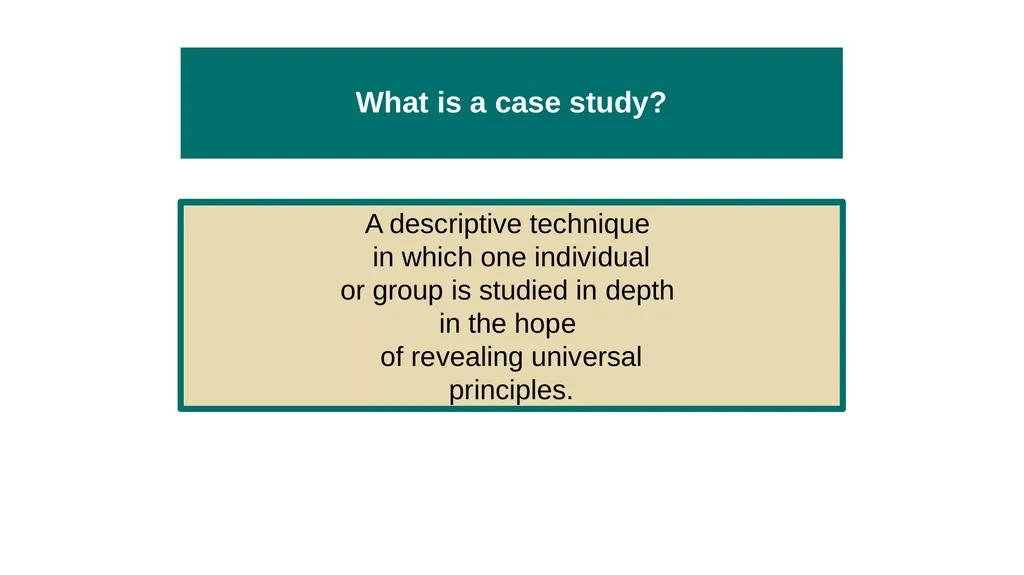
What is a case study? A descriptive technique
in which one individual
or group is studied in depth
in the hope
of revealing universal
principles.<br>
in which one individual
or group is studied in depth
in the hope
of revealing universal
principles.<br>
43
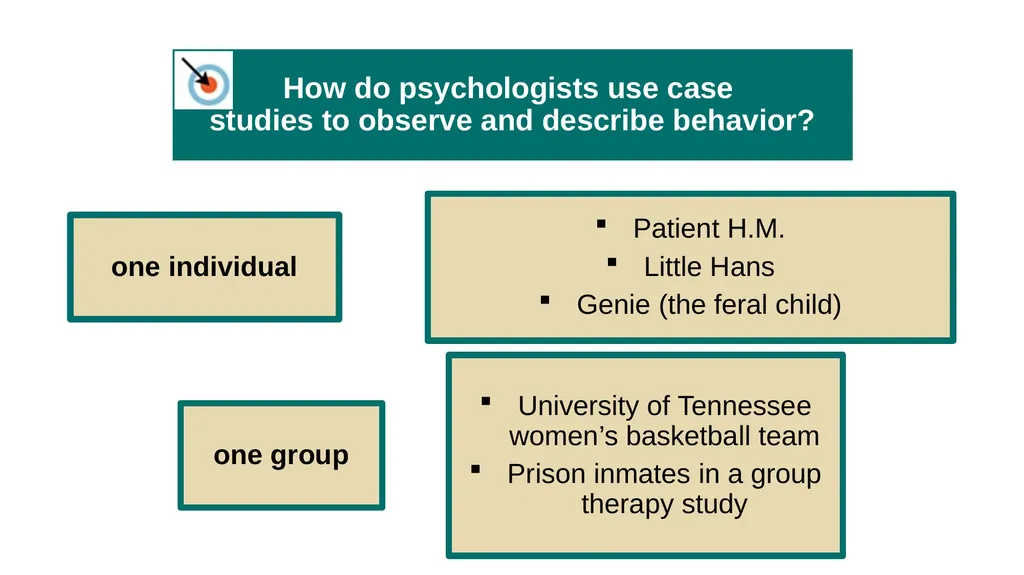
How do psychologists use case
studies to observe and describe behavior? one individual Patient H.M.
Little Hans
Genie (the feral child) one group University of Tennessee women’s basketball team
Prison inmates in a group therapy study<br>
Little Hans
Genie (the feral child) one group University of Tennessee women’s basketball team
Prison inmates in a group therapy study<br>
44
What are the strengths and limitations
of the case study method? strengths Allow for examination of rare or unusual behavior.
Provide a large amount of qualitative data.
Suggest directions
for further study. limitations Atypical case studies can be misleading.
Results from one study may not be generalizable to the larger group.
Cannot determine cause and effect.<br>
Provide a large amount of qualitative data.
Suggest directions
for further study. limitations Atypical case studies can be misleading.
Results from one study may not be generalizable to the larger group.
Cannot determine cause and effect.<br>
45
What is naturalistic observation? A descriptive technique of observing
and recording behavior in
naturally occurring situations
without trying to manipulate or
control the situation.<br>
and recording behavior in
naturally occurring situations
without trying to manipulate or
control the situation.<br>
46
How do psychologists use the
naturalistic observation method
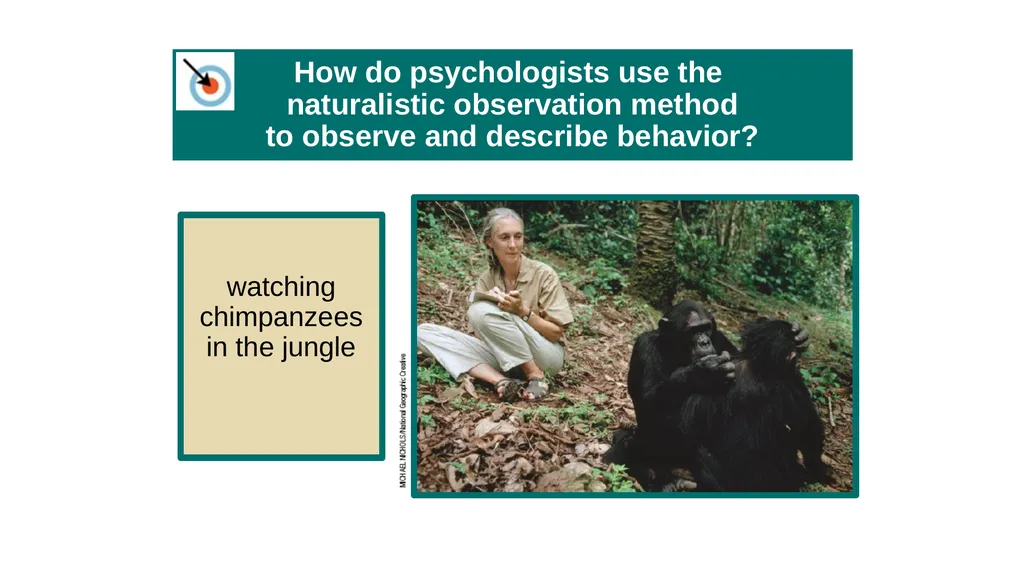
to observe and describe behavior? watching chimpanzees in the jungle<br>
47
How else do psychologists use the
naturalistic observation method
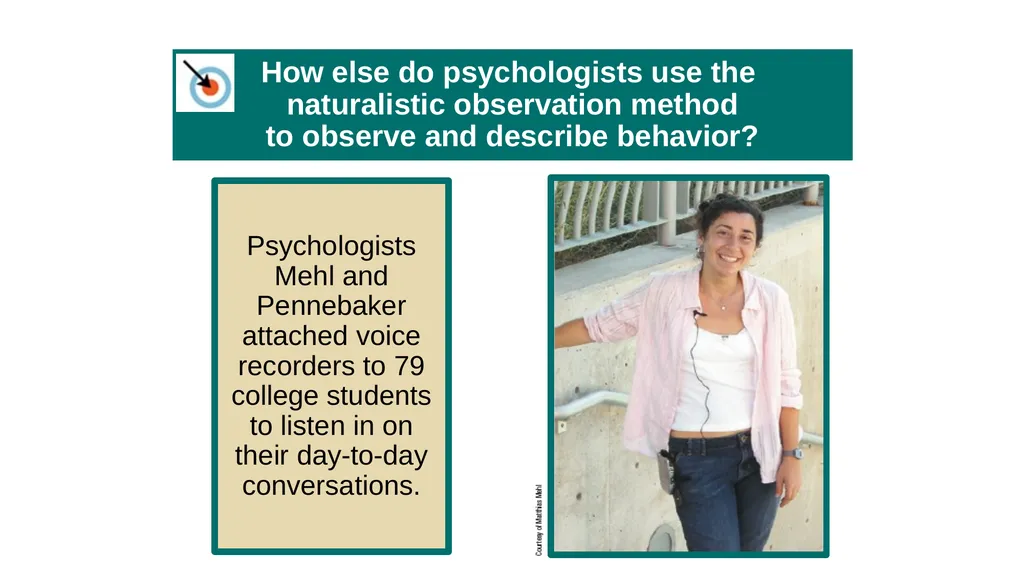
to observe and describe behavior? Psychologists Mehl and Pennebaker attached voice recorders to 79 college students to listen in on their day-to-day conversations.<br>
48
How can the
naturalistic observation method
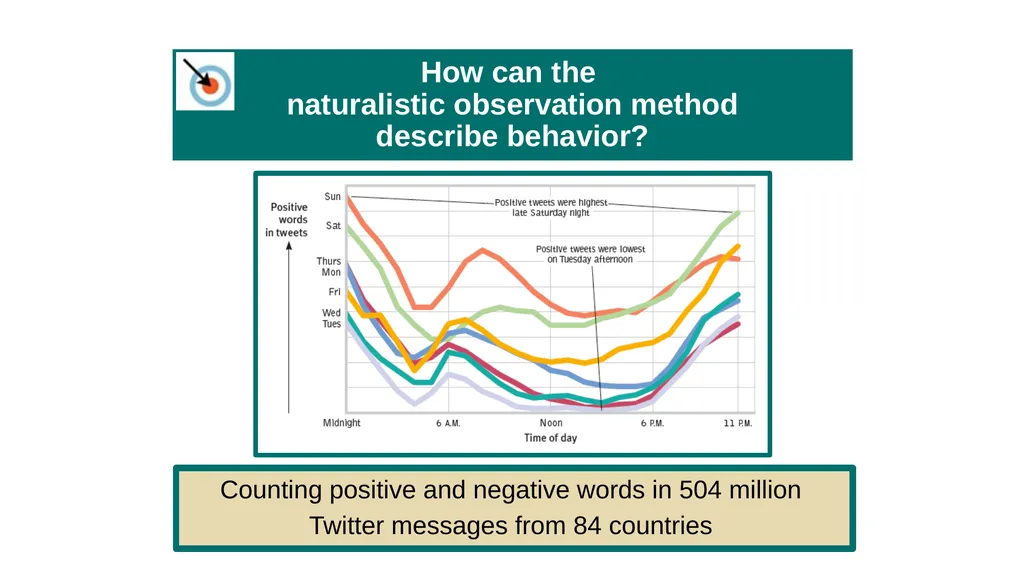
describe behavior? Counting positive and negative words in 504 million
Twitter messages from 84 countries<br>
Twitter messages from 84 countries<br>
49
What are the strengths and limitations
of the naturalistic observation method? strengths Subjects behave “normally” outside of a lab setting.
Data collection is unobtrusive (doesn’t disturb the subject). limitations Independent variable cannot be isolated.
Cannot determine cause and effect.
Observations by researchers may be subjective.<br>
Data collection is unobtrusive (doesn’t disturb the subject). limitations Independent variable cannot be isolated.
Cannot determine cause and effect.
Observations by researchers may be subjective.<br>
50
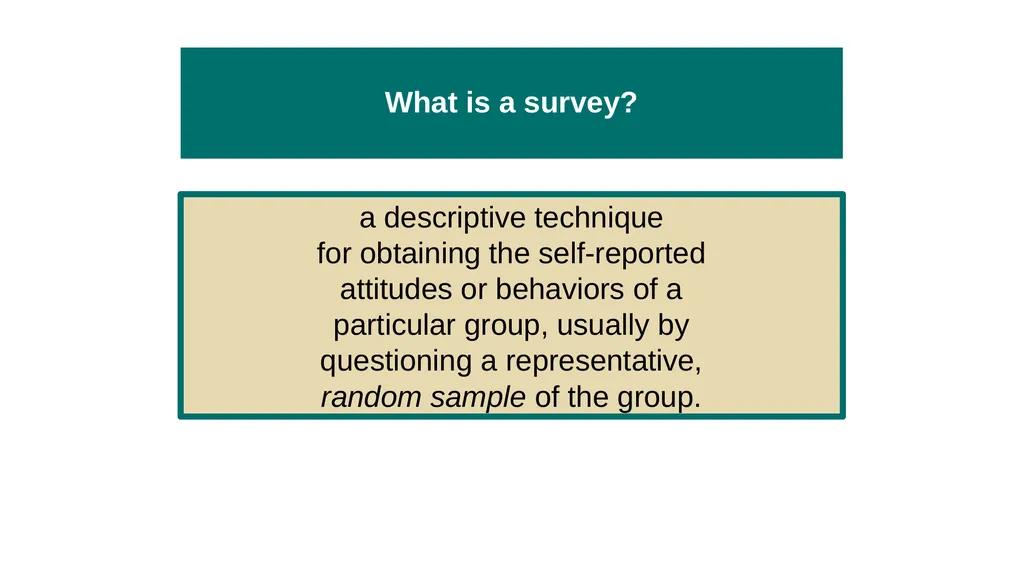
What is a survey? a descriptive technique
for obtaining the self-reported
attitudes or behaviors of a
particular group, usually by
questioning a representative,
random sample of the group.<br>
for obtaining the self-reported
attitudes or behaviors of a
particular group, usually by
questioning a representative,
random sample of the group.<br>
51
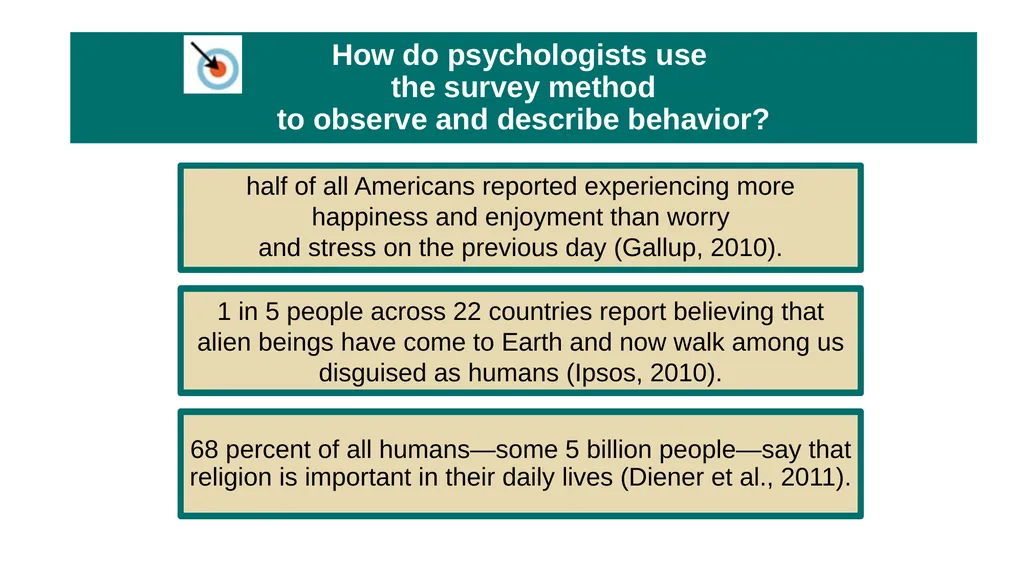
How do psychologists use
the survey method
to observe and describe behavior? half of all Americans reported experiencing more happiness and enjoyment than worry
and stress on the previous day (Gallup, 2010). 1 in 5 people across 22 countries report believing that alien beings have come to Earth and now walk among us disguised as humans (Ipsos, 2010). 68 percent of all humans—some 5 billion people—say that religion is important in their daily lives (Diener et al., 2011).<br>
and stress on the previous day (Gallup, 2010). 1 in 5 people across 22 countries report believing that alien beings have come to Earth and now walk among us disguised as humans (Ipsos, 2010). 68 percent of all humans—some 5 billion people—say that religion is important in their daily lives (Diener et al., 2011).<br>
52
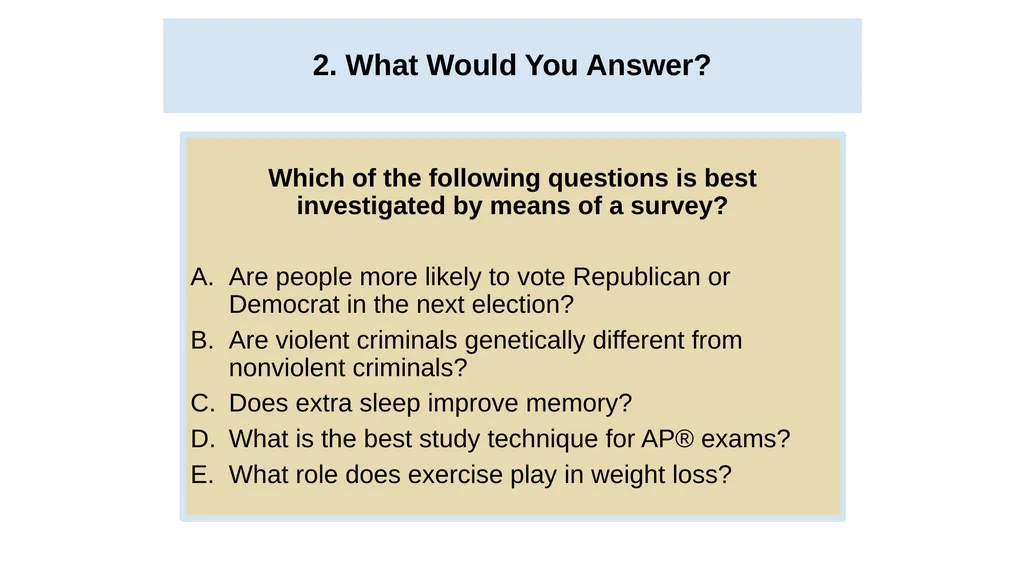
2. What Would You Answer? 2. What Would You Answer? Which of the following questions is best investigated by means of a survey?
Are people more likely to vote Republican or Democrat in the next election?
Are violent criminals genetically different from nonviolent criminals?
Does extra sleep improve memory?
What is the best study technique for AP® exams?
What role does exercise play in weight loss?<br>
Are people more likely to vote Republican or Democrat in the next election?
Are violent criminals genetically different from nonviolent criminals?
Does extra sleep improve memory?
What is the best study technique for AP® exams?
What role does exercise play in weight loss?<br>
53
What are the strengths and limitations
of the survey method? strengths able to take a “quick pulse” of people’s beliefs, behaviors or opinions
able to include many cases limitations response bias
wording effects can skew the outcomes
acquiring a random sample is difficult
cannot determine cause and effect<br>
able to include many cases limitations response bias
wording effects can skew the outcomes
acquiring a random sample is difficult
cannot determine cause and effect<br>
54
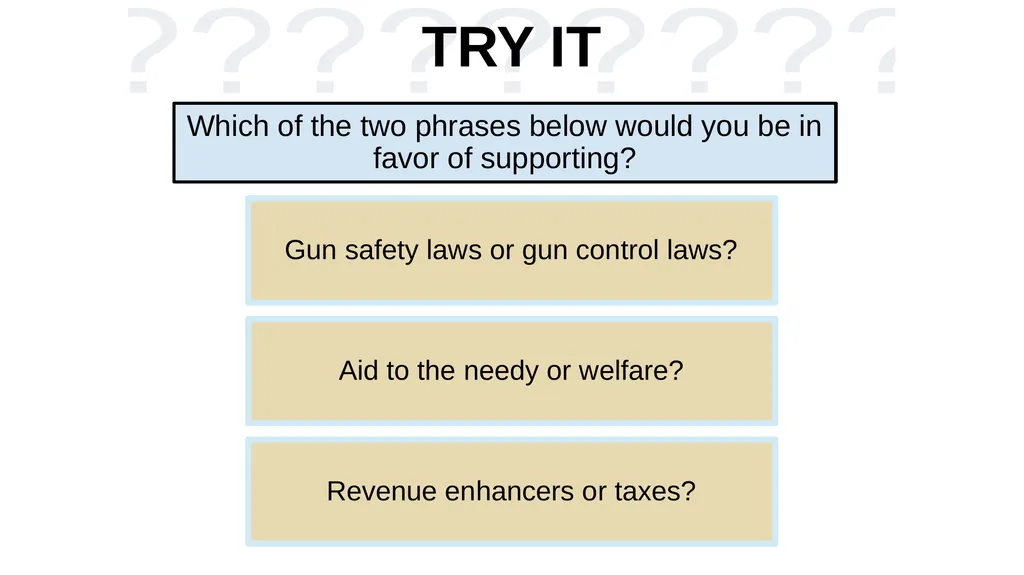
TRY IT Which of the two phrases below would you be in favor of supporting? Gun safety laws or gun control laws? Aid to the needy or welfare? Revenue enhancers or taxes?<br>
55
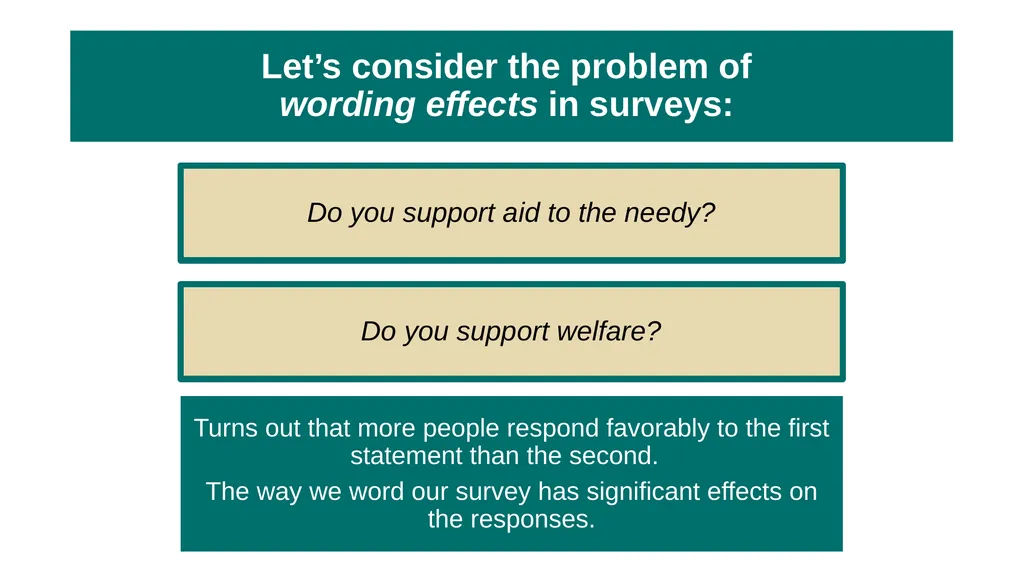
Let’s consider the problem of
wording effects in surveys: Do you support aid to the needy? Do you support welfare? Turns out that more people respond favorably to the first statement than the second.
The way we word our survey has significant effects on the responses.<br>
The way we word our survey has significant effects on the responses.<br>
56
Let’s consider the problem of
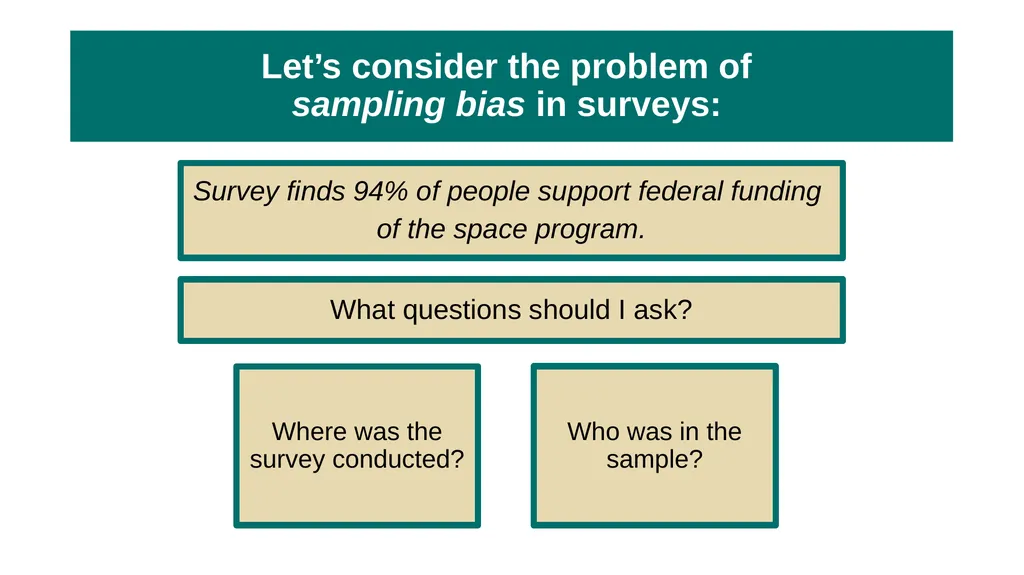
sampling bias in surveys: Survey finds 94% of people support federal funding
of the space program. What questions should I ask? Where was the survey conducted? Who was in the sample?<br>
of the space program. What questions should I ask? Where was the survey conducted? Who was in the sample?<br>
57
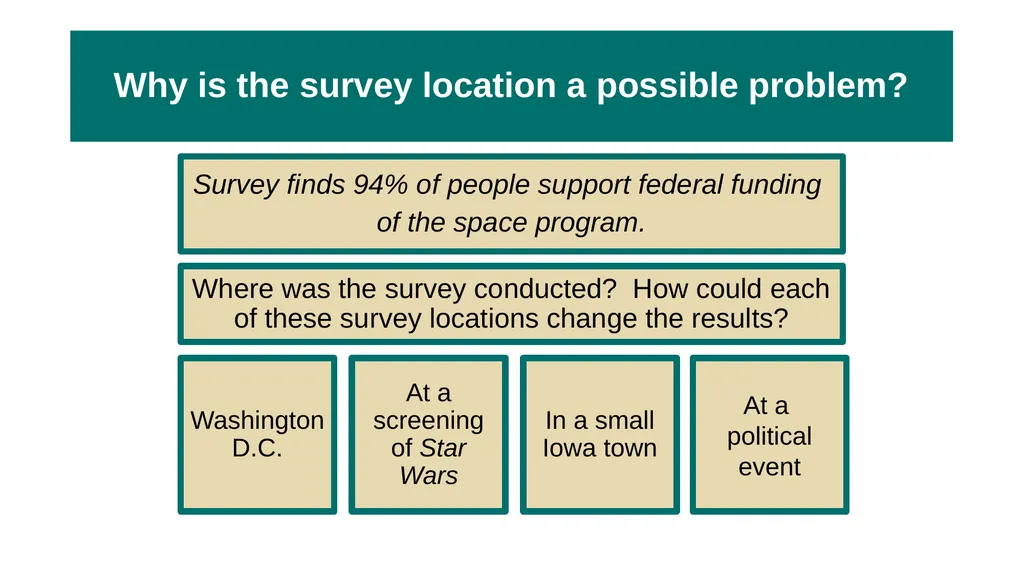
Why is the survey location a possible problem? Survey finds 94% of people support federal funding
of the space program. Where was the survey conducted? How could each of these survey locations change the results? Washington D.C. At a screening of Star Wars In a small Iowa town At a
political event<br>
of the space program. Where was the survey conducted? How could each of these survey locations change the results? Washington D.C. At a screening of Star Wars In a small Iowa town At a
political event<br>
58
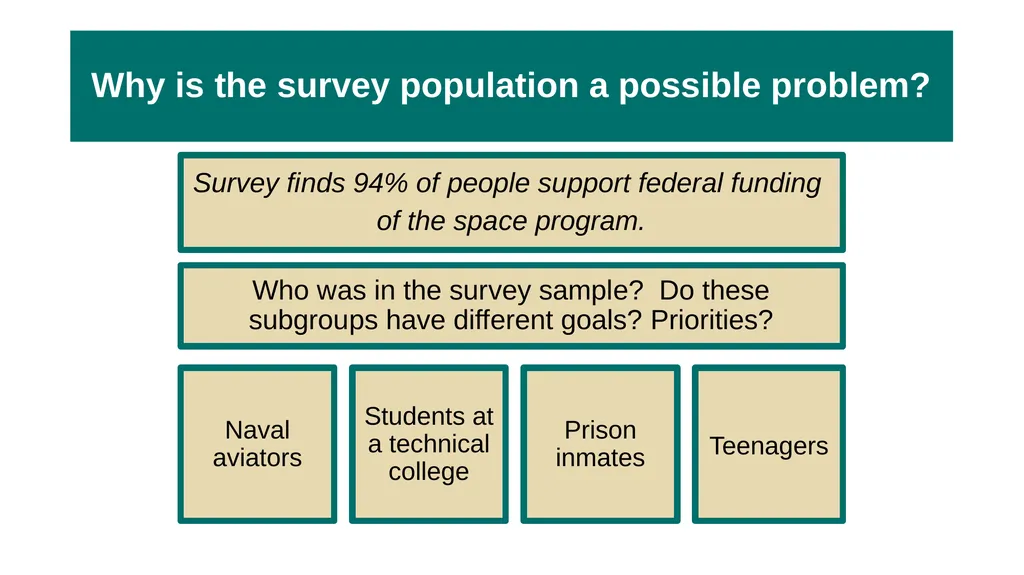
Why is the survey population a possible problem? Survey finds 94% of people support federal funding
of the space program. Who was in the survey sample? Do these subgroups have different goals? Priorities? Naval aviators Students at a technical college Prison inmates Teenagers<br>
of the space program. Who was in the survey sample? Do these subgroups have different goals? Priorities? Naval aviators Students at a technical college Prison inmates Teenagers<br>
59
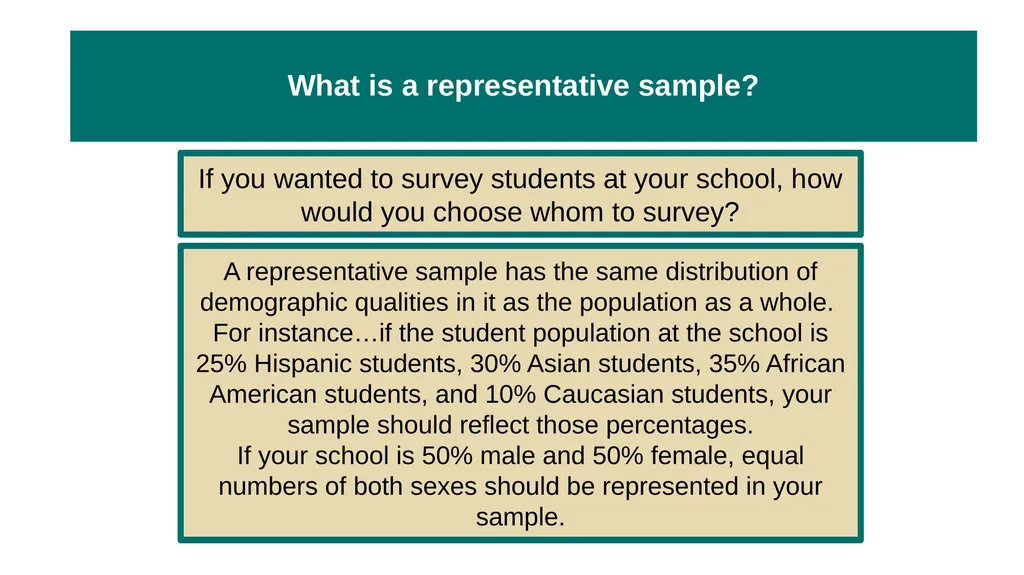
What is a representative sample? If you wanted to survey students at your school, how would you choose whom to survey? A representative sample has the same distribution of demographic qualities in it as the population as a whole. For instance…if the student population at the school is 25% Hispanic students, 30% Asian students, 35% African American students, and 10% Caucasian students, your sample should reflect those percentages.
If your school is 50% male and 50% female, equal numbers of both sexes should be represented in your sample.<br>
If your school is 50% male and 50% female, equal numbers of both sexes should be represented in your sample.<br>
60
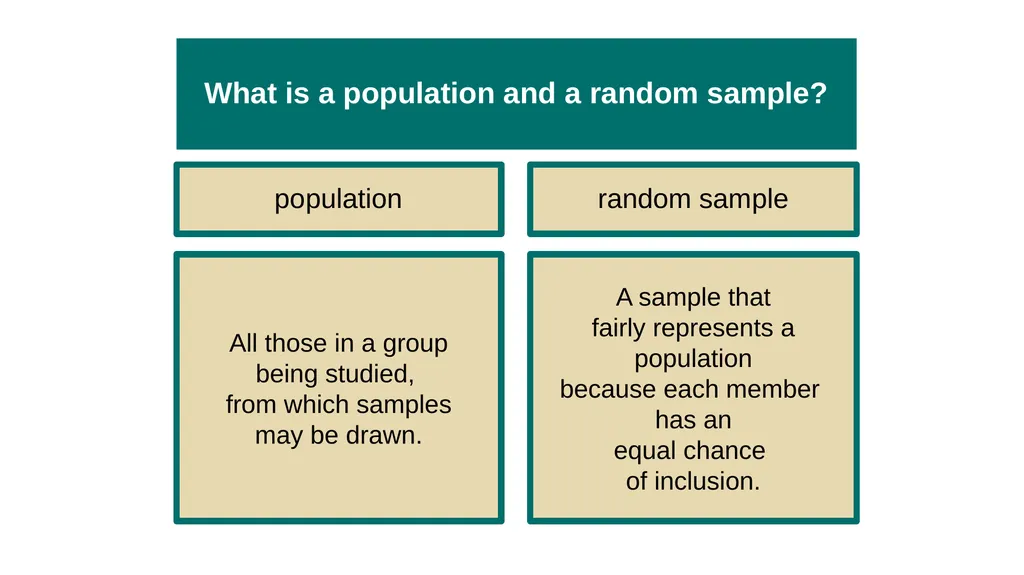
What is a population and a random sample? population All those in a group
being studied,
from which samples
may be drawn. random sample A sample that
fairly represents a population
because each member
has an
equal chance
of inclusion.<br>
being studied,
from which samples
may be drawn. random sample A sample that
fairly represents a population
because each member
has an
equal chance
of inclusion.<br>
61
TRY IT If you wanted to survey high school students about drug use… How would you identify your population? How would you create a random sample?<br>
62
3. What Would You Answer? 3. What Would You Answer? Which of the following is most important when conducting survey research?
Choosing a representative sample.
Choosing a large sample.
Choosing a biased sample.
Choosing a sample that includes every member of the population.
Choosing a sample whose answers will likely support your hypothesis.<br>
Choosing a representative sample.
Choosing a large sample.
Choosing a biased sample.
Choosing a sample that includes every member of the population.
Choosing a sample whose answers will likely support your hypothesis.<br>
63
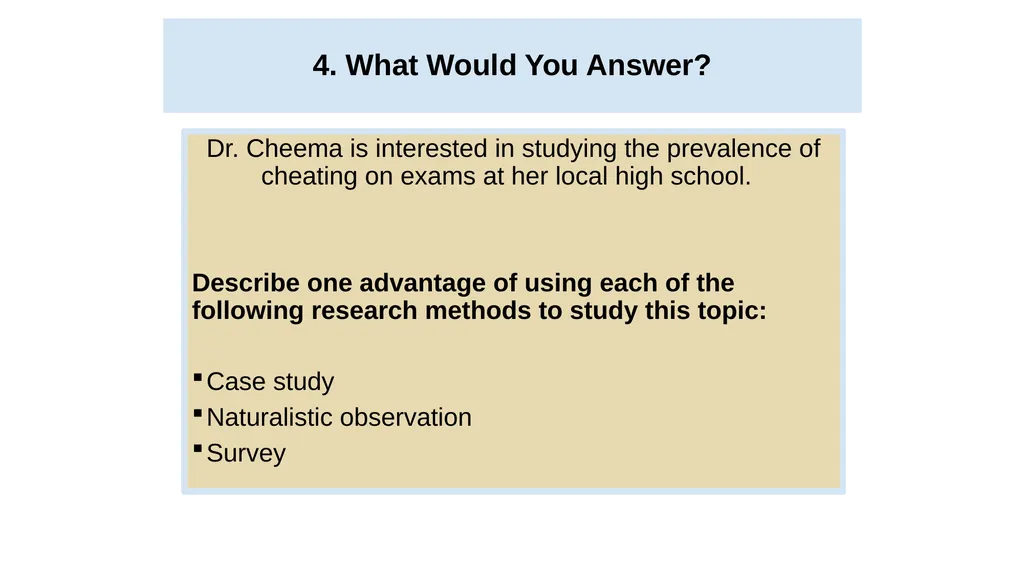
4. What Would You Answer? 4. What Would You Answer? Dr. Cheema is interested in studying the prevalence of cheating on exams at her local high school.
Describe one advantage of using each of the following research methods to study this topic:
Case study
Naturalistic observation
Survey<br>
Describe one advantage of using each of the following research methods to study this topic:
Case study
Naturalistic observation
Survey<br>
64
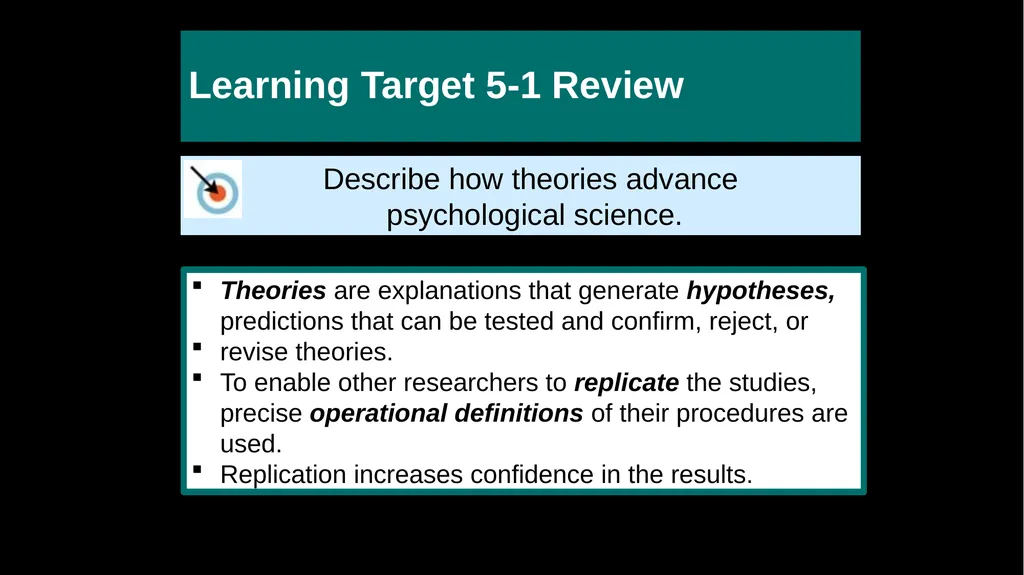
Learning Target 5-1 Review Describe how theories advance
psychological science. Theories are explanations that generate hypotheses, predictions that can be tested and confirm, reject, or
revise theories.
To enable other researchers to replicate the studies, precise operational definitions of their procedures are used.
Replication increases confidence in the results.<br>
psychological science. Theories are explanations that generate hypotheses, predictions that can be tested and confirm, reject, or
revise theories.
To enable other researchers to replicate the studies, precise operational definitions of their procedures are used.
Replication increases confidence in the results.<br>
65
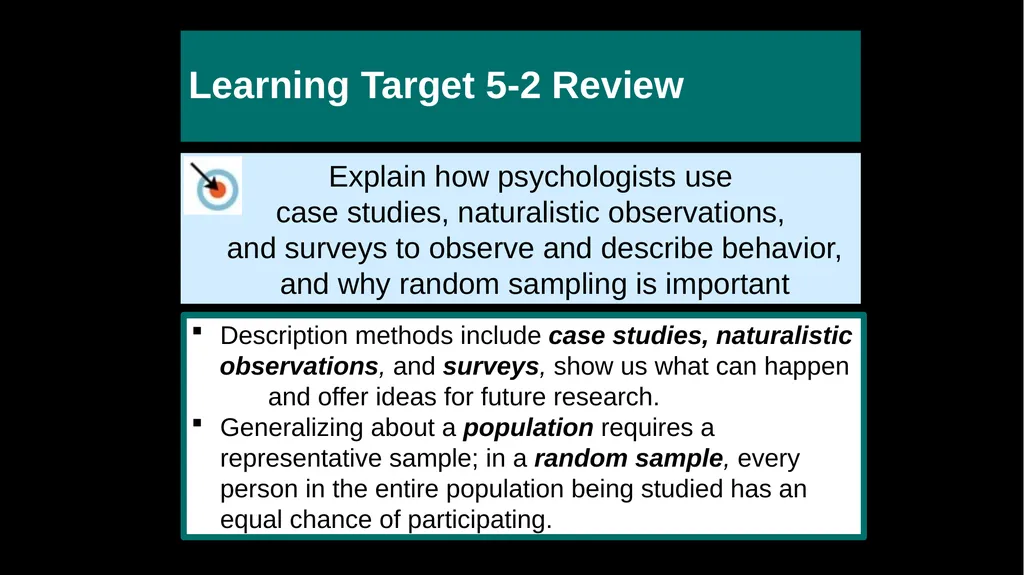
Learning Target 5-2 Review Explain how psychologists use
case studies, naturalistic observations,
and surveys to observe and describe behavior, and why random sampling is important Description methods include case studies, naturalistic
observations, and surveys, show us what can happen and offer ideas for future research.
Generalizing about a population requires a representative sample; in a random sample, every person in the entire population being studied has an equal chance of participating.<br>
case studies, naturalistic observations,
and surveys to observe and describe behavior, and why random sampling is important Description methods include case studies, naturalistic
observations, and surveys, show us what can happen and offer ideas for future research.
Generalizing about a population requires a representative sample; in a random sample, every person in the entire population being studied has an equal chance of participating.<br>
66
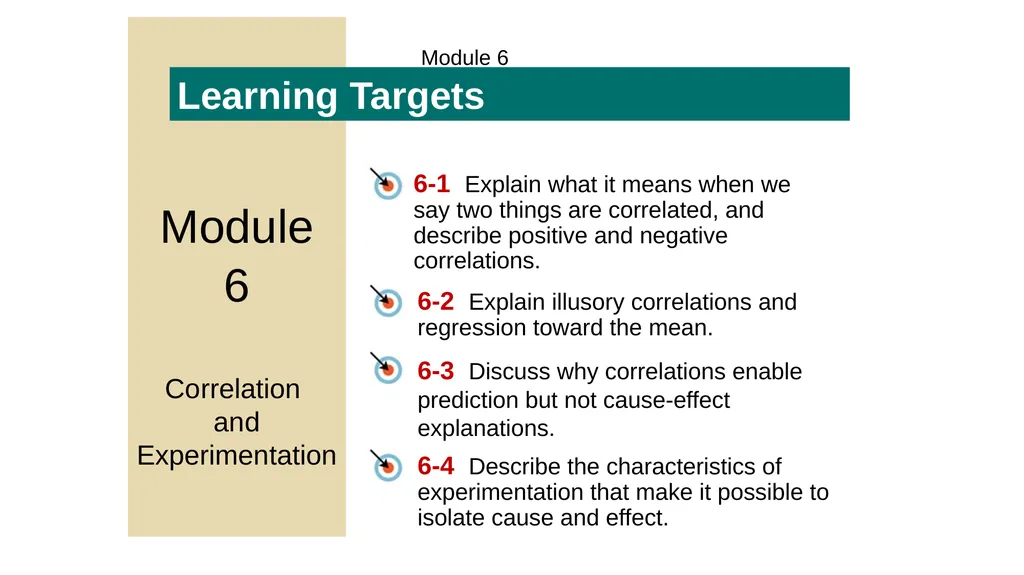
Module 6
Correlation
and Experimentation Module
6
Correlation
and Experimentation Learning Targets 6-1 Explain what it means when we say two things are correlated, and describe positive and negative correlations. 6-2 Explain illusory correlations and regression toward the mean. 6-3 Discuss why correlations enable prediction but not cause-effect explanations. 6-4 Describe the characteristics of experimentation that make it possible to isolate cause and effect.<br>
6
Correlation
and Experimentation Learning Targets 6-1 Explain what it means when we say two things are correlated, and describe positive and negative correlations. 6-2 Explain illusory correlations and regression toward the mean. 6-3 Discuss why correlations enable prediction but not cause-effect explanations. 6-4 Describe the characteristics of experimentation that make it possible to isolate cause and effect.<br>
67
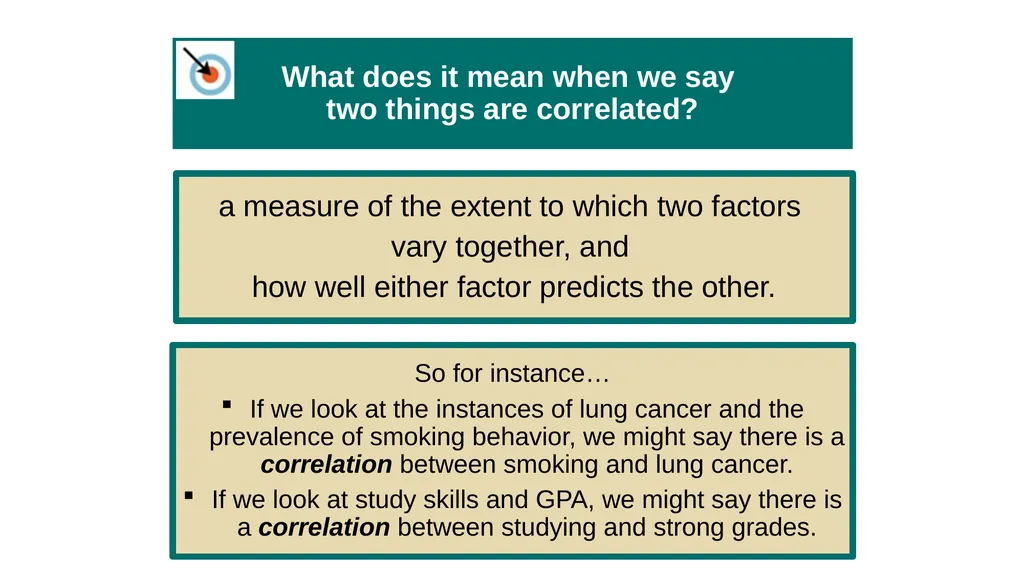
What does it mean when we say
two things are correlated? a measure of the extent to which two factors
vary together, and
how well either factor predicts the other. So for instance…
If we look at the instances of lung cancer and the prevalence of smoking behavior, we might say there is a correlation between smoking and lung cancer.
If we look at study skills and GPA, we might say there is a correlation between studying and strong grades.<br>
vary together, and
how well either factor predicts the other. So for instance…
If we look at the instances of lung cancer and the prevalence of smoking behavior, we might say there is a correlation between smoking and lung cancer.
If we look at study skills and GPA, we might say there is a correlation between studying and strong grades.<br>
68
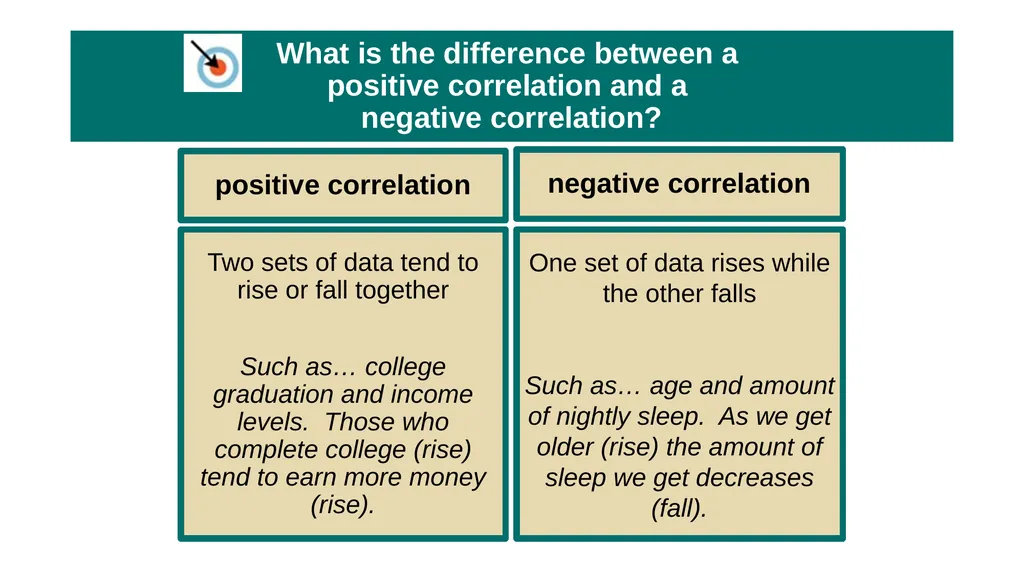
What is the difference between a
positive correlation and a
negative correlation? positive correlation Two sets of data tend to rise or fall together
Such as… college graduation and income levels. Those who complete college (rise) tend to earn more money (rise). negative correlation One set of data rises while the other falls
Such as… age and amount of nightly sleep. As we get older (rise) the amount of sleep we get decreases (fall).<br>
Such as… college graduation and income levels. Those who complete college (rise) tend to earn more money (rise). negative correlation One set of data rises while the other falls
Such as… age and amount of nightly sleep. As we get older (rise) the amount of sleep we get decreases (fall).<br>
69
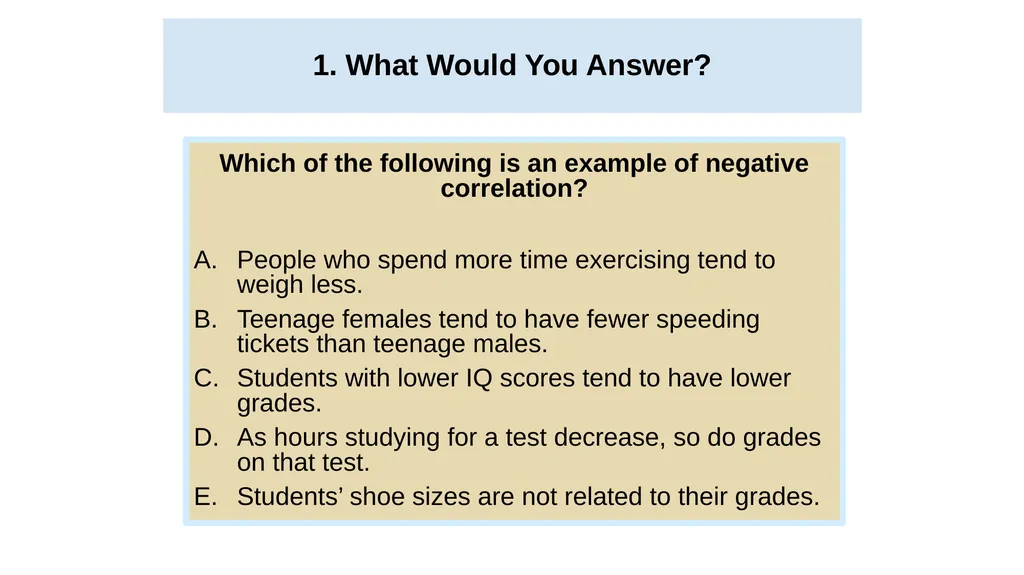
1. What Would You Answer? 1. What Would You Answer? Which of the following is an example of negative correlation?
People who spend more time exercising tend to weigh less.
Teenage females tend to have fewer speeding tickets than teenage males.
Students with lower IQ scores tend to have lower grades.
As hours studying for a test decrease, so do grades on that test.
Students’ shoe sizes are not related to their grades.<br>
People who spend more time exercising tend to weigh less.
Teenage females tend to have fewer speeding tickets than teenage males.
Students with lower IQ scores tend to have lower grades.
As hours studying for a test decrease, so do grades on that test.
Students’ shoe sizes are not related to their grades.<br>
70
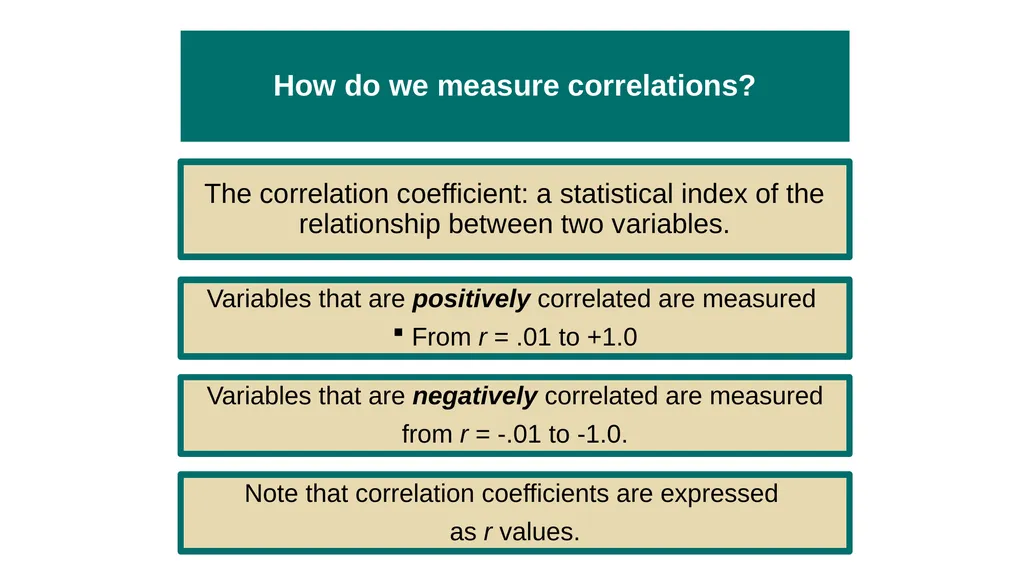
How do we measure correlations? The correlation coefficient: a statistical index of the relationship between two variables. Variables that are positively correlated are measured
From r = .01 to +1.0 Variables that are negatively correlated are measured
from r = -.01 to -1.0. Note that correlation coefficients are expressed
as r values.<br>
From r = .01 to +1.0 Variables that are negatively correlated are measured
from r = -.01 to -1.0. Note that correlation coefficients are expressed
as r values.<br>
71
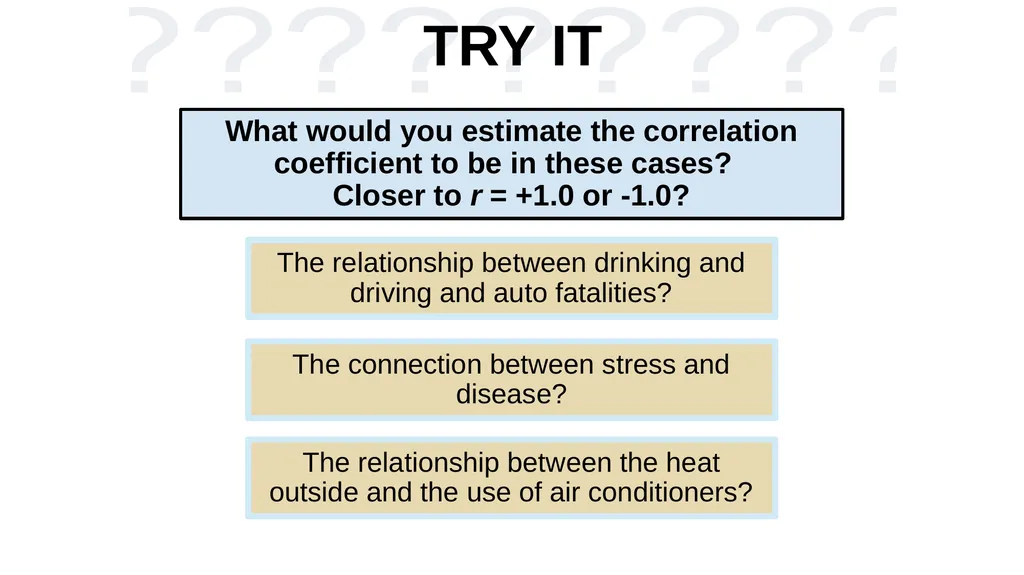
TRY IT What would you estimate the correlation coefficient to be in these cases?
Closer to r = +1.0 or -1.0? The relationship between drinking and driving and auto fatalities? The connection between stress and disease? The relationship between the heat outside and the use of air conditioners?<br>
72
What is a scatterplot? A graphed cluster of dots, each of which represents the values of two variables.
The slope of the points suggests the positive or negative direction of the relationship between the
two variables.
The amount of scatter suggests the strength of the correlation.
Values on the x and y axis must be quantified.<br>
The slope of the points suggests the positive or negative direction of the relationship between the
two variables.
The amount of scatter suggests the strength of the correlation.
Values on the x and y axis must be quantified.<br>
73
What does a positive correlation
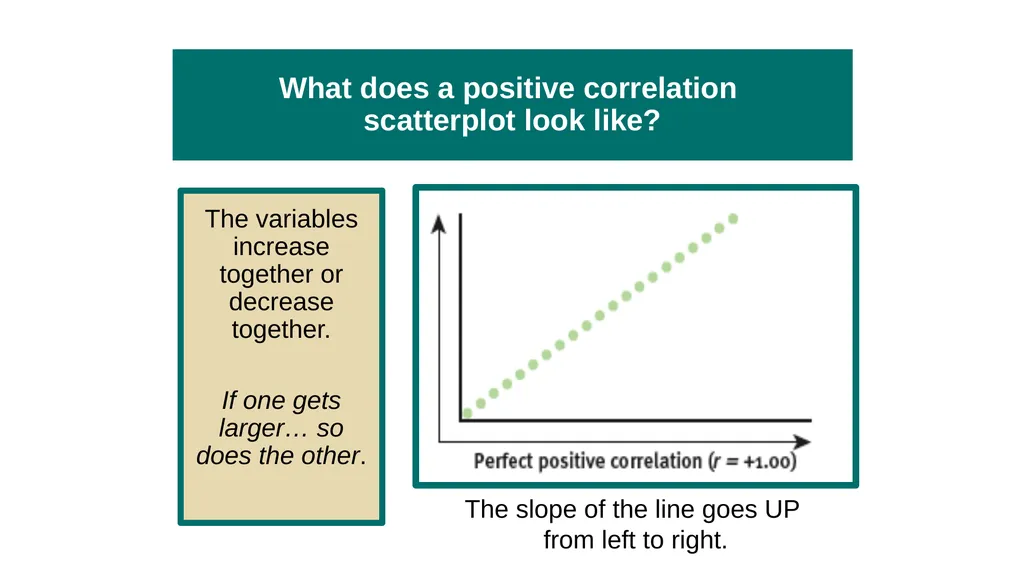
scatterplot look like? The variables increase together or decrease together.
If one gets larger… so does the other. The slope of the line goes UP
from left to right.<br>
If one gets larger… so does the other. The slope of the line goes UP
from left to right.<br>
74
What does a negative correlation
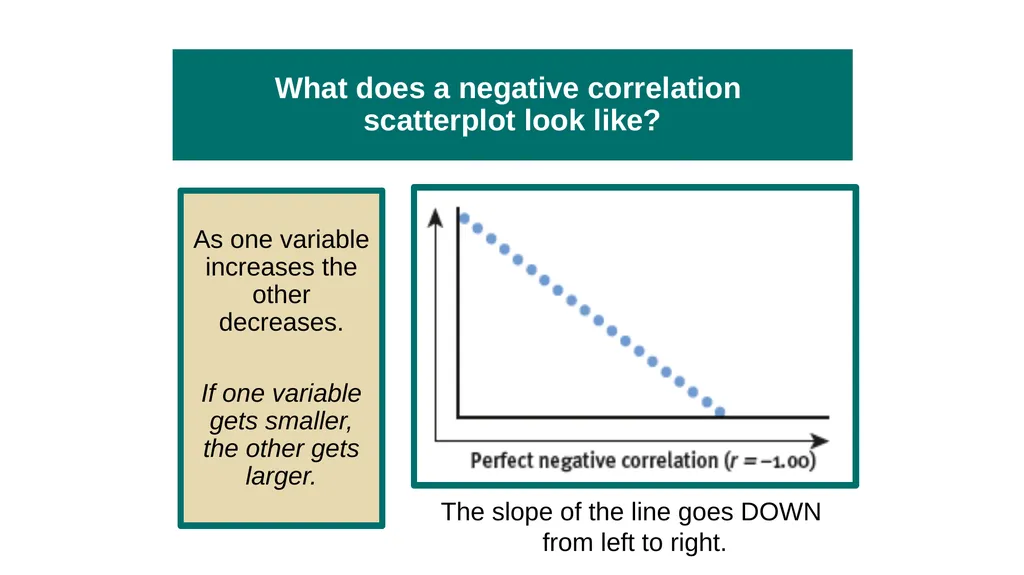
scatterplot look like? As one variable increases the other decreases.
If one variable gets smaller, the other gets larger. The slope of the line goes DOWN
from left to right.<br>
If one variable gets smaller, the other gets larger. The slope of the line goes DOWN
from left to right.<br>
75
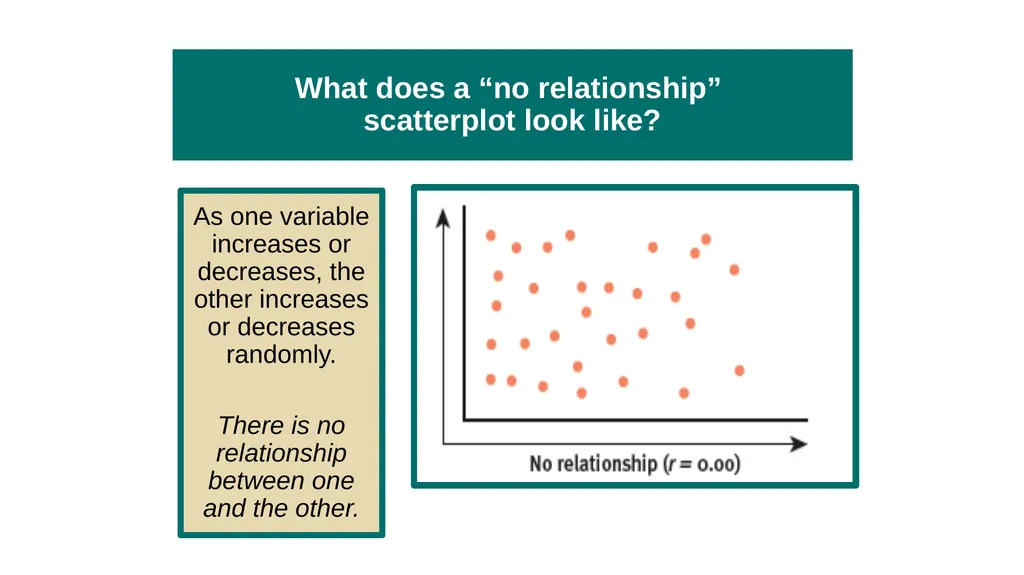
What does a “no relationship”
scatterplot look like? As one variable increases or decreases, the other increases or decreases randomly.
There is no relationship between one and the other.<br>
There is no relationship between one and the other.<br>
76
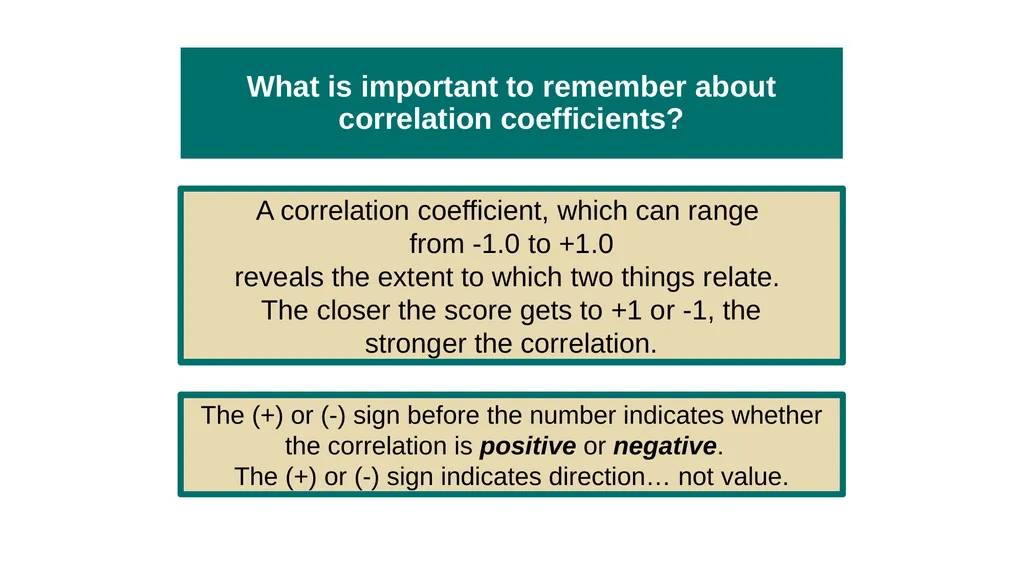
What is important to remember about correlation coefficients? A correlation coefficient, which can range
from -1.0 to +1.0
reveals the extent to which two things relate.
The closer the score gets to +1 or -1, the
stronger the correlation. The (+) or (-) sign before the number indicates whether the correlation is positive or negative.
The (+) or (-) sign indicates direction… not value.<br>
from -1.0 to +1.0
reveals the extent to which two things relate.
The closer the score gets to +1 or -1, the
stronger the correlation. The (+) or (-) sign before the number indicates whether the correlation is positive or negative.
The (+) or (-) sign indicates direction… not value.<br>
77
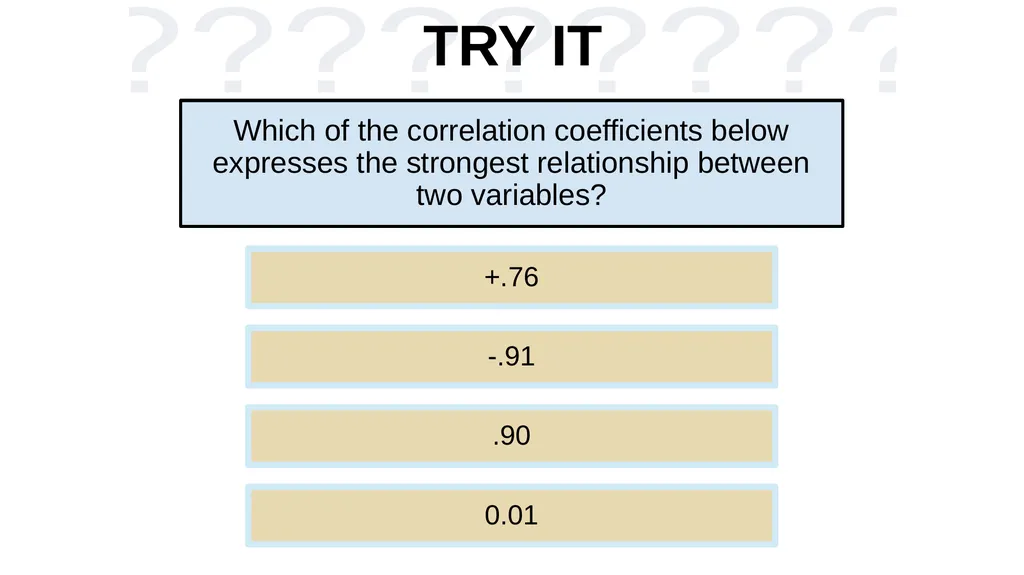
TRY IT Which of the correlation coefficients below expresses the strongest relationship between two variables? +.76 -.91 .90 0.01<br>
78
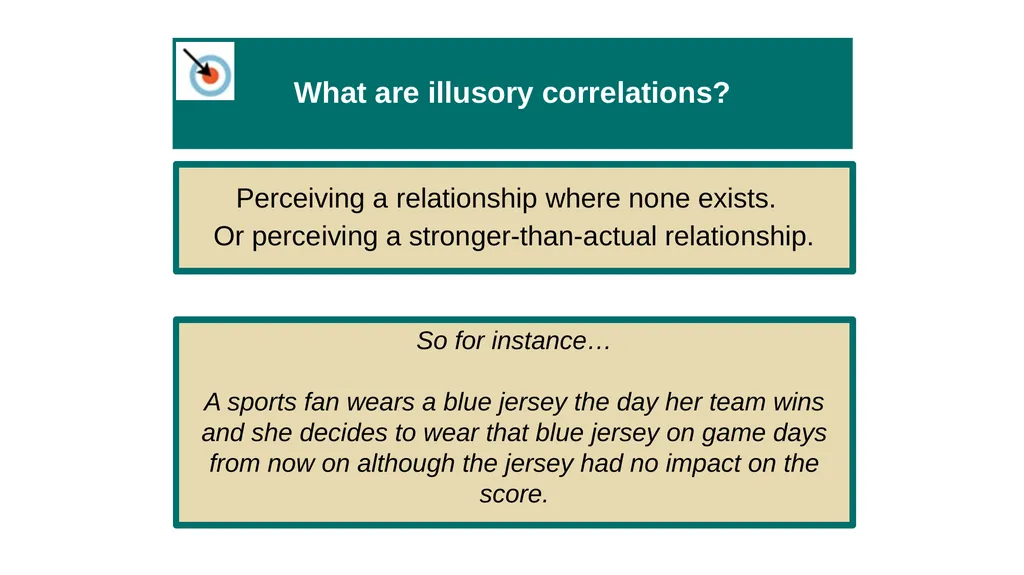
What are illusory correlations? Perceiving a relationship where none exists.
Or perceiving a stronger-than-actual relationship. So for instance…
A sports fan wears a blue jersey the day her team wins and she decides to wear that blue jersey on game days from now on although the jersey had no impact on the score.<br>
Or perceiving a stronger-than-actual relationship. So for instance…
A sports fan wears a blue jersey the day her team wins and she decides to wear that blue jersey on game days from now on although the jersey had no impact on the score.<br>
79
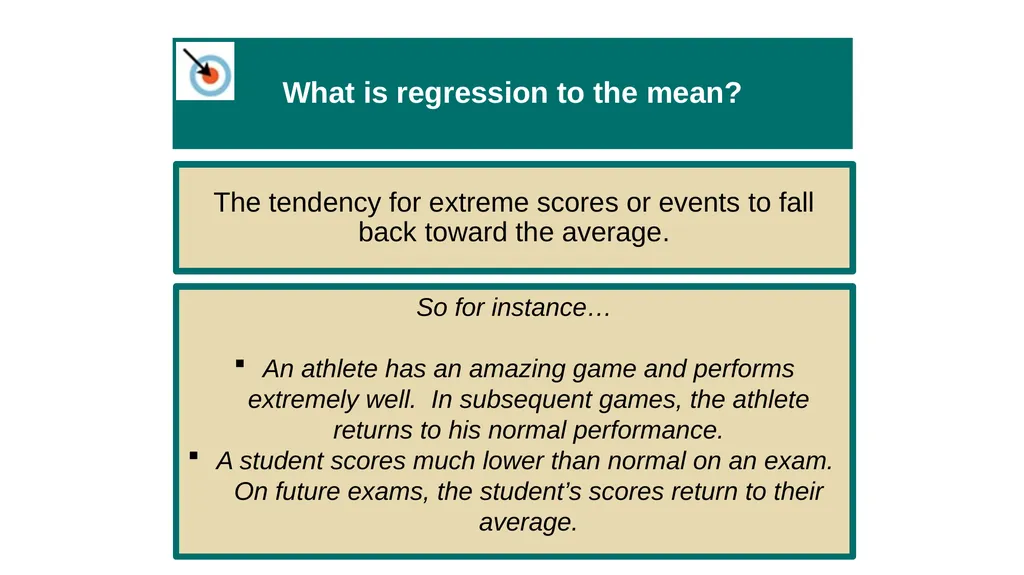
What is regression to the mean? The tendency for extreme scores or events to fall back toward the average. So for instance…
An athlete has an amazing game and performs extremely well. In subsequent games, the athlete returns to his normal performance.
A student scores much lower than normal on an exam. On future exams, the student’s scores return to their average.<br>
An athlete has an amazing game and performs extremely well. In subsequent games, the athlete returns to his normal performance.
A student scores much lower than normal on an exam. On future exams, the student’s scores return to their average.<br>
80
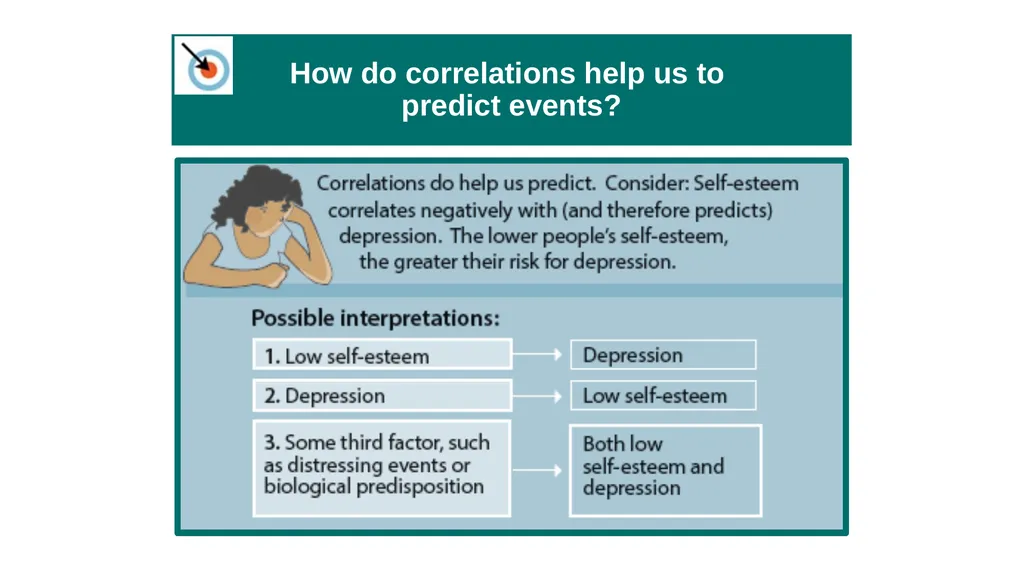
How do correlations help us to
predict events?<br>
81
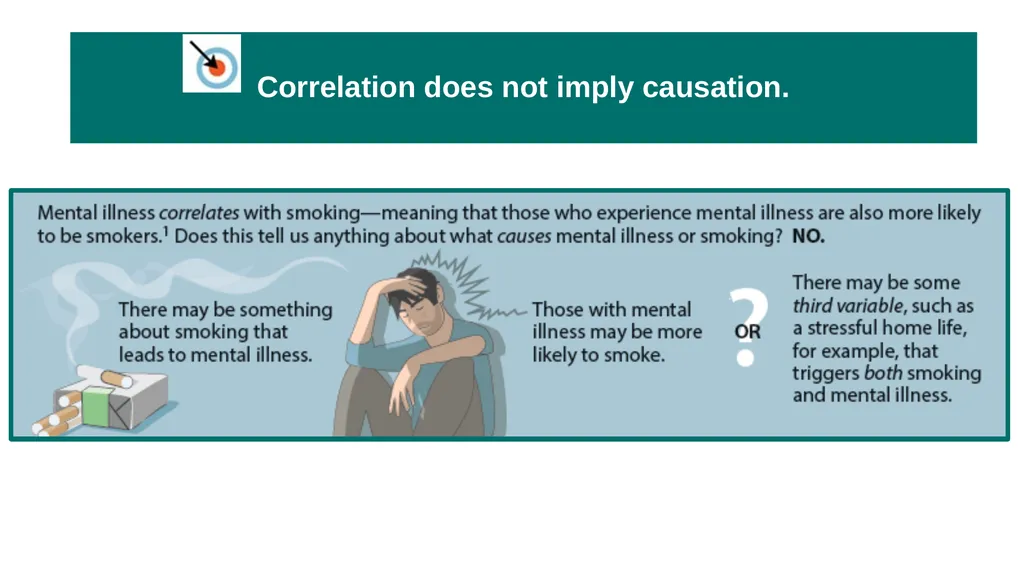
Correlation does not imply causation.<br>
82
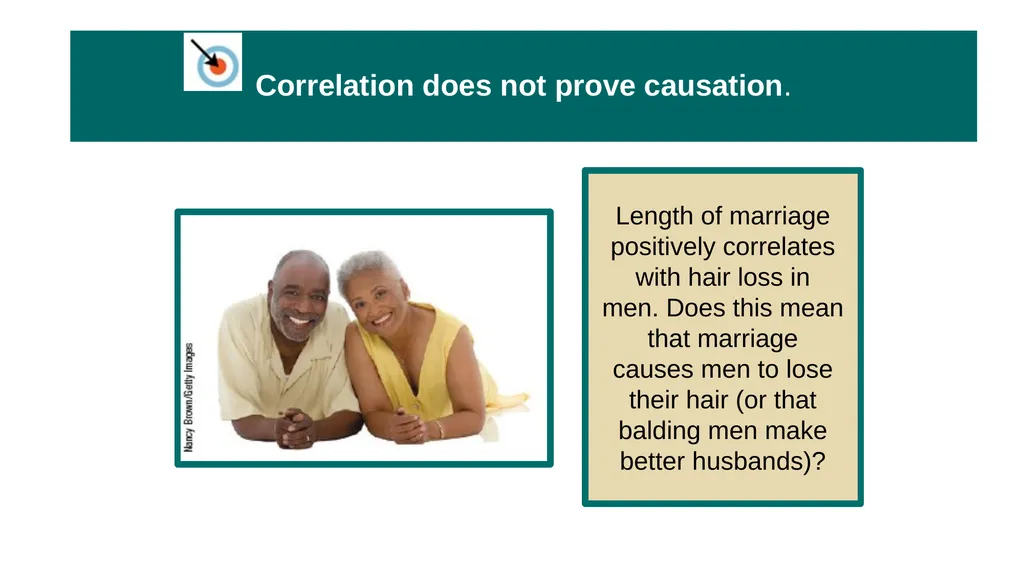
Correlation does not prove causation. Length of marriage
positively correlates with hair loss in
men. Does this mean that marriage
causes men to lose their hair (or that
balding men make better husbands)?<br>
positively correlates with hair loss in
men. Does this mean that marriage
causes men to lose their hair (or that
balding men make better husbands)?<br>
83
AP ® Exam Tip Take note of how much emphasis
is put on this idea.
Correlation and association do not prove a
cause-effect relationship. Correlation does not imply causation.<br>
is put on this idea.
Correlation and association do not prove a
cause-effect relationship. Correlation does not imply causation.<br>
84
How can experiments establish
cause and effect? Experiments enable researchers to isolate the effects of one or more factors by: (1) manipulating the factors of interest (2) holding constant (“controlling”) other factors.<br>
85
What is an example of an experiment
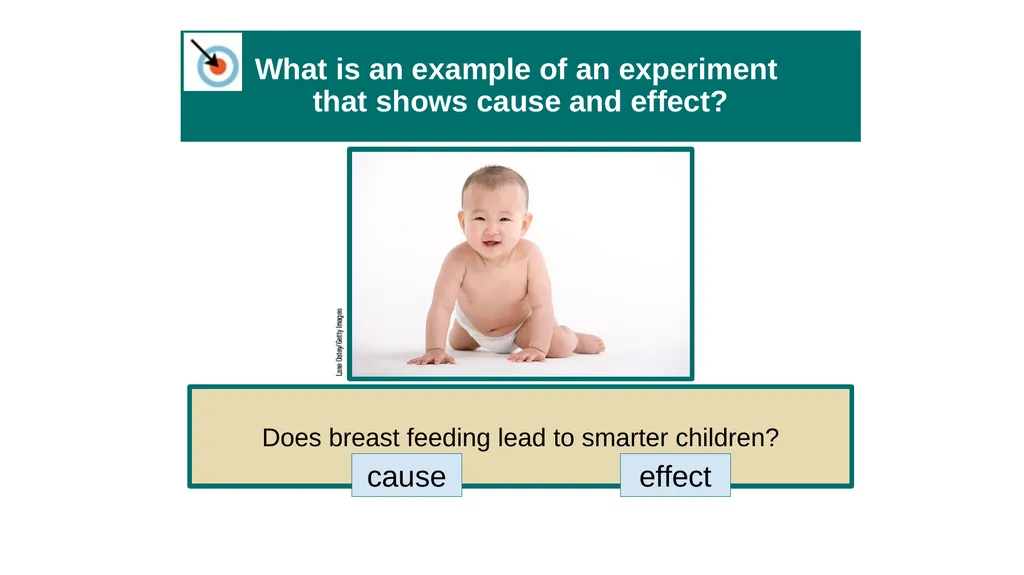
that shows cause and effect? Does breast feeding lead to smarter children? cause effect<br>
86
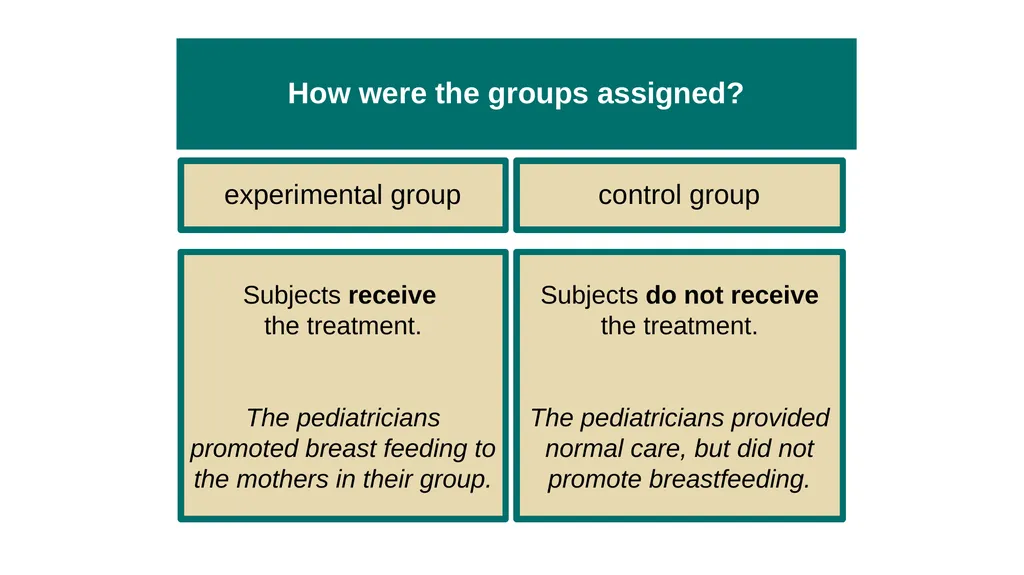
How were the groups assigned? experimental group Subjects receive
the treatment.
The pediatricians promoted breast feeding to the mothers in their group. control group Subjects do not receive the treatment.
The pediatricians provided normal care, but did not promote breastfeeding.<br>
the treatment.
The pediatricians promoted breast feeding to the mothers in their group. control group Subjects do not receive the treatment.
The pediatricians provided normal care, but did not promote breastfeeding.<br>
87
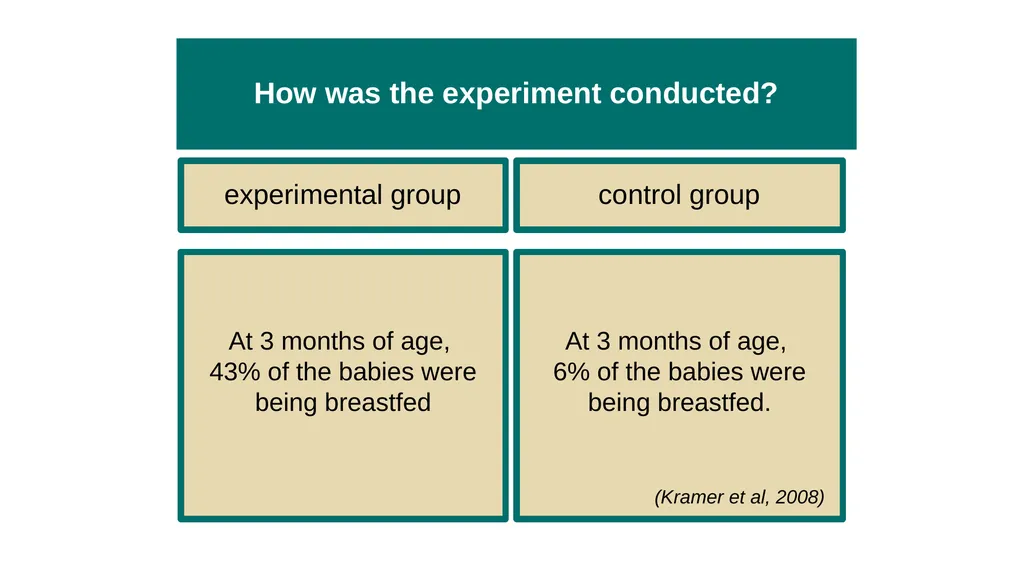
How was the experiment conducted? experimental group At 3 months of age,
43% of the babies were being breastfed control group At 3 months of age,
6% of the babies were being breastfed. (Kramer et al, 2008)<br>
43% of the babies were being breastfed control group At 3 months of age,
6% of the babies were being breastfed. (Kramer et al, 2008)<br>
88
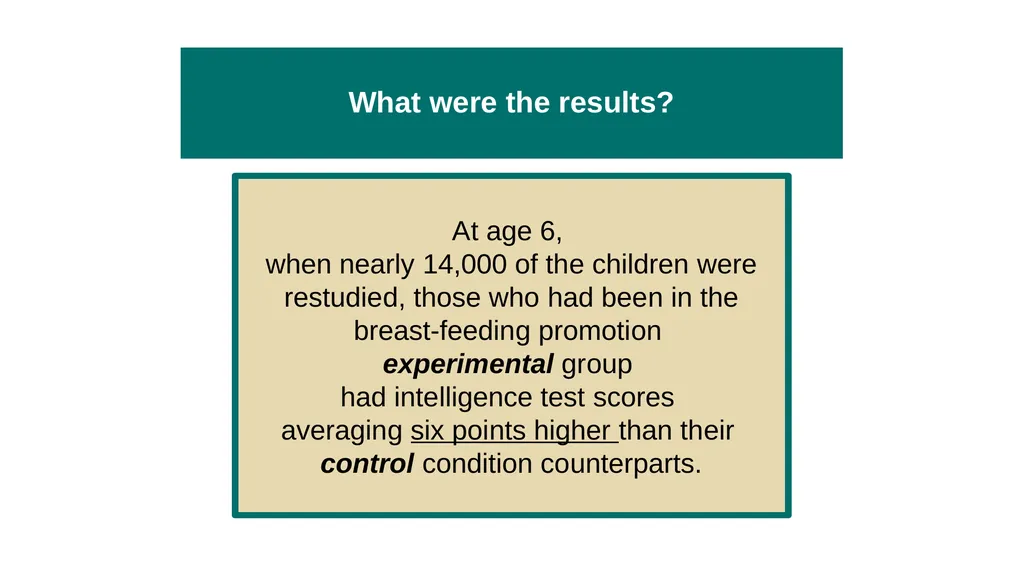
What were the results? At age 6,
when nearly 14,000 of the children were restudied, those who had been in the breast-feeding promotion
experimental group
had intelligence test scores
averaging six points higher than their
control condition counterparts.<br>
when nearly 14,000 of the children were restudied, those who had been in the breast-feeding promotion
experimental group
had intelligence test scores
averaging six points higher than their
control condition counterparts.<br>
89
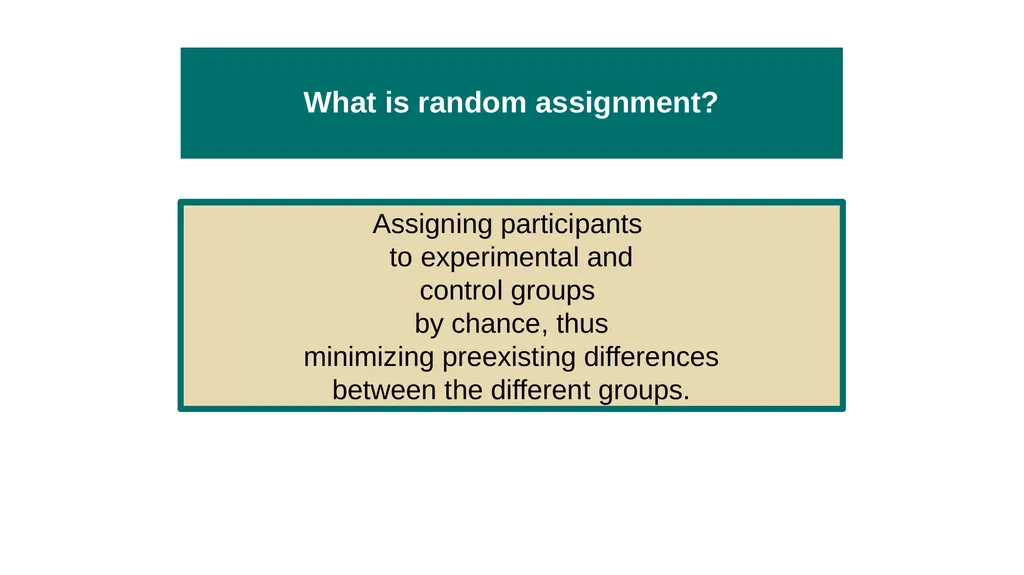
What is random assignment? Assigning participants
to experimental and
control groups
by chance, thus
minimizing preexisting differences
between the different groups.<br>
to experimental and
control groups
by chance, thus
minimizing preexisting differences
between the different groups.<br>
90
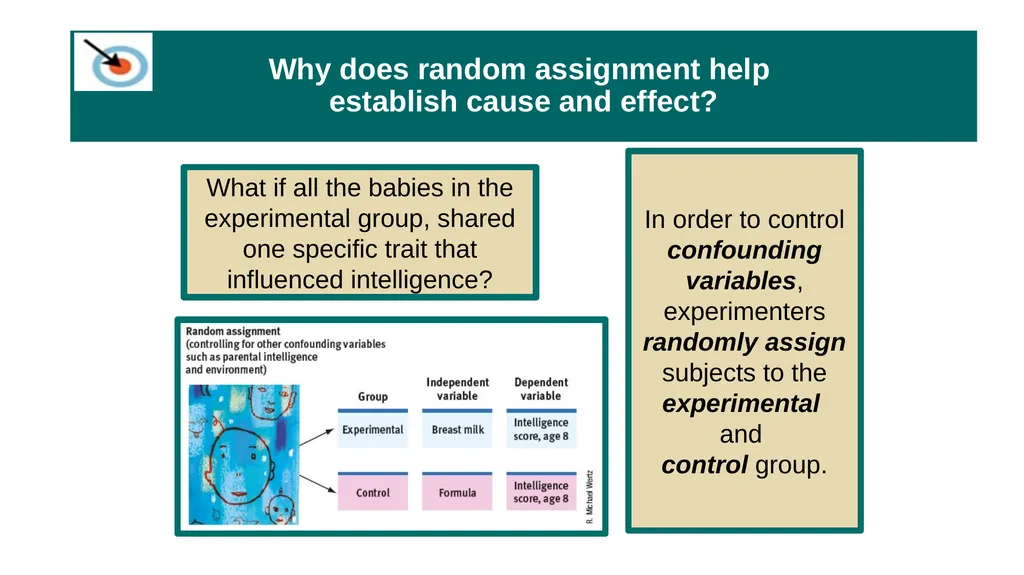
Why does random assignment help
establish cause and effect? What if all the babies in the experimental group, shared one specific trait that influenced intelligence? In order to control confounding variables, experimenters randomly assign subjects to the experimental
and
control group.<br>
and
control group.<br>
91
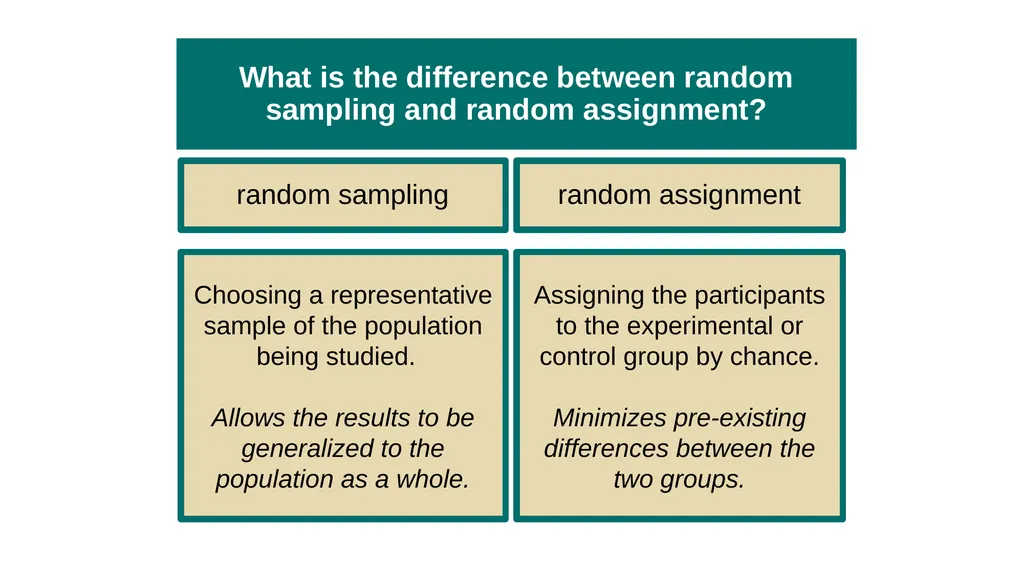
What is the difference between random sampling and random assignment? random sampling Choosing a representative sample of the population being studied.
Allows the results to be generalized to the population as a whole. random assignment Assigning the participants to the experimental or control group by chance.
Minimizes pre-existing differences between the two groups.<br>
Allows the results to be generalized to the population as a whole. random assignment Assigning the participants to the experimental or control group by chance.
Minimizes pre-existing differences between the two groups.<br>
92
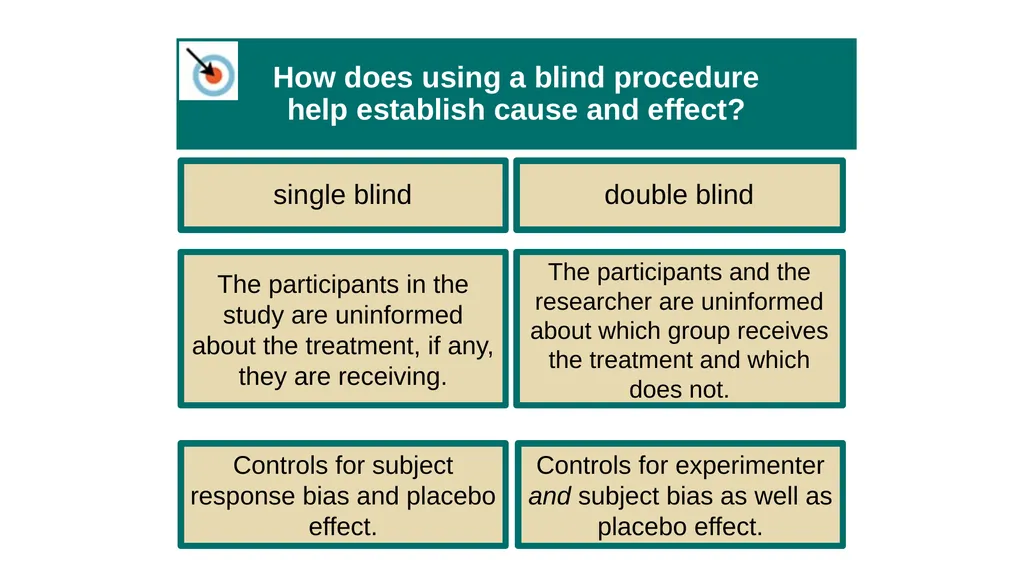
How does using a blind procedure
help establish cause and effect? single blind The participants in the study are uninformed about the treatment, if any, they are receiving. Controls for subject response bias and placebo effect. double blind The participants and the researcher are uninformed about which group receives the treatment and which does not. Controls for experimenter and subject bias as well as placebo effect.<br>
93
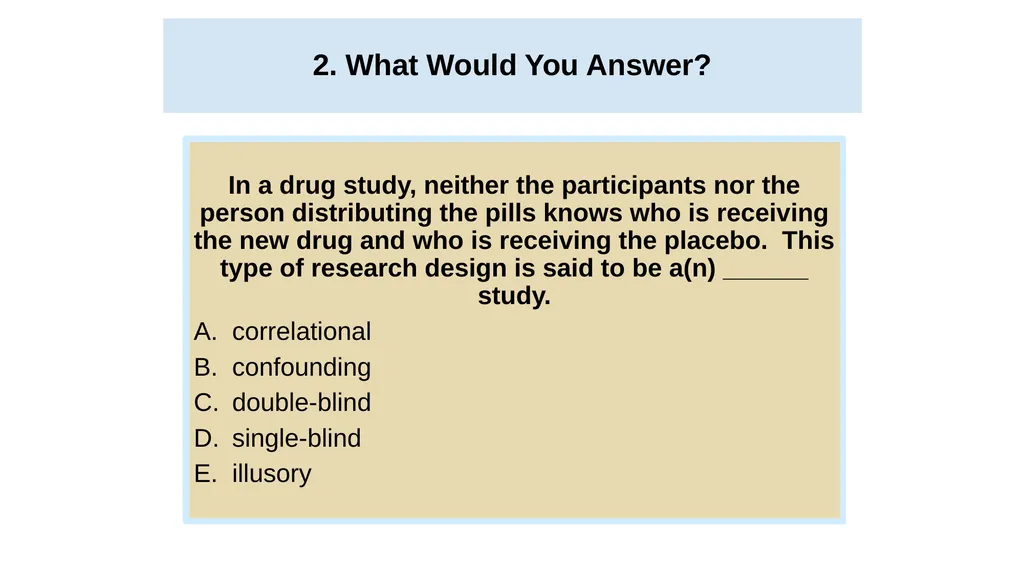
2. What Would You Answer? 2. What Would You Answer? In a drug study, neither the participants nor the person distributing the pills knows who is receiving the new drug and who is receiving the placebo. This type of research design is said to be a(n) ______ study.
correlational
confounding
double-blind
single-blind
illusory<br>
correlational
confounding
double-blind
single-blind
illusory<br>
94
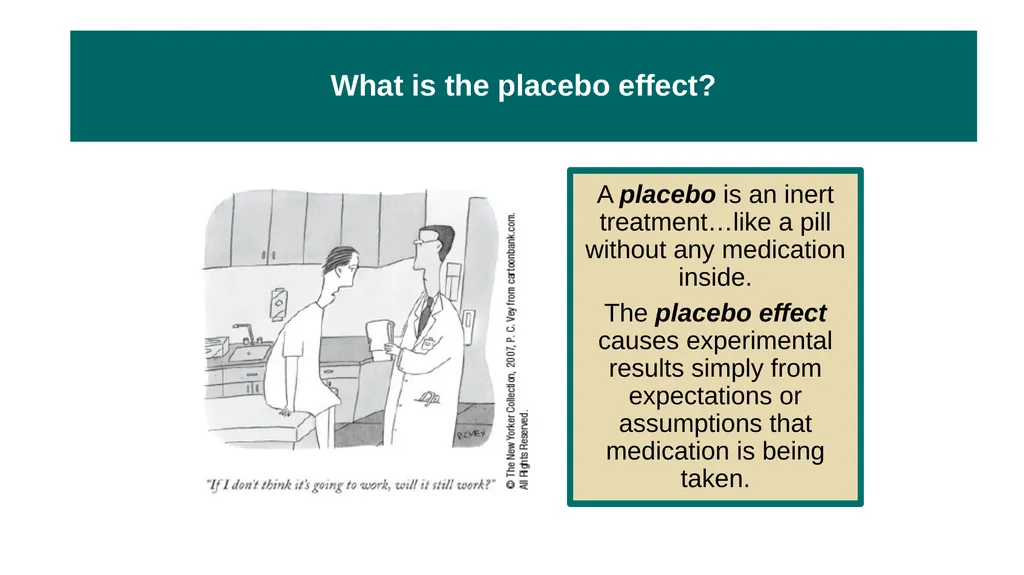
What is the placebo effect? A placebo is an inert treatment…like a pill without any medication inside.
The placebo effect causes experimental results simply from expectations or assumptions that medication is being taken.<br>
The placebo effect causes experimental results simply from expectations or assumptions that medication is being taken.<br>
95
Let’s look at the research on the
placebo effect… Athletes have run faster when given a supposed performance-enhancing drug.
(McClung & Collins, 2007) Decaf-coffee drinkers have reported increased
vigor and alertness—when they thought their
brew had caffeine in it.
(Dawkins et al., 2011) People have felt better after receiving a phony
mood-enhancing drug.
(Michael et al., 2012)<br>
(McClung & Collins, 2007) Decaf-coffee drinkers have reported increased
vigor and alertness—when they thought their
brew had caffeine in it.
(Dawkins et al., 2011) People have felt better after receiving a phony
mood-enhancing drug.
(Michael et al., 2012)<br>
96
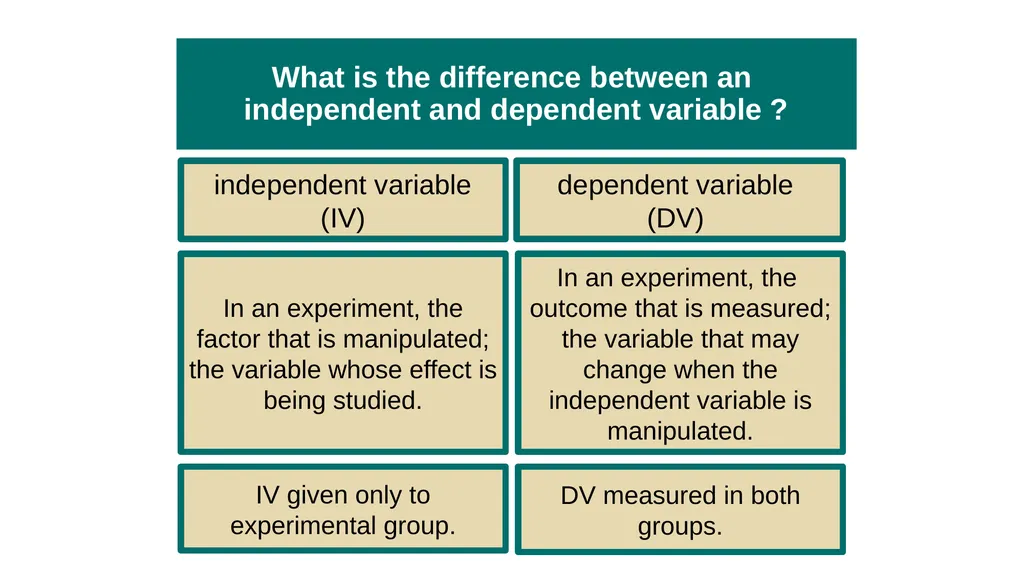
What is the difference between an
independent and dependent variable ? independent variable (IV) In an experiment, the factor that is manipulated; the variable whose effect is being studied. IV given only to experimental group. dependent variable
(DV) In an experiment, the
outcome that is measured; the variable that may
change when the independent variable is manipulated. DV measured in both groups.<br>
(DV) In an experiment, the
outcome that is measured; the variable that may
change when the independent variable is manipulated. DV measured in both groups.<br>
97
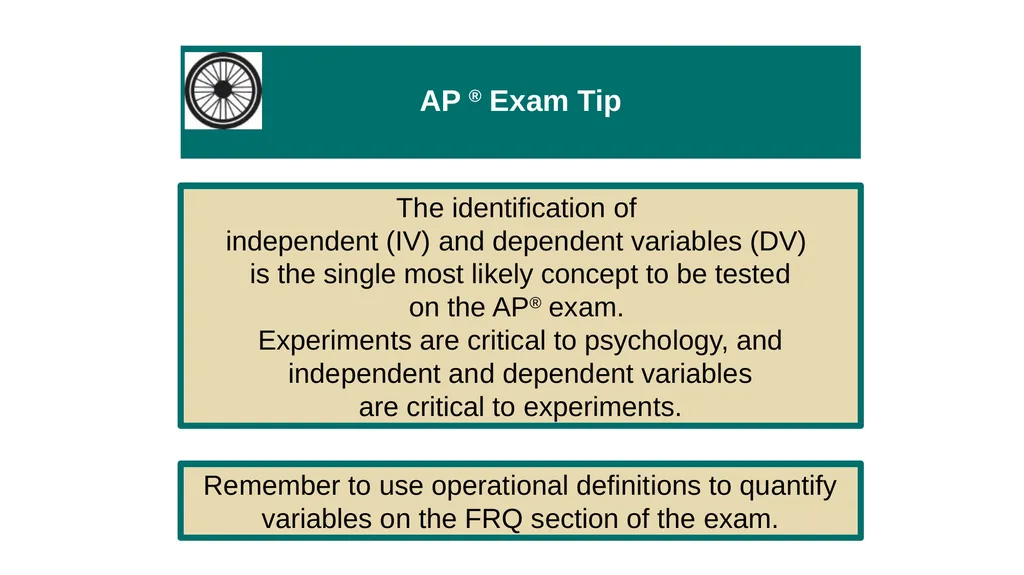
AP ® Exam Tip 2 AP ® Exam Tip The identification of
independent (IV) and dependent variables (DV)
is the single most likely concept to be tested
on the AP® exam.
Experiments are critical to psychology, and
independent and dependent variables
are critical to experiments. Remember to use operational definitions to quantify variables on the FRQ section of the exam.<br>
independent (IV) and dependent variables (DV)
is the single most likely concept to be tested
on the AP® exam.
Experiments are critical to psychology, and
independent and dependent variables
are critical to experiments. Remember to use operational definitions to quantify variables on the FRQ section of the exam.<br>
98
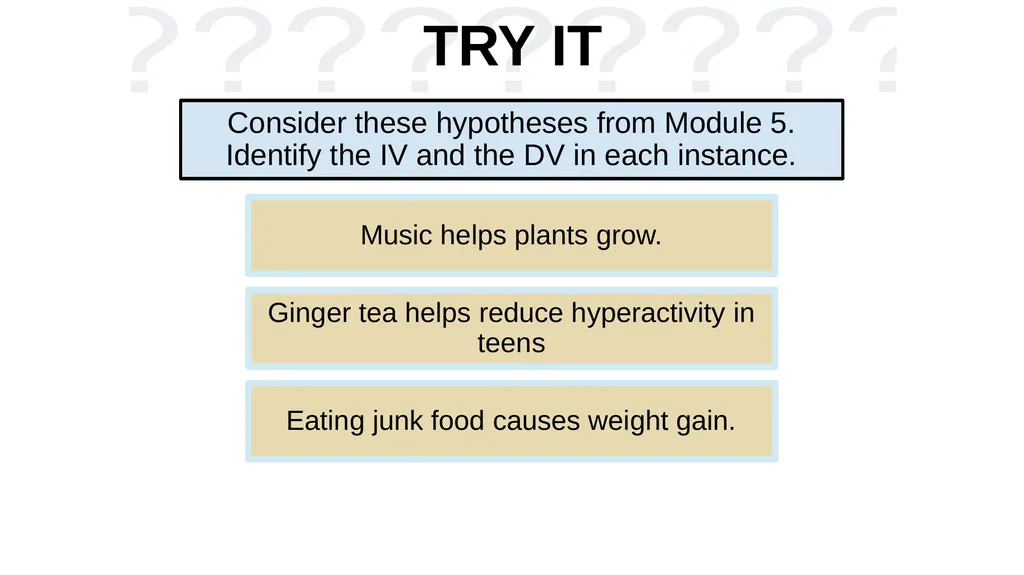
TRY IT Consider these hypotheses from Module 5. Identify the IV and the DV in each instance. Music helps plants grow. Ginger tea helps reduce hyperactivity in teens Eating junk food causes weight gain.<br>
99
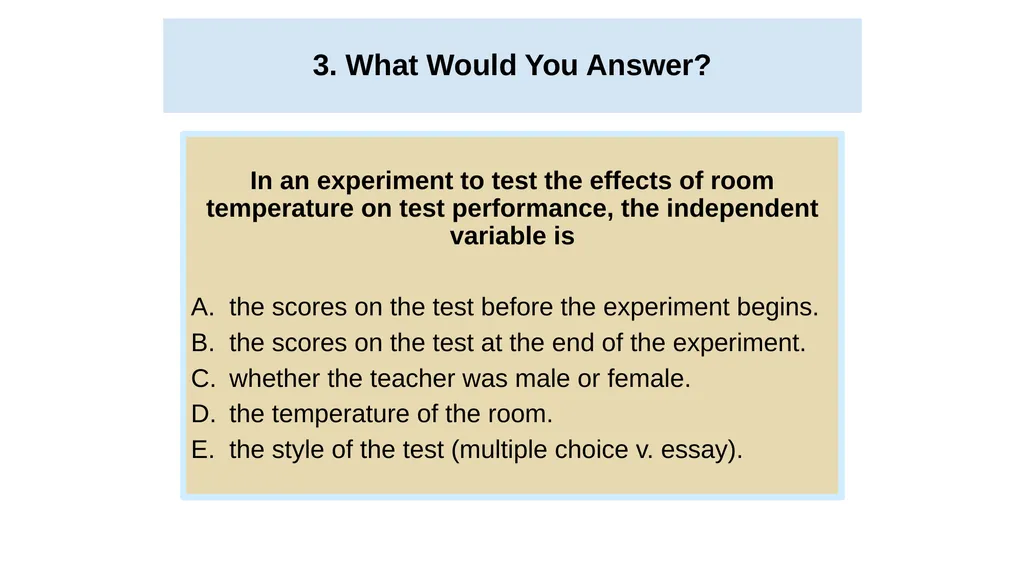
3. What Would You Answer? 3. What Would You Answer? In an experiment to test the effects of room temperature on test performance, the independent variable is
the scores on the test before the experiment begins.
the scores on the test at the end of the experiment.
whether the teacher was male or female.
the temperature of the room.
the style of the test (multiple choice v. essay).<br>
the scores on the test before the experiment begins.
the scores on the test at the end of the experiment.
whether the teacher was male or female.
the temperature of the room.
the style of the test (multiple choice v. essay).<br>
100
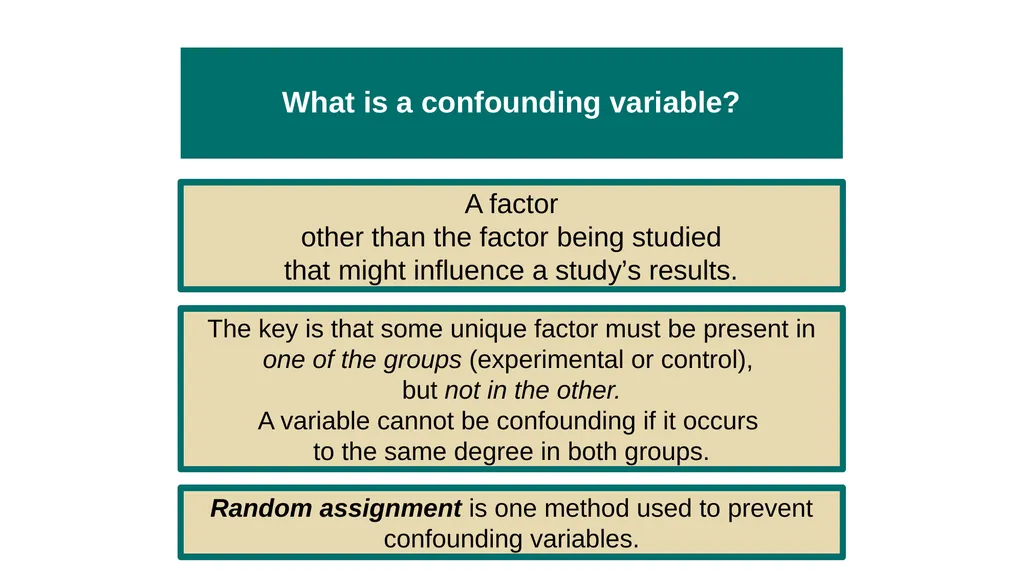
What is a confounding variable? A factor
other than the factor being studied
that might influence a study’s results. The key is that some unique factor must be present in one of the groups (experimental or control),
but not in the other.
A variable cannot be confounding if it occurs
to the same degree in both groups. Random assignment is one method used to prevent confounding variables.<br>
other than the factor being studied
that might influence a study’s results. The key is that some unique factor must be present in one of the groups (experimental or control),
but not in the other.
A variable cannot be confounding if it occurs
to the same degree in both groups. Random assignment is one method used to prevent confounding variables.<br>
101
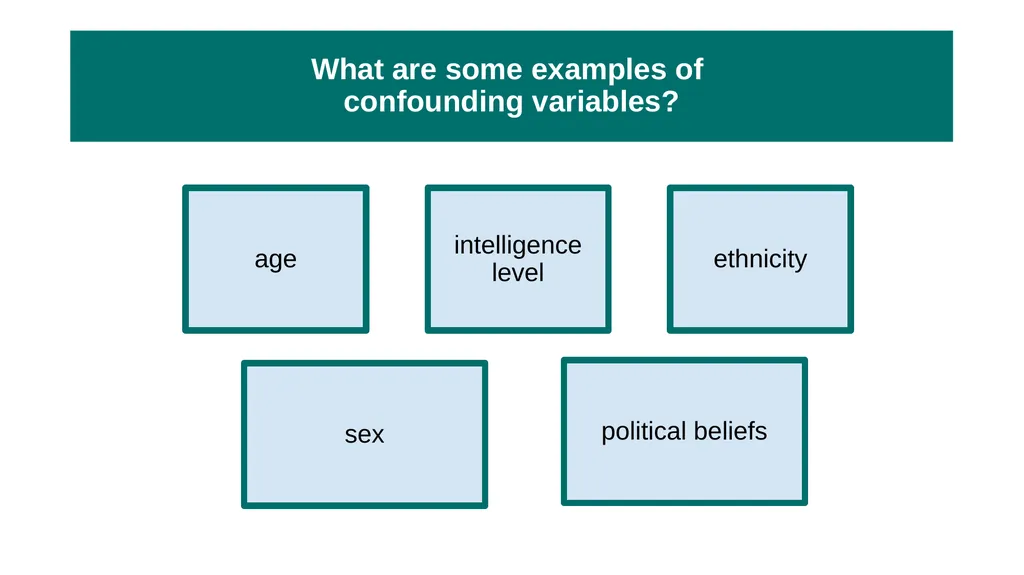
What are some examples of
confounding variables? age intelligence level ethnicity sex political beliefs<br>
102
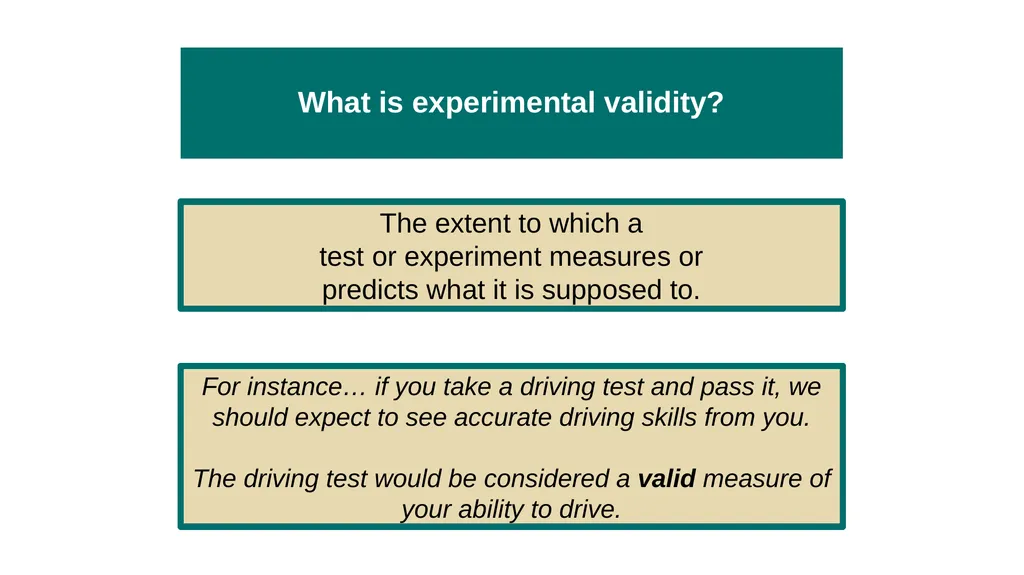
What is experimental validity? The extent to which a
test or experiment measures or
predicts what it is supposed to. For instance… if you take a driving test and pass it, we should expect to see accurate driving skills from you.
The driving test would be considered a valid measure of your ability to drive.<br>
test or experiment measures or
predicts what it is supposed to. For instance… if you take a driving test and pass it, we should expect to see accurate driving skills from you.
The driving test would be considered a valid measure of your ability to drive.<br>
103
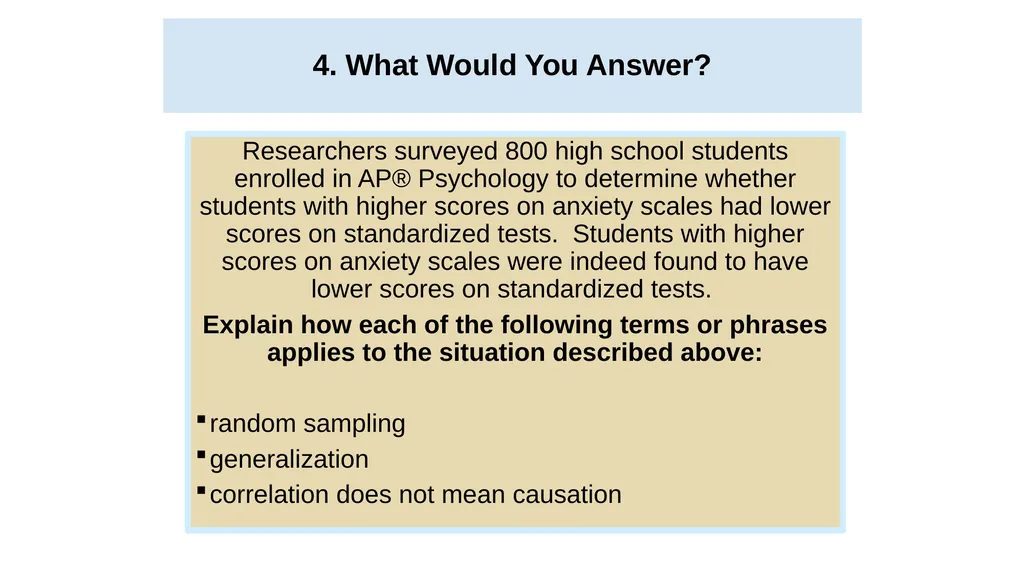
4. What Would You Answer? 4. What Would You Answer? Researchers surveyed 800 high school students enrolled in AP® Psychology to determine whether students with higher scores on anxiety scales had lower scores on standardized tests. Students with higher scores on anxiety scales were indeed found to have lower scores on standardized tests.
Explain how each of the following terms or phrases applies to the situation described above:
random sampling
generalization
correlation does not mean causation<br>
Explain how each of the following terms or phrases applies to the situation described above:
random sampling
generalization
correlation does not mean causation<br>
104
Learning Target 6-1 Review Explain what it means when we say
two things are correlated, and
describe positive and negative correlations. Correlation is the degree to which two variables are related, and how well one predicts the other.
In a positive correlation, two factors increase or decrease together. In a negative correlation, one variable increases as the other decreases.<br>
two things are correlated, and
describe positive and negative correlations. Correlation is the degree to which two variables are related, and how well one predicts the other.
In a positive correlation, two factors increase or decrease together. In a negative correlation, one variable increases as the other decreases.<br>
105
Learning Target 6-1 Review cont. Explain what it means when we say
two things are correlated, and
describe positive and negative correlations. A correlation coefficient is a statistical measure that describes the strength and direction of a relationship between two variables, from +1.0 through zero to -1.0
The relationship may be displayed in a scatterplot, in which each dot represents a value for the two variables.<br>
two things are correlated, and
describe positive and negative correlations. A correlation coefficient is a statistical measure that describes the strength and direction of a relationship between two variables, from +1.0 through zero to -1.0
The relationship may be displayed in a scatterplot, in which each dot represents a value for the two variables.<br>
106
Learning Target 6-2 Review Explain illusory correlations and
regression toward the mean Illusory correlations are random events that we notice and falsely assume are related.
Regression toward the mean is the tendency for extreme or unusual scores to fall back toward their average.<br>
regression toward the mean Illusory correlations are random events that we notice and falsely assume are related.
Regression toward the mean is the tendency for extreme or unusual scores to fall back toward their average.<br>
107
Learning Target 6-3 Review Discuss why correlations enable prediction
but not cause-effect explanation Correlations allow prediction because they show that two variables are related.
Correlation can indicate the possibility of a cause-effect relationship, but it does not prove the direction of the influence, or whether an underlying third factor may explain the correlation.<br>
but not cause-effect explanation Correlations allow prediction because they show that two variables are related.
Correlation can indicate the possibility of a cause-effect relationship, but it does not prove the direction of the influence, or whether an underlying third factor may explain the correlation.<br>
108
Learning Target 6-4 Review Describe the characteristics of experimentation
that make it possible to isolate
cause and effect. To discover cause-effect relationships, psychologists conduct experiments, manipulating one or more variables of interest and controlling other variables.
Using random assignment, they can minimize confounding variables, such as preexisting differences between the experimental group and the control group.<br>
that make it possible to isolate
cause and effect. To discover cause-effect relationships, psychologists conduct experiments, manipulating one or more variables of interest and controlling other variables.
Using random assignment, they can minimize confounding variables, such as preexisting differences between the experimental group and the control group.<br>
109
Learning Target 6-4 Review cont. Describe the characteristics of experimentation
that make it possible to isolate
cause and effect. The independent variable is the factor manipulated to study its effect;
the dependent variable is measured to discover any changes occurring in response to the manipulation of the independent variable.
a double-blind procedure is used to avoid the placebo effect and researcher or subject bias.
An experiment has validity if it measures what it is supposed to measure.<br>
that make it possible to isolate
cause and effect. The independent variable is the factor manipulated to study its effect;
the dependent variable is measured to discover any changes occurring in response to the manipulation of the independent variable.
a double-blind procedure is used to avoid the placebo effect and researcher or subject bias.
An experiment has validity if it measures what it is supposed to measure.<br>
110
Module 7
Research Design and Ethics in Psychology Module 7
Research Design and Ethics in Psychology Learning Targets 7-1 Explain the process of determining which research design to use. 7-2 Explain the value of simplified laboratory conditions in illuminating everyday life. 7-3 Explain why psychologists study animals, and describe the ethical guidelines that safeguard animal research subjects. 7-4 Describe the ethical guidelines that safeguard human research participants. 7-5 Describe how values affect psychological science.<br>
Research Design and Ethics in Psychology Learning Targets 7-1 Explain the process of determining which research design to use. 7-2 Explain the value of simplified laboratory conditions in illuminating everyday life. 7-3 Explain why psychologists study animals, and describe the ethical guidelines that safeguard animal research subjects. 7-4 Describe the ethical guidelines that safeguard human research participants. 7-5 Describe how values affect psychological science.<br>
111
How do psychologists decide
which research design to use? Create a testable hypothesis. Does free will exist?
(not testable) Do free will beliefs influence how people act?
(testable)<br>
(not testable) Do free will beliefs influence how people act?
(testable)<br>
112
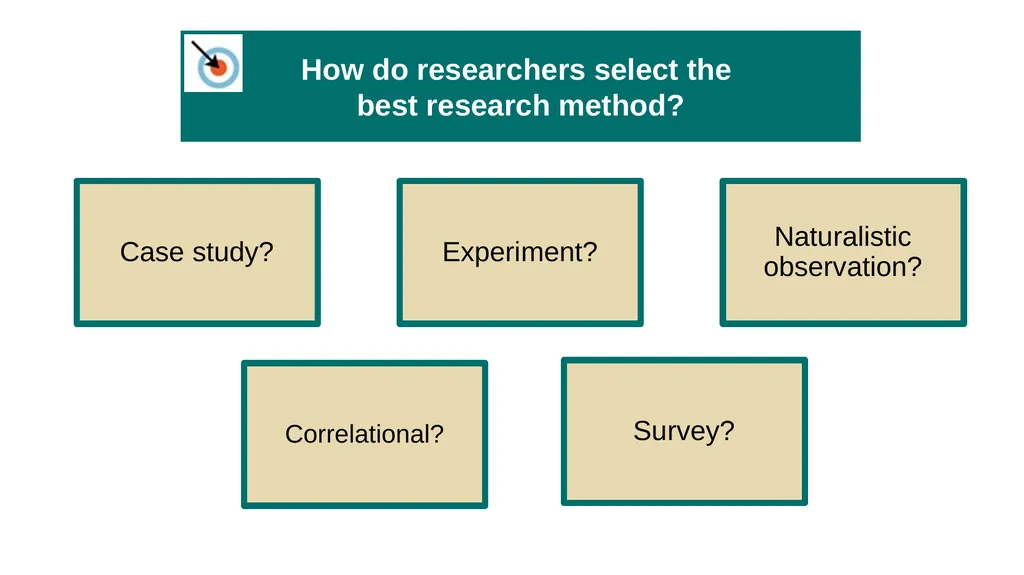
How do researchers select the
best research method? Case study? Experiment? Naturalistic observation? Correlational? Survey?<br>
113
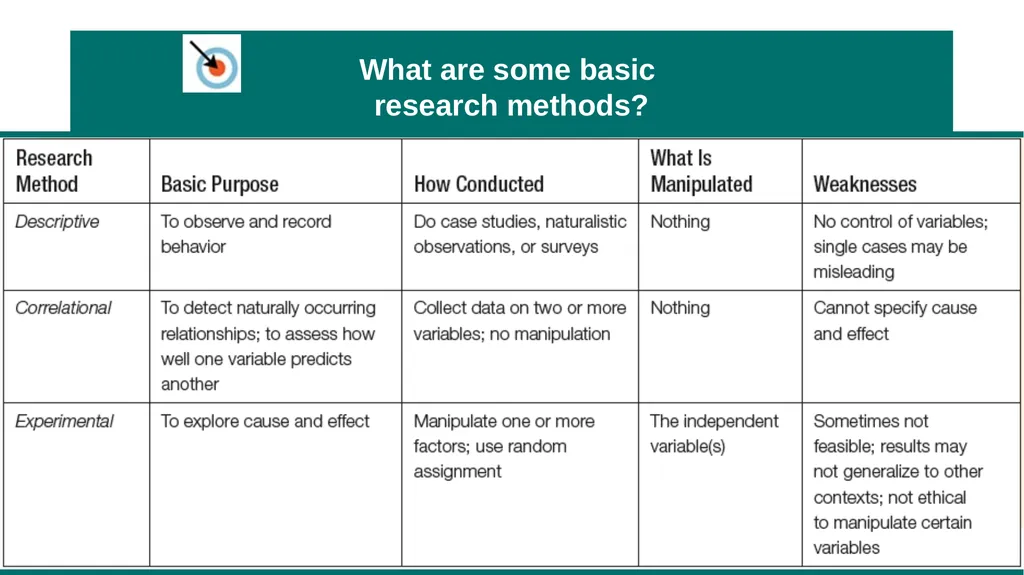
What are some basic
research methods?<br>
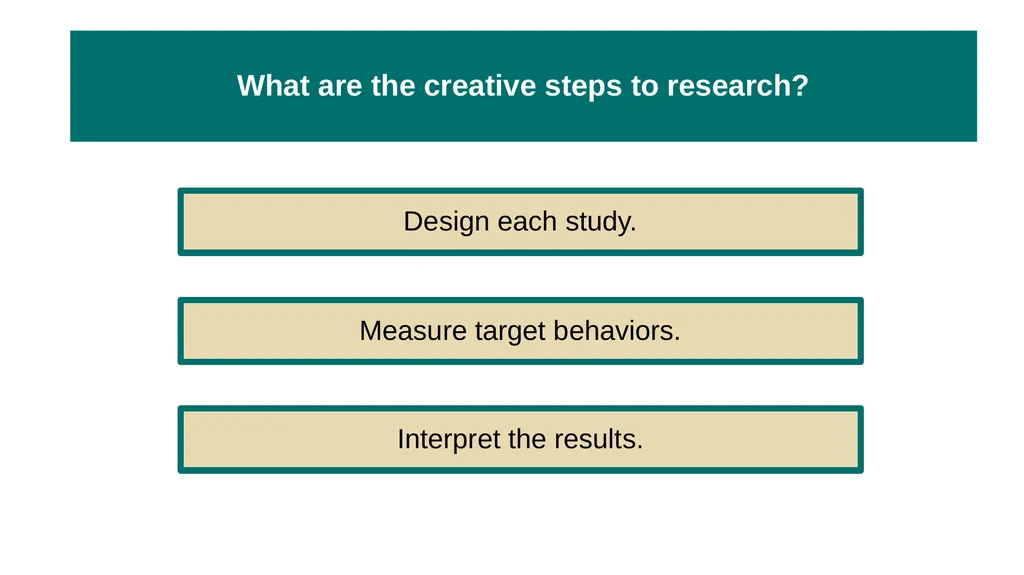
114
What are the creative steps to research? Design each study. Measure target behaviors. Interpret the results.<br>
115
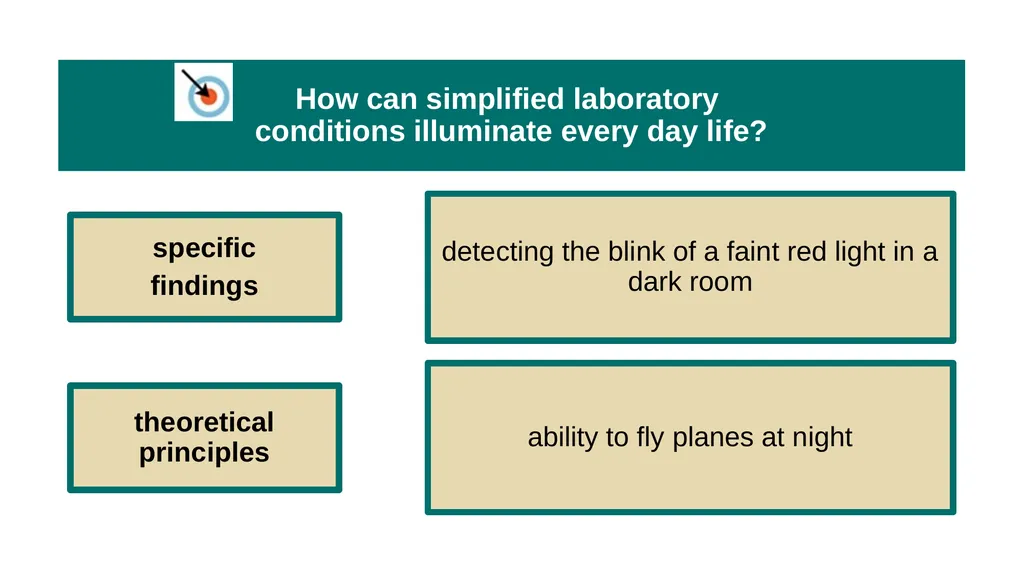
How can simplified laboratory
conditions illuminate every day life? specific
findings detecting the blink of a faint red light in a dark room theoretical principles ability to fly planes at night<br>
findings detecting the blink of a faint red light in a dark room theoretical principles ability to fly planes at night<br>
116
1. What Would You Answer? 1. What Would You Answer? The laboratory environment is designed to
exactly re-create the events of everyday life
re-create psychological forces under controlled conditions.
re-create psychological forces under random conditions.
minimize the use of animals and humans in psychological research.
provide the opportunity to do case study research.<br>
exactly re-create the events of everyday life
re-create psychological forces under controlled conditions.
re-create psychological forces under random conditions.
minimize the use of animals and humans in psychological research.
provide the opportunity to do case study research.<br>
117
Why do psychologists study animals? Animals are fascinating to study. Animals teach us about humans. Animals often have simpler systems.<br>
118
What ethical guidelines safeguard
animal research subjects? Housing animals under reasonably natural living conditions, with companions for social animals.
~British Psychological Society Researchers must provide “humane care and healthful conditions” and that testing should “minimize discomfort”.
~American Psychological Society Most universities screen research proposals, often through an animal care ethics committee, and laboratories are
regulated and inspected.<br>
~British Psychological Society Researchers must provide “humane care and healthful conditions” and that testing should “minimize discomfort”.
~American Psychological Society Most universities screen research proposals, often through an animal care ethics committee, and laboratories are
regulated and inspected.<br>
119
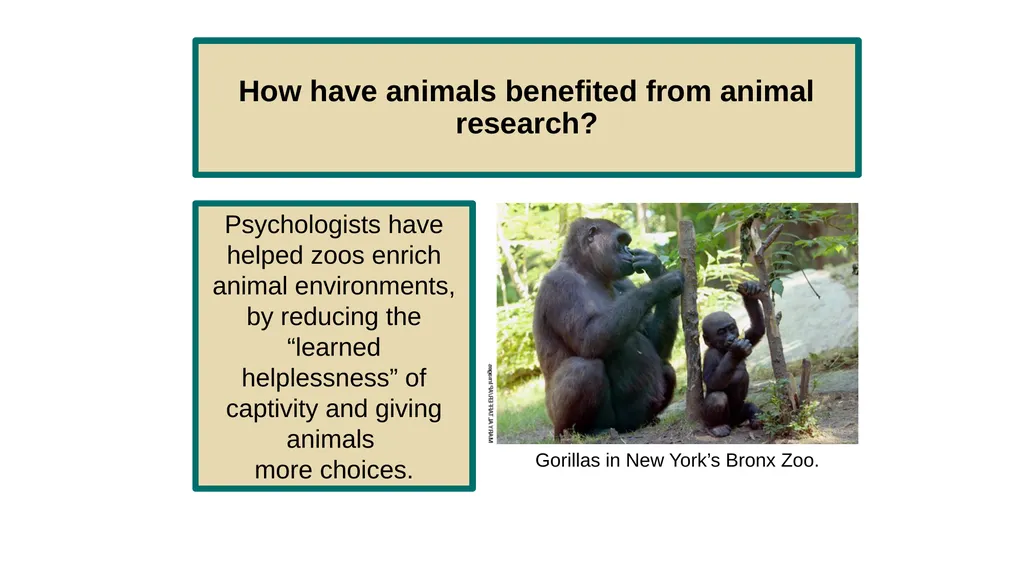
How have animals benefited from animal research? Psychologists have helped zoos enrich animal environments,
by reducing the “learned
helplessness” of captivity and giving
animals
more choices. Gorillas in New York’s Bronx Zoo.<br>
by reducing the “learned
helplessness” of captivity and giving
animals
more choices. Gorillas in New York’s Bronx Zoo.<br>
120
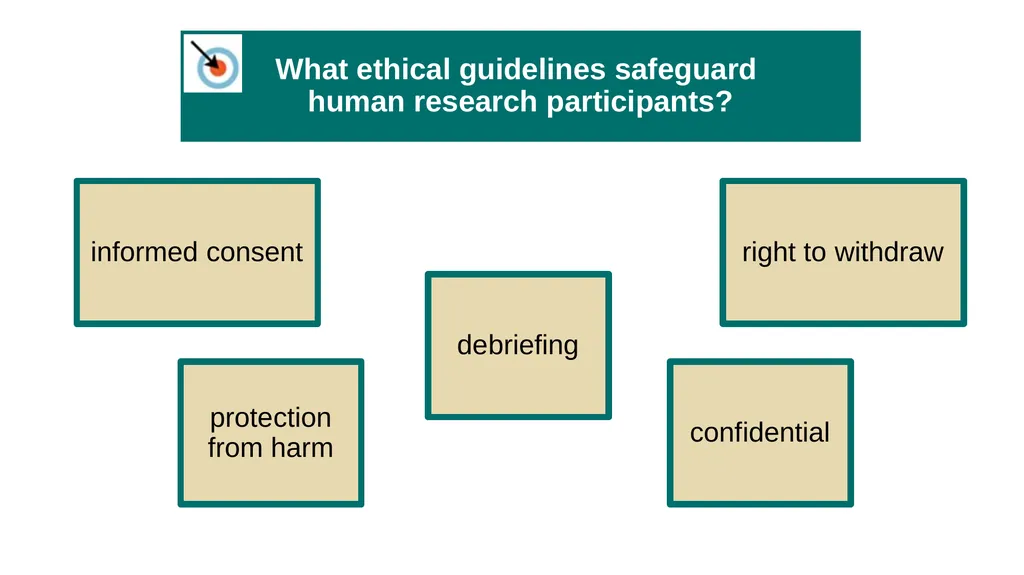
What ethical guidelines safeguard
human research participants? informed consent protection from harm debriefing right to withdraw confidential<br>
121
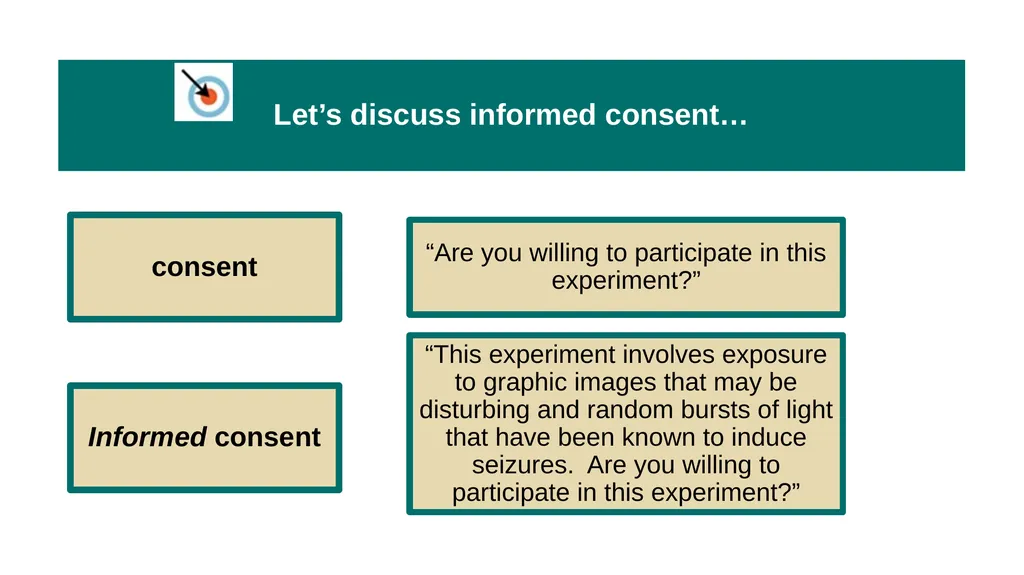
Let’s discuss informed consent… consent “Are you willing to participate in this experiment?” Informed consent “This experiment involves exposure to graphic images that may be disturbing and random bursts of light that have been known to induce seizures. Are you willing to participate in this experiment?”<br>
122
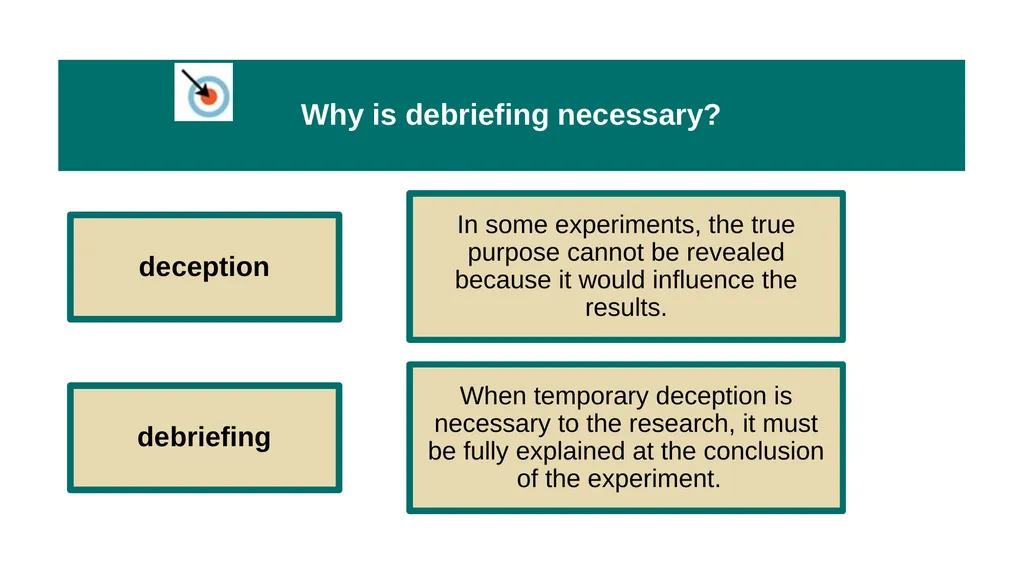
Why is debriefing necessary? deception In some experiments, the true purpose cannot be revealed because it would influence the results. debriefing When temporary deception is necessary to the research, it must be fully explained at the conclusion of the experiment.<br>
123
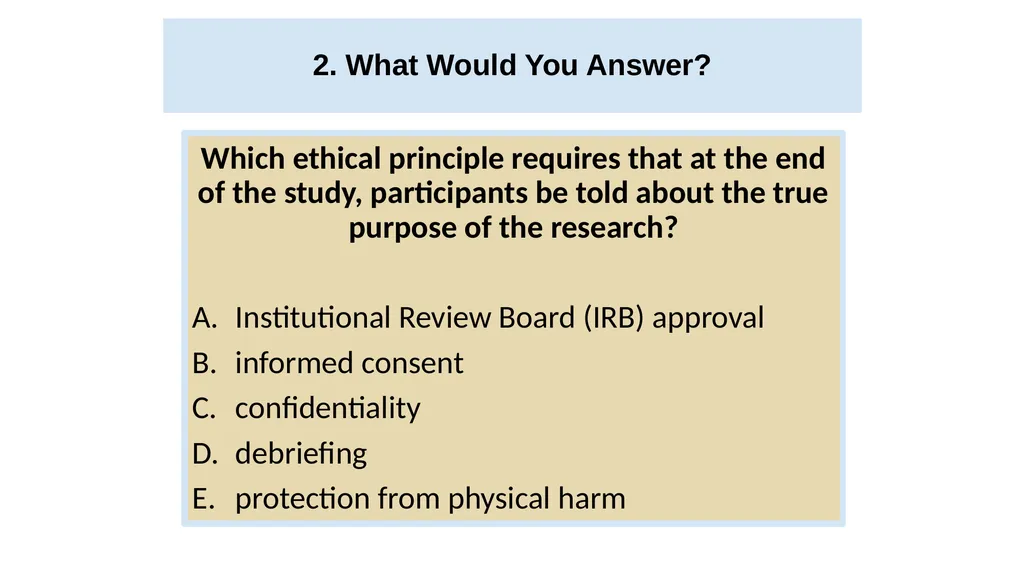
2. What Would You Answer? 2. What Would You Answer? Which ethical principle requires that at the end of the study, participants be told about the true purpose of the research?
Institutional Review Board (IRB) approval
informed consent
confidentiality
debriefing
protection from physical harm<br>
Institutional Review Board (IRB) approval
informed consent
confidentiality
debriefing
protection from physical harm<br>
124
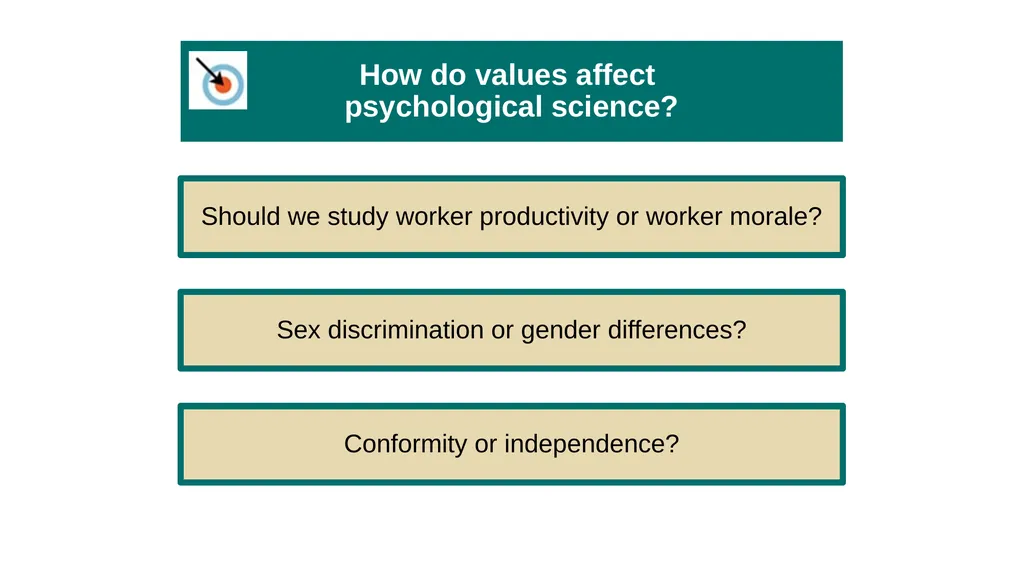
How do values affect
psychological science? Should we study worker productivity or worker morale? Sex discrimination or gender differences? Conformity or independence?<br>
125
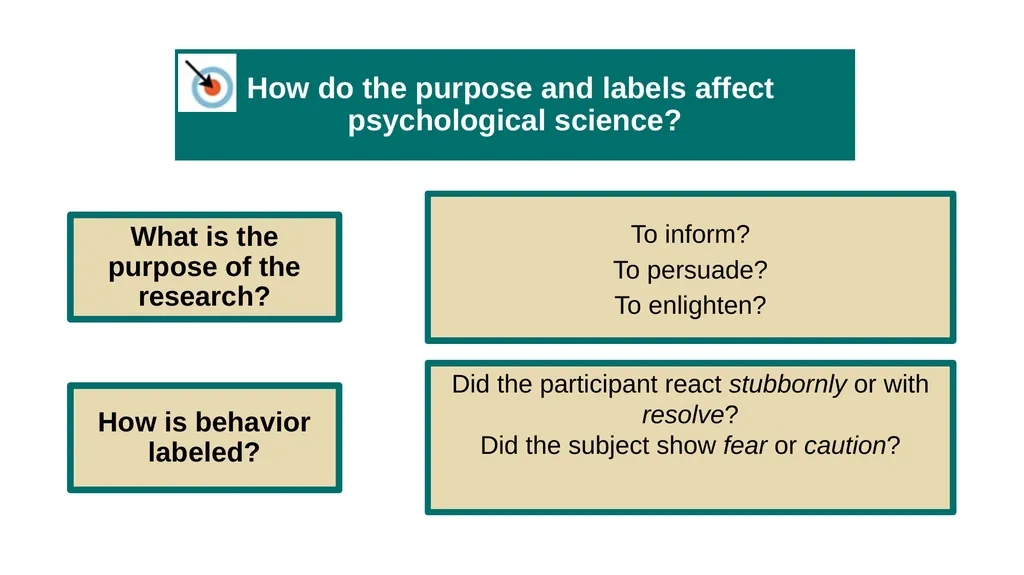
How do the purpose and labels affect
psychological science? What is the purpose of the research? To inform?
To persuade?
To enlighten? How is behavior labeled? Did the participant react stubbornly or with resolve?
Did the subject show fear or caution?<br>
To persuade?
To enlighten? How is behavior labeled? Did the participant react stubbornly or with resolve?
Did the subject show fear or caution?<br>
126
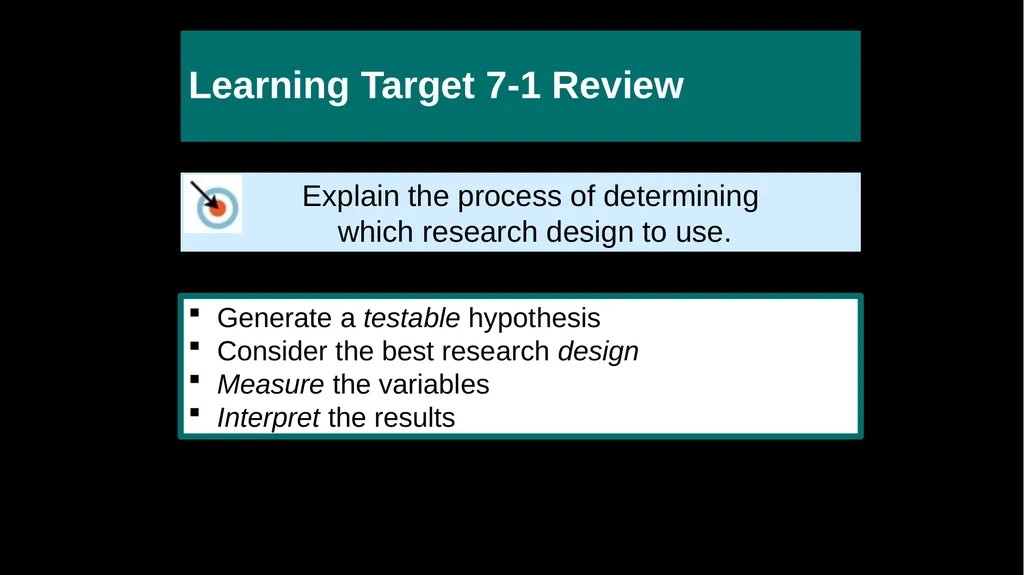
Learning Target 7-1 Review Explain the process of determining
which research design to use. Generate a testable hypothesis
Consider the best research design
Measure the variables
Interpret the results<br>
which research design to use. Generate a testable hypothesis
Consider the best research design
Measure the variables
Interpret the results<br>
127
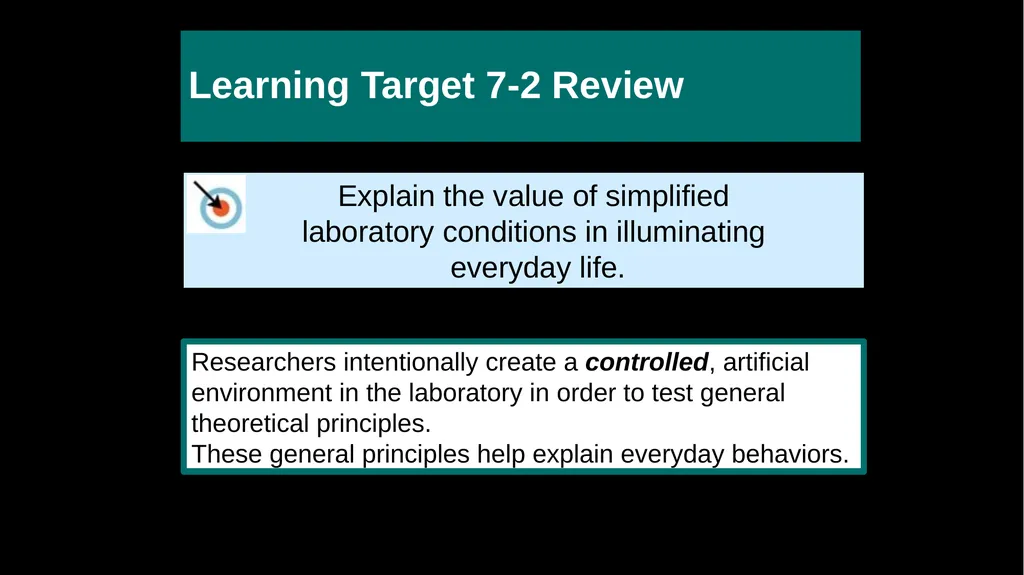
Learning Target 7-2 Review Explain the value of simplified
laboratory conditions in illuminating
everyday life. Researchers intentionally create a controlled, artificial environment in the laboratory in order to test general theoretical principles.
These general principles help explain everyday behaviors.<br>
laboratory conditions in illuminating
everyday life. Researchers intentionally create a controlled, artificial environment in the laboratory in order to test general theoretical principles.
These general principles help explain everyday behaviors.<br>
128
Learning Target 7-3 Review Explain why psychologists study
animals, and describe the ethical guidelines that safeguard animal research subjects. Interest in animal behavior
Want to understand the processes shared by humans
Government agencies have standards of care
Professional associations have guidelines for protecting animal’s well-being.<br>
animals, and describe the ethical guidelines that safeguard animal research subjects. Interest in animal behavior
Want to understand the processes shared by humans
Government agencies have standards of care
Professional associations have guidelines for protecting animal’s well-being.<br>
129
Learning Target 7-4 Review Describe the ethical guidelines that
safeguard human research participants. The APA ethics code outlines standards for safeguarding
human participants’ well-being, including obtaining their
informed consent and debriefing them later.<br>
safeguard human research participants. The APA ethics code outlines standards for safeguarding
human participants’ well-being, including obtaining their
informed consent and debriefing them later.<br>
130
Learning Target 7-5 Review Describe how values affect psychological science. Psychologists’ values influence their choice of research
topics, their theories and observations, their labels for behavior, and their professional advice.
Applications of psychology’s principles have been used
mainly in the service of humanity.<br>
topics, their theories and observations, their labels for behavior, and their professional advice.
Applications of psychology’s principles have been used
mainly in the service of humanity.<br>
131
Module 8
Statistical Reasoning in Everyday Life Module 8
Statistical Reasoning in Everyday Life Learning Targets 8-1 Explain why we need statistics in psychology and in everyday life. 8-2 Describe descriptive statistics. 8-3 Explain how we describe data using the three measures of central tendency. 8-4 Discuss the relative usefulness of the two measures of variation. 8-5 Describe inferential statistics. 8-6 Explain how we determine whether an observed difference can be generalized to other populations.<br>
Statistical Reasoning in Everyday Life Learning Targets 8-1 Explain why we need statistics in psychology and in everyday life. 8-2 Describe descriptive statistics. 8-3 Explain how we describe data using the three measures of central tendency. 8-4 Discuss the relative usefulness of the two measures of variation. 8-5 Describe inferential statistics. 8-6 Explain how we determine whether an observed difference can be generalized to other populations.<br>
132
Why do we need statistics? They are the tools that allow researchers to
measure variables and interpret results But.. statistics can mislead or be used to
misrepresent findings.
We need to develop
STATISTICAL LITERACY.<br>
measure variables and interpret results But.. statistics can mislead or be used to
misrepresent findings.
We need to develop
STATISTICAL LITERACY.<br>
133
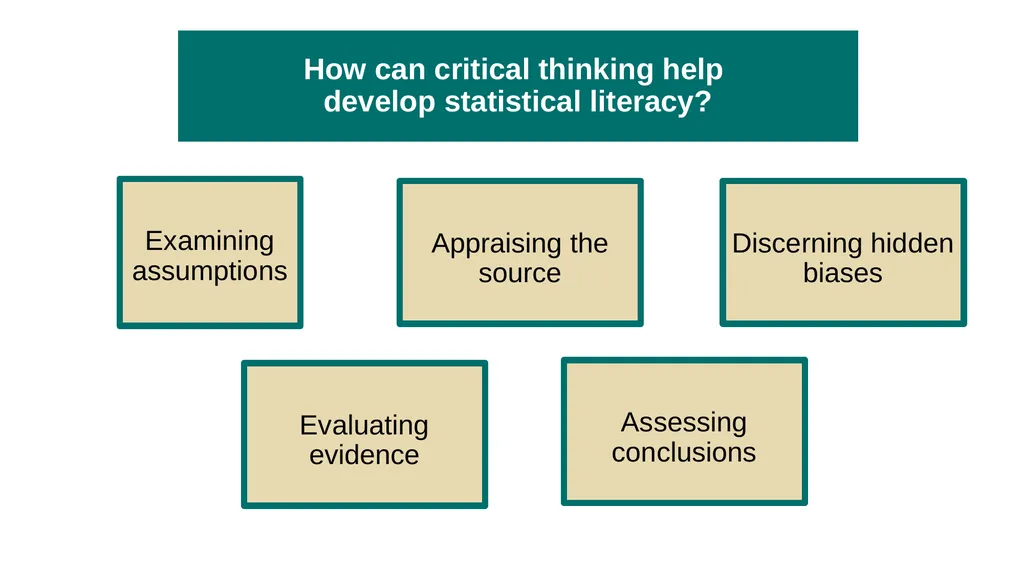
How can critical thinking help
develop statistical literacy? Examining assumptions Appraising the source Discerning hidden biases Evaluating evidence Assessing conclusions<br>
134
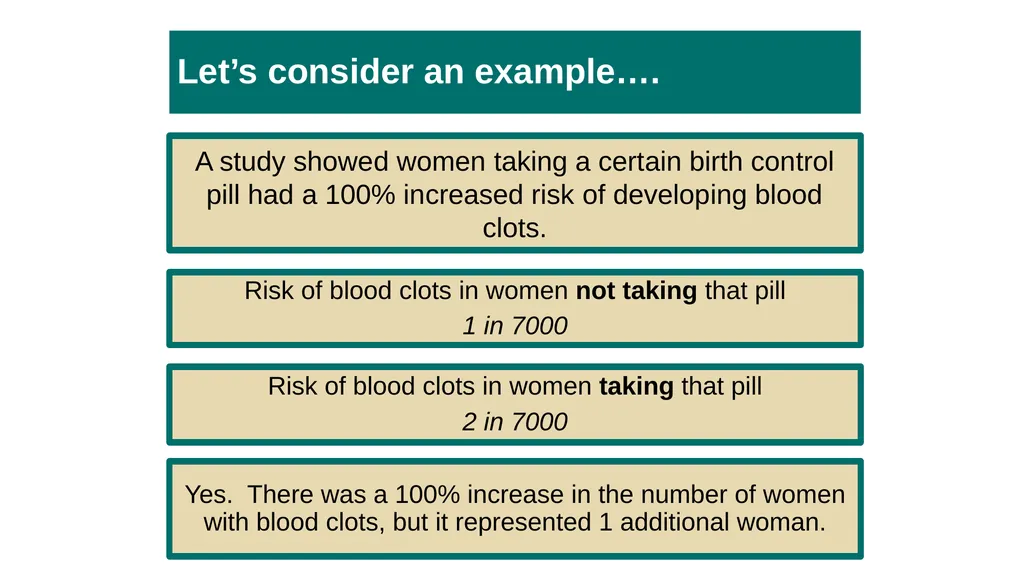
Let’s consider an example…. A study showed women taking a certain birth control pill had a 100% increased risk of developing blood clots. Risk of blood clots in women not taking that pill
1 in 7000 Risk of blood clots in women taking that pill
2 in 7000 Yes. There was a 100% increase in the number of women with blood clots, but it represented 1 additional woman.<br>
1 in 7000 Risk of blood clots in women taking that pill
2 in 7000 Yes. There was a 100% increase in the number of women with blood clots, but it represented 1 additional woman.<br>
135
What is descriptive statistics? Numerical data used to measure
and describe characteristics of groups.
Includes measures of
central tendency
(the mean, median and mode)
and measures of variation
(range and standard deviation).<br>
and describe characteristics of groups.
Includes measures of
central tendency
(the mean, median and mode)
and measures of variation
(range and standard deviation).<br>
136
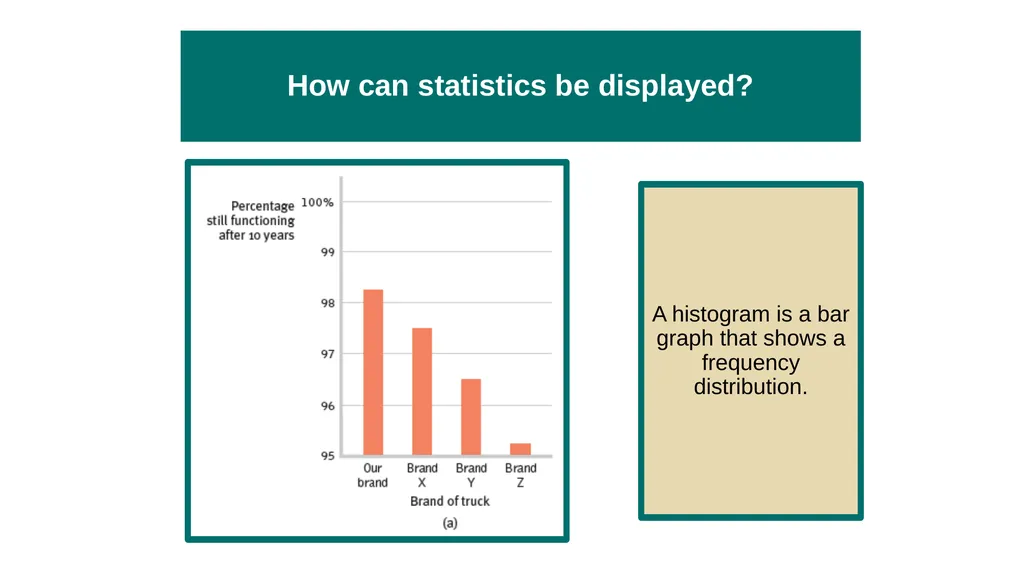
How can statistics be displayed? A histogram is a bar graph that shows a frequency distribution.<br>
137
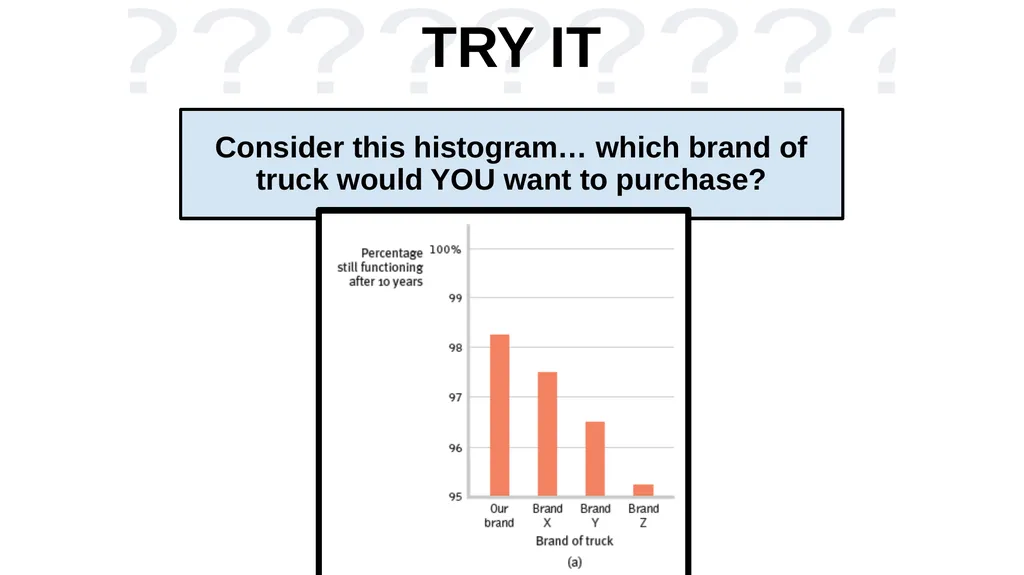
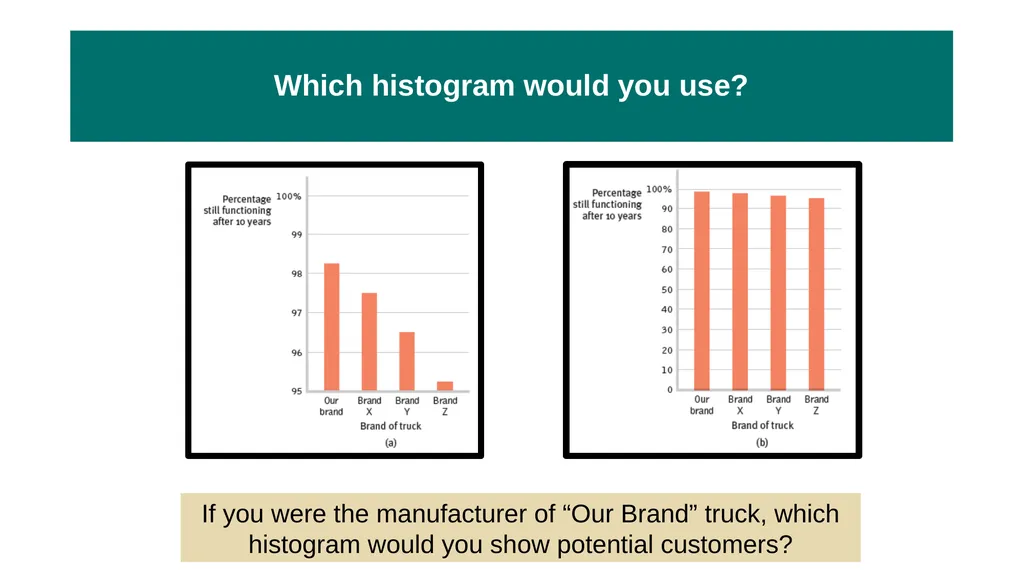
TRY IT Consider this histogram… which brand of truck would YOU want to purchase?<br>
138
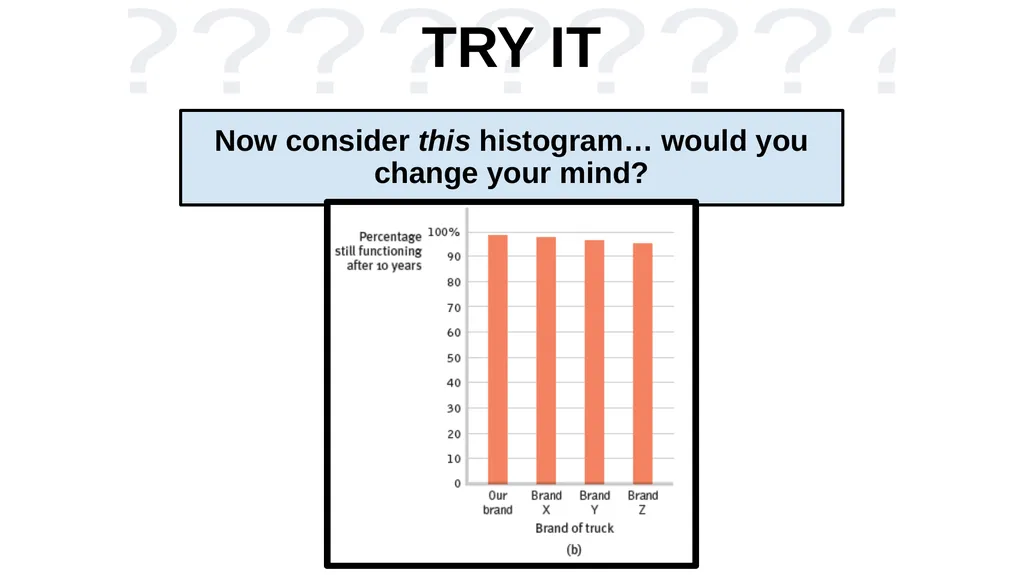
TRY IT Now consider this histogram… would you change your mind?<br>
139
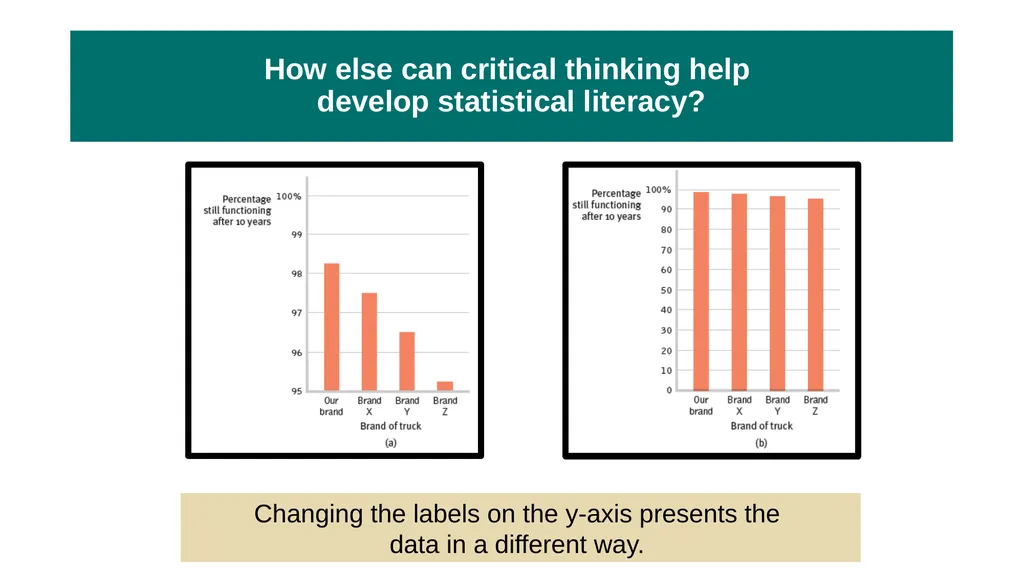
How else can critical thinking help
develop statistical literacy? Changing the labels on the y-axis presents the
data in a different way.<br>
data in a different way.<br>
140
Which histogram would you use? If you were the manufacturer of “Our Brand” truck, which histogram would you show potential customers?<br>
141
How do we describe data using the
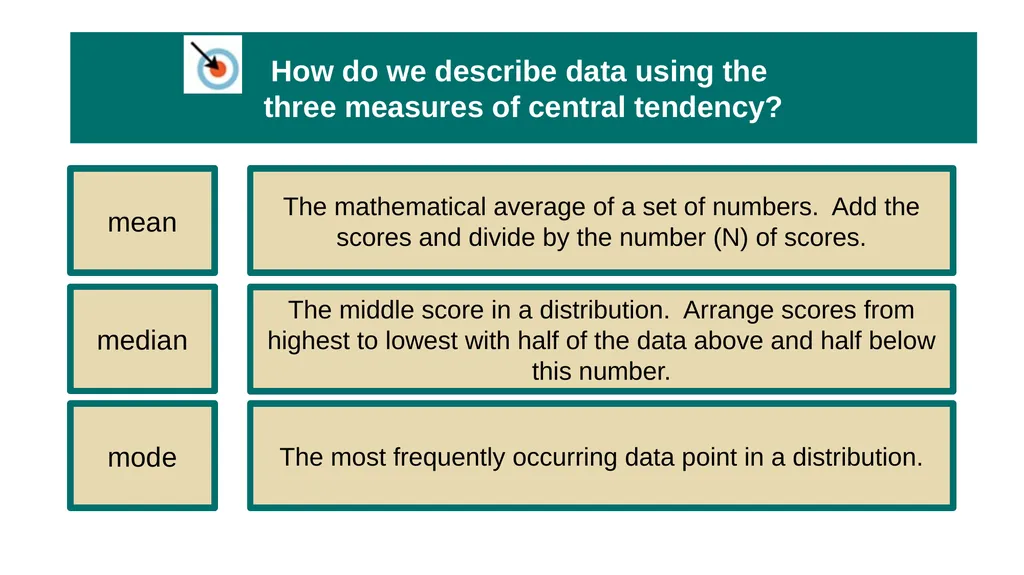
three measures of central tendency? mean The mathematical average of a set of numbers. Add the scores and divide by the number (N) of scores. median The middle score in a distribution. Arrange scores from highest to lowest with half of the data above and half below this number. mode The most frequently occurring data point in a distribution.<br>
142
TRY IT Data set:
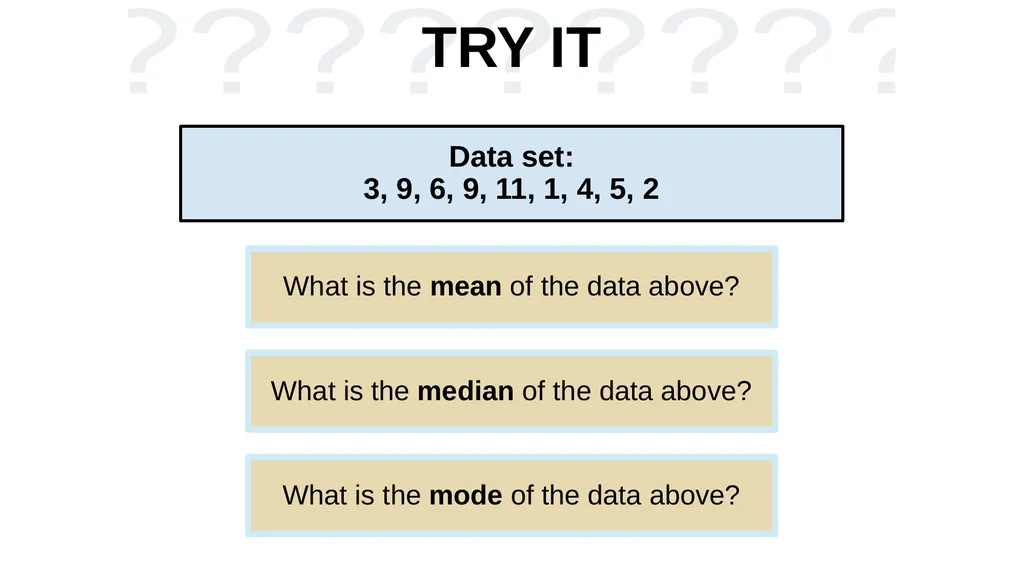
3, 9, 6, 9, 11, 1, 4, 5, 2 What is the mean of the data above? What is the median of the data above? What is the mode of the data above?<br>
143
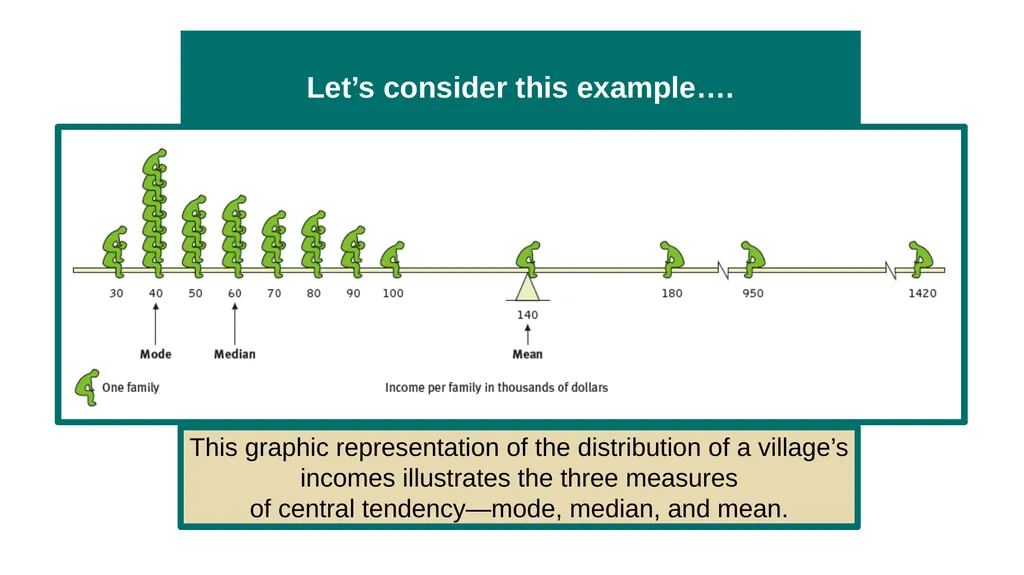
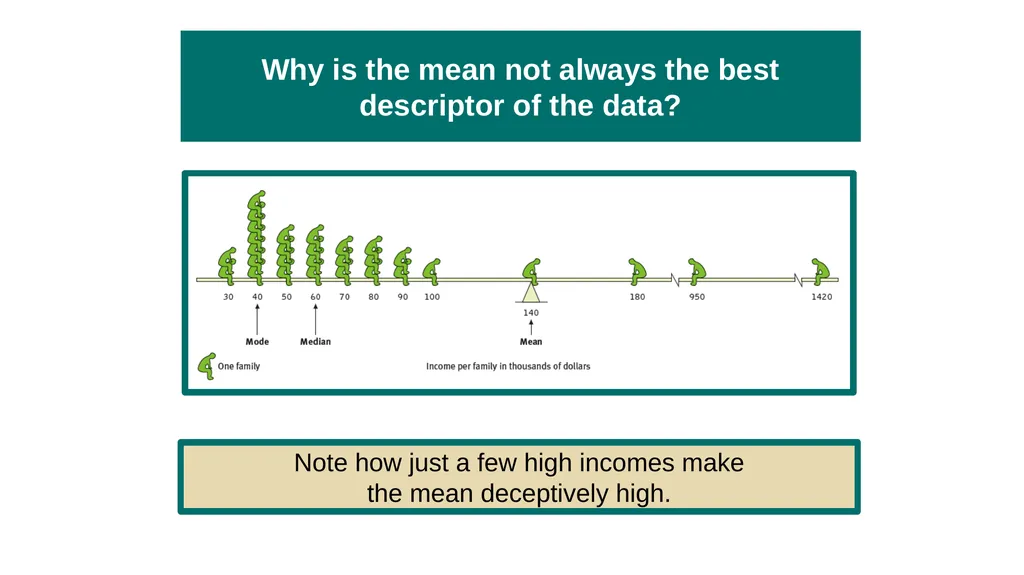
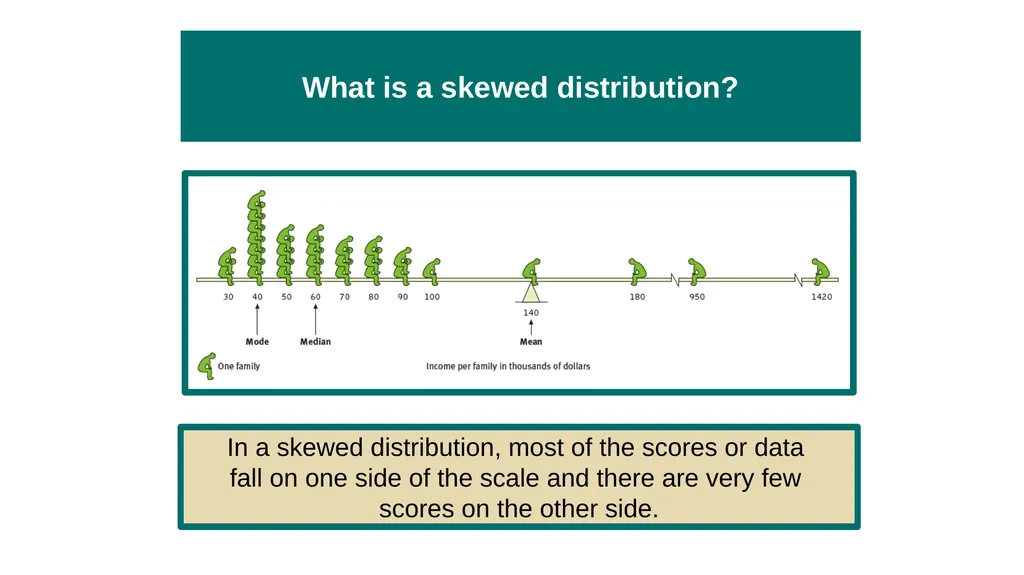
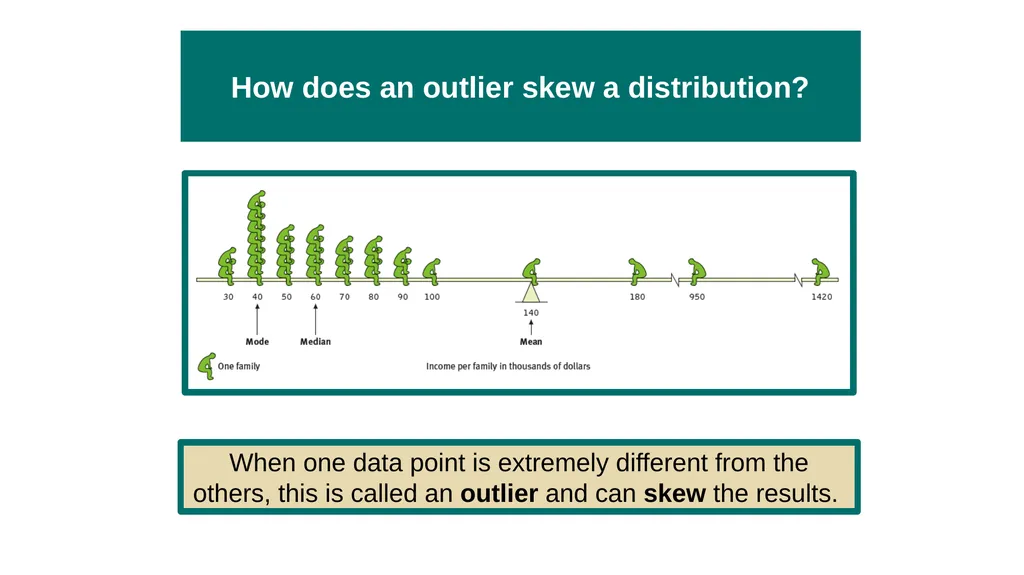
Let’s consider this example…. This graphic representation of the distribution of a village’s incomes illustrates the three measures
of central tendency—mode, median, and mean.<br>
of central tendency—mode, median, and mean.<br>
144
Why is the mean not always the best descriptor of the data? Note how just a few high incomes make
the mean deceptively high.<br>
the mean deceptively high.<br>
145
What is a skewed distribution? In a skewed distribution, most of the scores or data
fall on one side of the scale and there are very few
scores on the other side.<br>
fall on one side of the scale and there are very few
scores on the other side.<br>
146
How does an outlier skew a distribution? When one data point is extremely different from the others, this is called an outlier and can skew the results.<br>
147
AP ® Exam Tip You will likely have a question asking
about the influence of outliers on data
and which measure of central tendency
is best used to describe the data. The median will be a better descriptor of data when the mean is impacted by outliers.<br>
about the influence of outliers on data
and which measure of central tendency
is best used to describe the data. The median will be a better descriptor of data when the mean is impacted by outliers.<br>
148
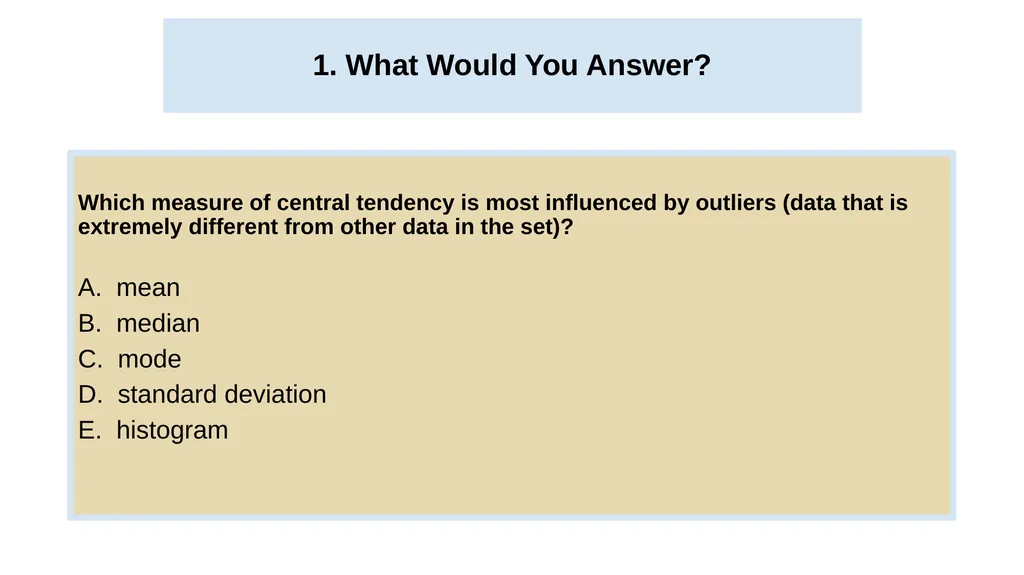
1. What Would You Answer? 1. What Would You Answer? Which measure of central tendency is most influenced by outliers (data that is extremely different from other data in the set)?
mean
B. median
C. mode
D. standard deviation
histogram<br>
mean
B. median
C. mode
D. standard deviation
histogram<br>
149
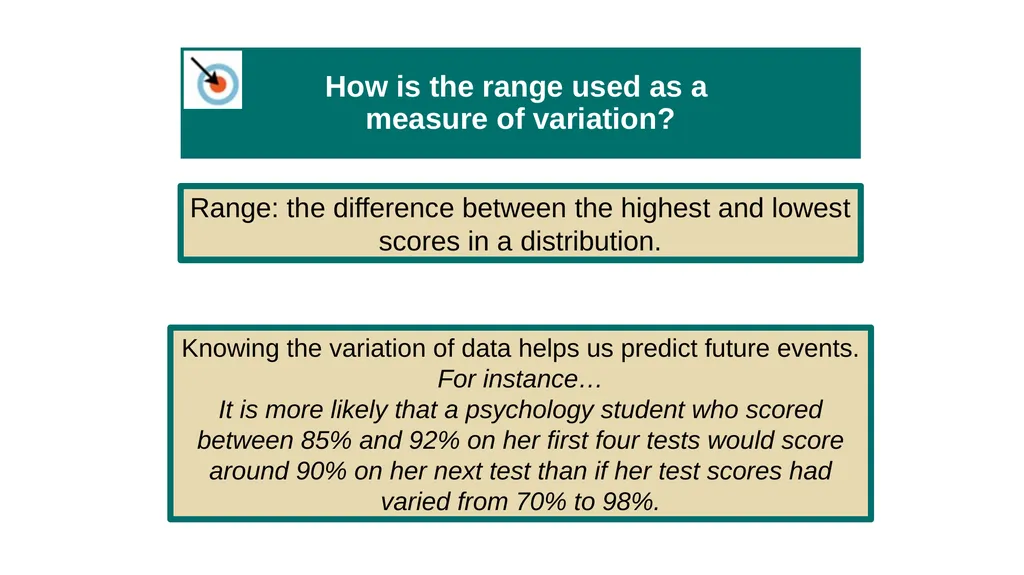
How is the range used as a
measure of variation? Range: the difference between the highest and lowest scores in a distribution. Knowing the variation of data helps us predict future events.
For instance…
It is more likely that a psychology student who scored between 85% and 92% on her first four tests would score around 90% on her next test than if her test scores had varied from 70% to 98%.<br>
For instance…
It is more likely that a psychology student who scored between 85% and 92% on her first four tests would score around 90% on her next test than if her test scores had varied from 70% to 98%.<br>
150
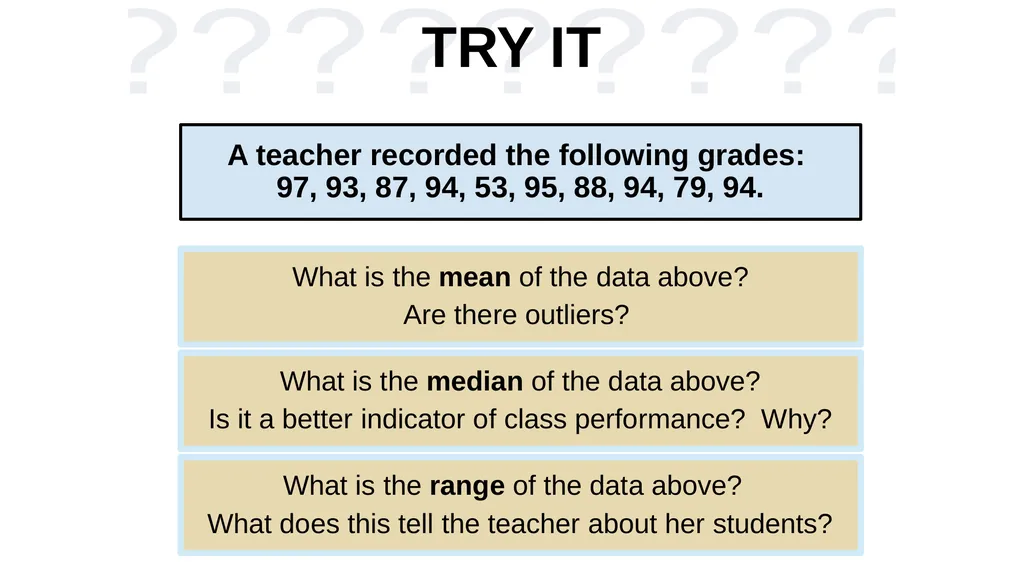
TRY IT A teacher recorded the following grades:
97, 93, 87, 94, 53, 95, 88, 94, 79, 94. What is the mean of the data above?
Are there outliers? What is the median of the data above?
Is it a better indicator of class performance? Why? What is the range of the data above?
What does this tell the teacher about her students?<br>
Are there outliers? What is the median of the data above?
Is it a better indicator of class performance? Why? What is the range of the data above?
What does this tell the teacher about her students?<br>
151
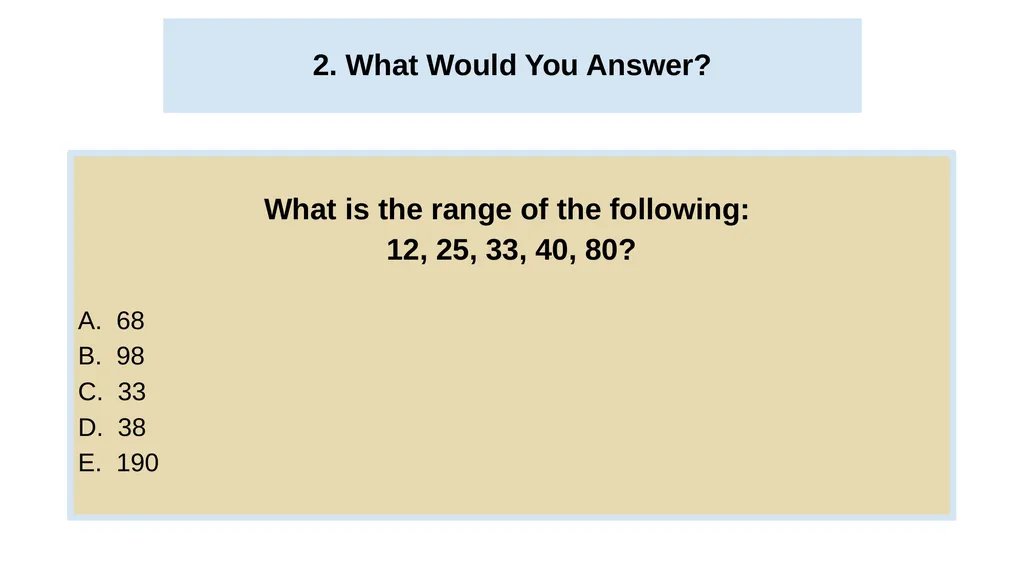
2. What Would You Answer? 2. What Would You Answer? What is the range of the following:
12, 25, 33, 40, 80?
68
B. 98
C. 33
D. 38
E. 190<br>
12, 25, 33, 40, 80?
68
B. 98
C. 33
D. 38
E. 190<br>
152
How is the standard deviation used
as a measure of variation? Standard Deviation: a computed measure of how much scores vary around the mean score. The standard deviation shows whether scores are
packed together (similar) or dispersed (varied). Who likes math? To calculate the standard deviation:
Calculate the mean
For each data point: subtract the mean and square the result.
Calculate the mean of all the squared differences.
Take the square root of the sum.<br>
packed together (similar) or dispersed (varied). Who likes math? To calculate the standard deviation:
Calculate the mean
For each data point: subtract the mean and square the result.
Calculate the mean of all the squared differences.
Take the square root of the sum.<br>
153
TRY IT Which of the following standard deviations depict a data set that is more similar than different? 1.45 2.78 4.98<br>
154
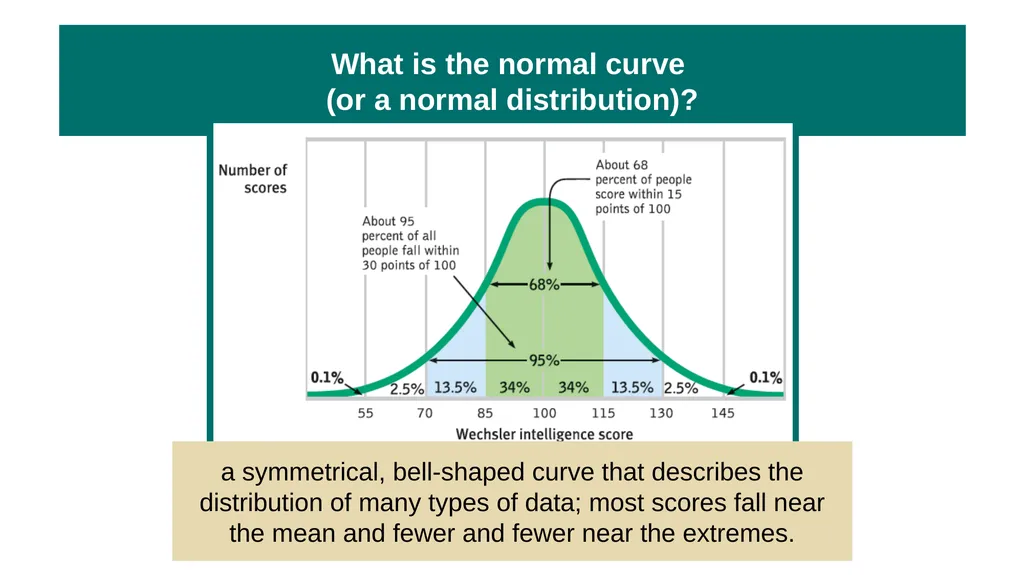
What is the normal curve
(or a normal distribution)? a symmetrical, bell-shaped curve that describes the distribution of many types of data; most scores fall near the mean and fewer and fewer near the extremes.<br>
155
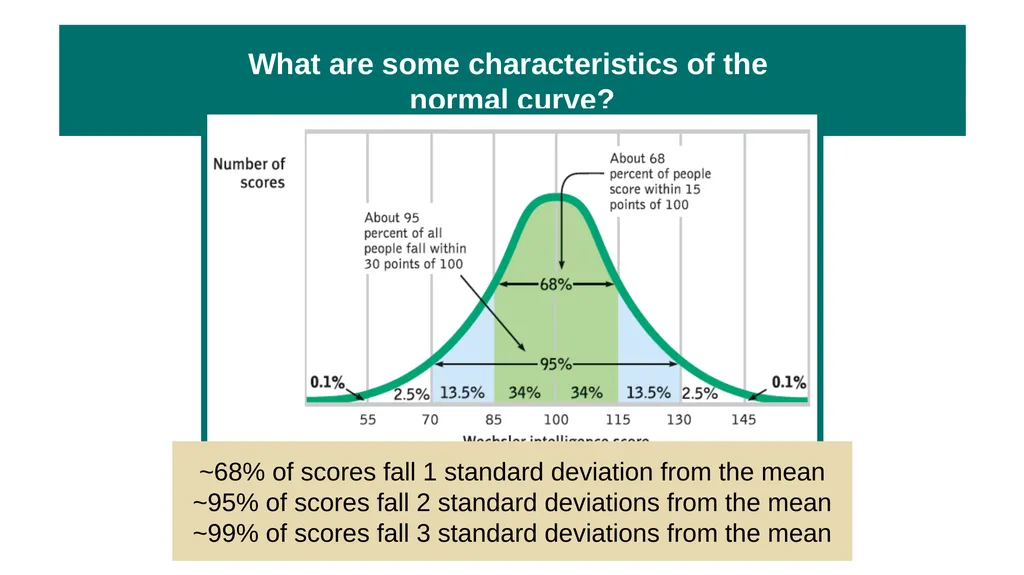
What are some characteristics of the
normal curve? ~68% of scores fall 1 standard deviation from the mean
~95% of scores fall 2 standard deviations from the mean
~99% of scores fall 3 standard deviations from the mean<br>
~95% of scores fall 2 standard deviations from the mean
~99% of scores fall 3 standard deviations from the mean<br>
156
TRY IT Refer to the normal curve below. What is the range of possible IQ scores for a student whose IQ falls within one standard
deviation from the mean?<br>
157
What are inferential statistics? Numerical data that allow one to generalize—
to infer from sample data the
probability of something being
true of a population.<br>
to infer from sample data the
probability of something being
true of a population.<br>
158
What is the difference between
descriptive and inferential statistics? descriptive statistics describe a population or data set
use measures of central tendency
use measures of variation inferential statistics examine relationships between variables in sample
allow us to infer/predict trends based on data taken from a sample of a population<br>
use measures of central tendency
use measures of variation inferential statistics examine relationships between variables in sample
allow us to infer/predict trends based on data taken from a sample of a population<br>
159
When can results be generalized
to the population at large? When the sample is representative of the population being studied When the variability of the data is low. When more cases exist with those results.<br>
160
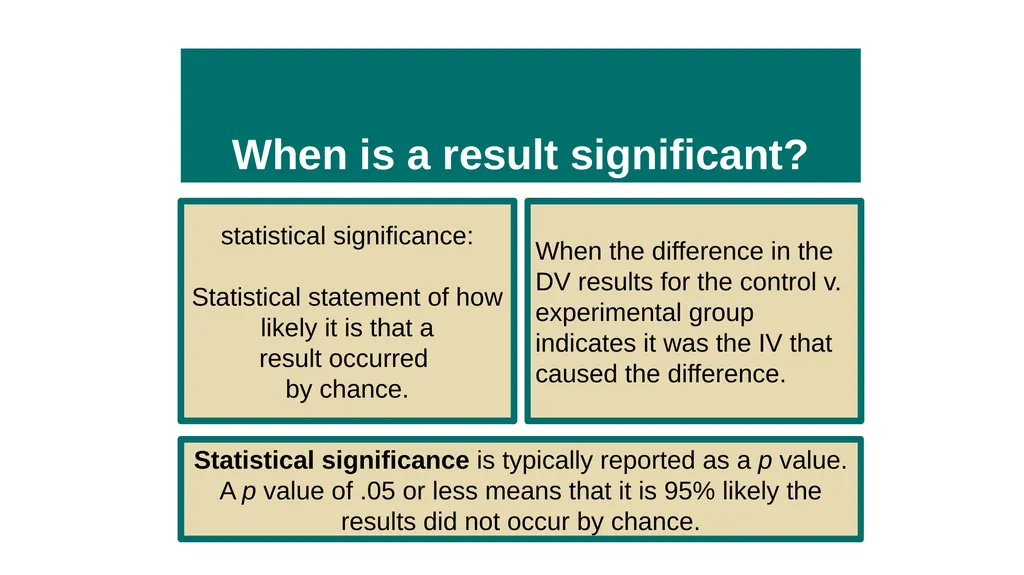
When is a result significant? statistical significance:
Statistical statement of how
likely it is that a
result occurred
by chance. When the difference in the DV results for the control v. experimental group indicates it was the IV that caused the difference. Statistical significance is typically reported as a p value.
A p value of .05 or less means that it is 95% likely the results did not occur by chance.<br>
Statistical statement of how
likely it is that a
result occurred
by chance. When the difference in the DV results for the control v. experimental group indicates it was the IV that caused the difference. Statistical significance is typically reported as a p value.
A p value of .05 or less means that it is 95% likely the results did not occur by chance.<br>
161
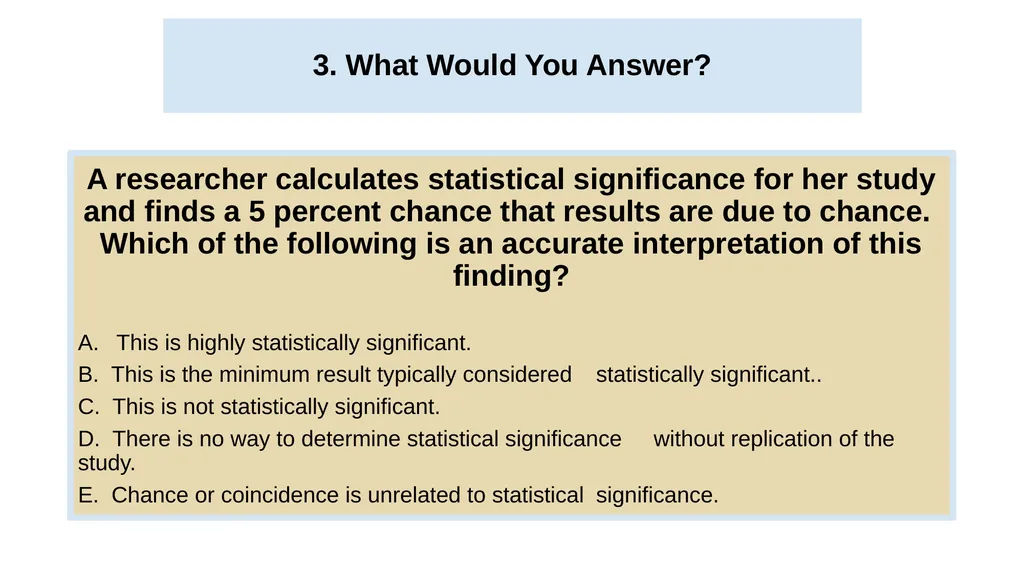
3. What Would You Answer? 3. What Would You Answer? A researcher calculates statistical significance for her study and finds a 5 percent chance that results are due to chance. Which of the following is an accurate interpretation of this finding?
This is highly statistically significant.
B. This is the minimum result typically considered statistically significant..
C. This is not statistically significant.
D. There is no way to determine statistical significance without replication of the study.
E. Chance or coincidence is unrelated to statistical significance.<br>
This is highly statistically significant.
B. This is the minimum result typically considered statistically significant..
C. This is not statistically significant.
D. There is no way to determine statistical significance without replication of the study.
E. Chance or coincidence is unrelated to statistical significance.<br>
162
Learning Target 8-1 Review Explain why we need statistics in
psychology and in everyday life. Psychological researchers use statistics to measure variables and interpret results
A basic understanding of statistics helps us think smarter about medical advice and news reports of all kinds.<br>
psychology and in everyday life. Psychological researchers use statistics to measure variables and interpret results
A basic understanding of statistics helps us think smarter about medical advice and news reports of all kinds.<br>
163
Learning Target 8-2 Review Describe descriptive statistics. Researchers use descriptive statistics to measure and describe characteristics of groups under study.
They may use a histogram to display data.
Descriptive statistics include measures of central tendency and measures of variation.<br>
They may use a histogram to display data.
Descriptive statistics include measures of central tendency and measures of variation.<br>
164
Learning Target 8-3 Review Explain how we describe data using the
three measures of central tendency. A measure of central tendency is a single score that represents a whole set of scores
Mean
Median
Mode<br>
three measures of central tendency. A measure of central tendency is a single score that represents a whole set of scores
Mean
Median
Mode<br>
165
Learning Target 8-4 Review Discuss the relative usefulness of
the two measures of variation. Measures of variation tell us how different data are.
Range
Standard deviation
Scores often form a normal (or bell-shaped) curve<br>
the two measures of variation. Measures of variation tell us how different data are.
Range
Standard deviation
Scores often form a normal (or bell-shaped) curve<br>
166
Learning Target 8-5 Review Describe inferential statistics. Researchers use inferential statistics to determine the probability of their findings being also true of the larger population
Inferential statistics include ways of determining the reliability and significance of an observed difference between the results for different groups.<br>
Inferential statistics include ways of determining the reliability and significance of an observed difference between the results for different groups.<br>
167
Learning Target 8-6 Review Explain how we determine whether an observed difference can be
generalized to other populations. The difference must be reliable and significant.
Reliable differences are based on samples that
are representative of the larger population,
demonstrate low variability, and
consist of many cases.
We can say that an observed difference has statistical significance if sample averages are reliable when the difference between them is large.<br>
generalized to other populations. The difference must be reliable and significant.
Reliable differences are based on samples that
are representative of the larger population,
demonstrate low variability, and
consist of many cases.
We can say that an observed difference has statistical significance if sample averages are reliable when the difference between them is large.<br>