
Wake Up and Smell the Coffee: Developing Realistic
MT
Published · 22 slides · 0 views
1 / 1




Description
Wake Up and Smell the Coffee: Developing Realistic Risk Estimates Christian B. Smart, Ph.D. Expert Cost Analyst Mission Technology Solutions 2026 KBR, Inc. UNCLASSIFIED 1 Presenter Introductions Christian B. Smart, Ph.D. Expert Cost
Related Topics
Share
Embed code
Download this presentation From Below
"Wake Up and Smell the Coffee: Developing Realistic" is the property of its rightful owner. Permission is granted to download and print the materials on this website for personal, non-commercial use only, and to display it on your personal computer provided you do not modify the materials and that you retain all copyright notices contained in the materials. By downloading content from our website, you accept the terms of this agreement.
Presentation Transcript
01
Wake Up and Smell the Coffee:
Developing Realistic Risk Estimates Christian B. Smart, Ph.D.
Expert Cost Analyst
Mission Technology Solutions © 2026 KBR, Inc. UNCLASSIFIED 1<br>
Expert Cost Analyst
Mission Technology Solutions © 2026 KBR, Inc. UNCLASSIFIED 1<br>
02
Presenter Introductions Christian B. Smart, Ph.D. Expert Cost Analyst Presented by: © 2026 KBR, Inc. UNCLASSIFIED 2<br>
03
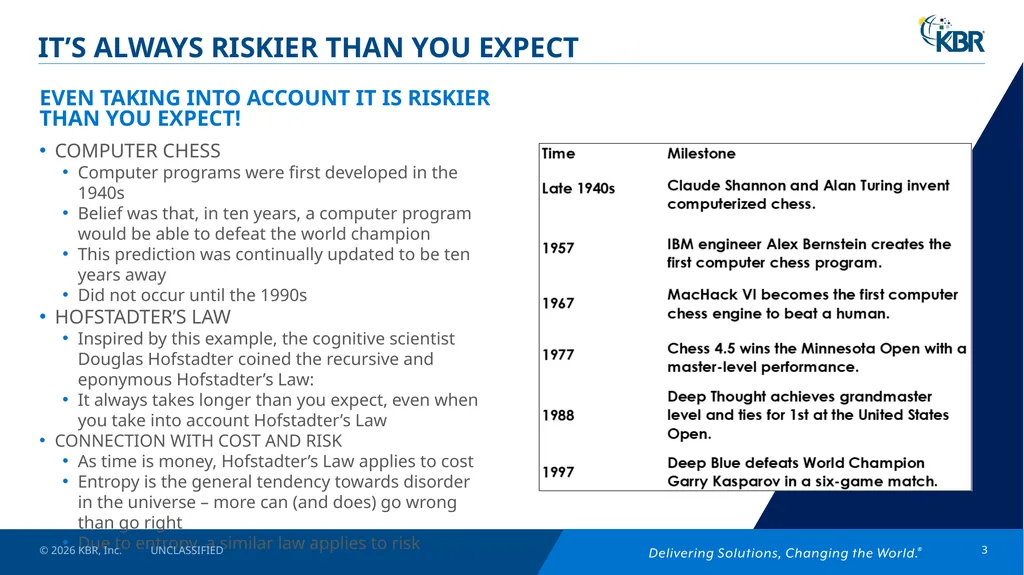
EVEN TAKING INTO ACCOUNT IT IS RISKIER THAN YOU EXPECT! IT’S ALWAYS RISKIER THAN YOU EXPECT COMPUTER CHESS
Computer programs were first developed in the 1940s
Belief was that, in ten years, a computer program would be able to defeat the world champion
This prediction was continually updated to be ten years away
Did not occur until the 1990s
HOFSTADTER’S LAW
Inspired by this example, the cognitive scientist Douglas Hofstadter coined the recursive and eponymous Hofstadter’s Law:
It always takes longer than you expect, even when you take into account Hofstadter’s Law
CONNECTION WITH COST AND RISK
As time is money, Hofstadter’s Law applies to cost
Entropy is the general tendency towards disorder in the universe – more can (and does) go wrong than go right
Due to entropy, a similar law applies to risk © 2026 KBR, Inc. UNCLASSIFIED 3<br>
Computer programs were first developed in the 1940s
Belief was that, in ten years, a computer program would be able to defeat the world champion
This prediction was continually updated to be ten years away
Did not occur until the 1990s
HOFSTADTER’S LAW
Inspired by this example, the cognitive scientist Douglas Hofstadter coined the recursive and eponymous Hofstadter’s Law:
It always takes longer than you expect, even when you take into account Hofstadter’s Law
CONNECTION WITH COST AND RISK
As time is money, Hofstadter’s Law applies to cost
Entropy is the general tendency towards disorder in the universe – more can (and does) go wrong than go right
Due to entropy, a similar law applies to risk © 2026 KBR, Inc. UNCLASSIFIED 3<br>
04
QUANTITATIVE COST AND SCHEDULE RISK IMPERATIVE RISK IS A MUST, NOT AN OPTION
High degree and frequency of cost and schedule growth in completed projects means that there is a great deal of resource risk
MORE THAN JUST AVERAGES
It is not sufficient to develop a single point estimate of cost or schedule
“Projects that are based on averages are, on average, behind schedule and beyond budget.” – Sam Savage, The Flaw of Averages
NEEDS TO BE QUANTITATIVE
Qualitative risk assessment alone results in significant underestimation of risk
Need to move beyond the risk matrix and robustly assess cost and schedule risk with a quantitative analysis
S-CURVES
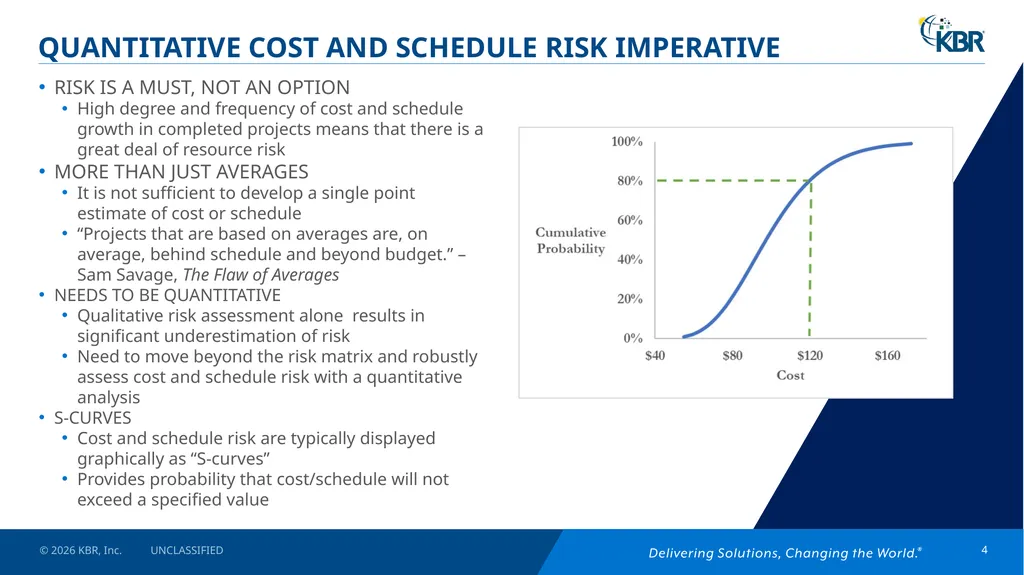
Cost and schedule risk are typically displayed graphically as “S-curves”
Provides probability that cost/schedule will not exceed a specified value © 2026 KBR, Inc. UNCLASSIFIED 4<br>
High degree and frequency of cost and schedule growth in completed projects means that there is a great deal of resource risk
MORE THAN JUST AVERAGES
It is not sufficient to develop a single point estimate of cost or schedule
“Projects that are based on averages are, on average, behind schedule and beyond budget.” – Sam Savage, The Flaw of Averages
NEEDS TO BE QUANTITATIVE
Qualitative risk assessment alone results in significant underestimation of risk
Need to move beyond the risk matrix and robustly assess cost and schedule risk with a quantitative analysis
S-CURVES
Cost and schedule risk are typically displayed graphically as “S-curves”
Provides probability that cost/schedule will not exceed a specified value © 2026 KBR, Inc. UNCLASSIFIED 4<br>
05
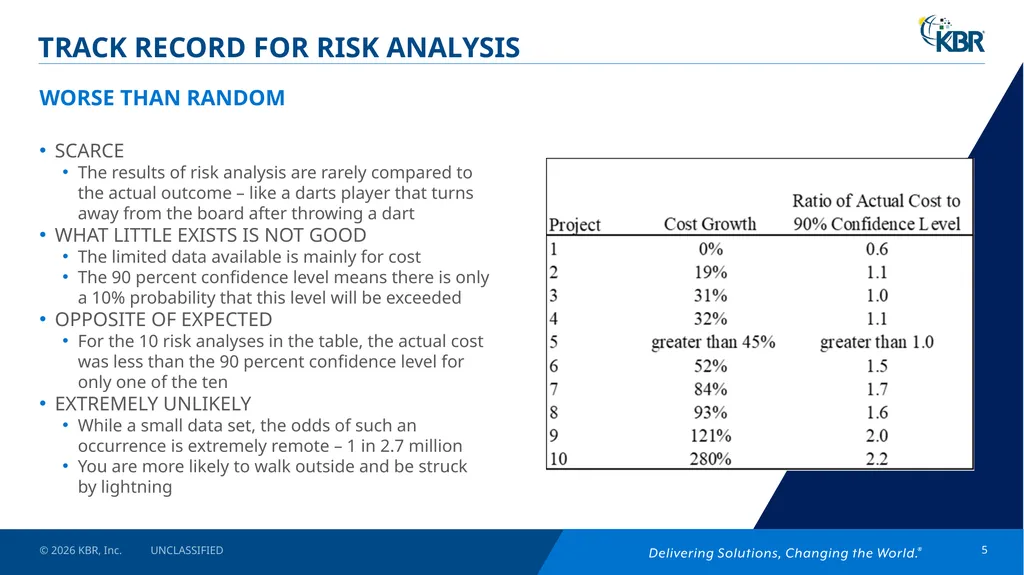
WORSE THAN RANDOM TRACK RECORD FOR RISK ANALYSIS SCARCE
The results of risk analysis are rarely compared to the actual outcome – like a darts player that turns away from the board after throwing a dart
WHAT LITTLE EXISTS IS NOT GOOD
The limited data available is mainly for cost
The 90 percent confidence level means there is only a 10% probability that this level will be exceeded
OPPOSITE OF EXPECTED
For the 10 risk analyses in the table, the actual cost was less than the 90 percent confidence level for only one of the ten
EXTREMELY UNLIKELY
While a small data set, the odds of such an occurrence is extremely remote – 1 in 2.7 million
You are more likely to walk outside and be struck by lightning © 2026 KBR, Inc. UNCLASSIFIED 5<br>
The results of risk analysis are rarely compared to the actual outcome – like a darts player that turns away from the board after throwing a dart
WHAT LITTLE EXISTS IS NOT GOOD
The limited data available is mainly for cost
The 90 percent confidence level means there is only a 10% probability that this level will be exceeded
OPPOSITE OF EXPECTED
For the 10 risk analyses in the table, the actual cost was less than the 90 percent confidence level for only one of the ten
EXTREMELY UNLIKELY
While a small data set, the odds of such an occurrence is extremely remote – 1 in 2.7 million
You are more likely to walk outside and be struck by lightning © 2026 KBR, Inc. UNCLASSIFIED 5<br>
06
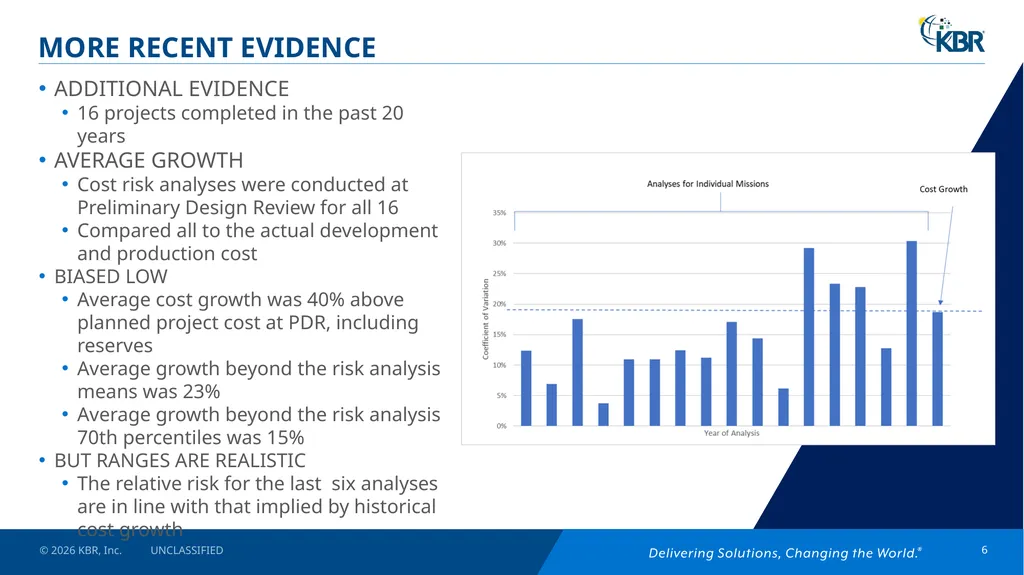
MORE RECENT EVIDENCE ADDITIONAL EVIDENCE
16 projects completed in the past 20 years
AVERAGE GROWTH
Cost risk analyses were conducted at Preliminary Design Review for all 16
Compared all to the actual development and production cost
BIASED LOW
Average cost growth was 40% above planned project cost at PDR, including reserves
Average growth beyond the risk analysis means was 23%
Average growth beyond the risk analysis 70th percentiles was 15%
BUT RANGES ARE REALISTIC
The relative risk for the last six analyses are in line with that implied by historical cost growth © 2026 KBR, Inc. UNCLASSIFIED 6<br>
16 projects completed in the past 20 years
AVERAGE GROWTH
Cost risk analyses were conducted at Preliminary Design Review for all 16
Compared all to the actual development and production cost
BIASED LOW
Average cost growth was 40% above planned project cost at PDR, including reserves
Average growth beyond the risk analysis means was 23%
Average growth beyond the risk analysis 70th percentiles was 15%
BUT RANGES ARE REALISTIC
The relative risk for the last six analyses are in line with that implied by historical cost growth © 2026 KBR, Inc. UNCLASSIFIED 6<br>
07
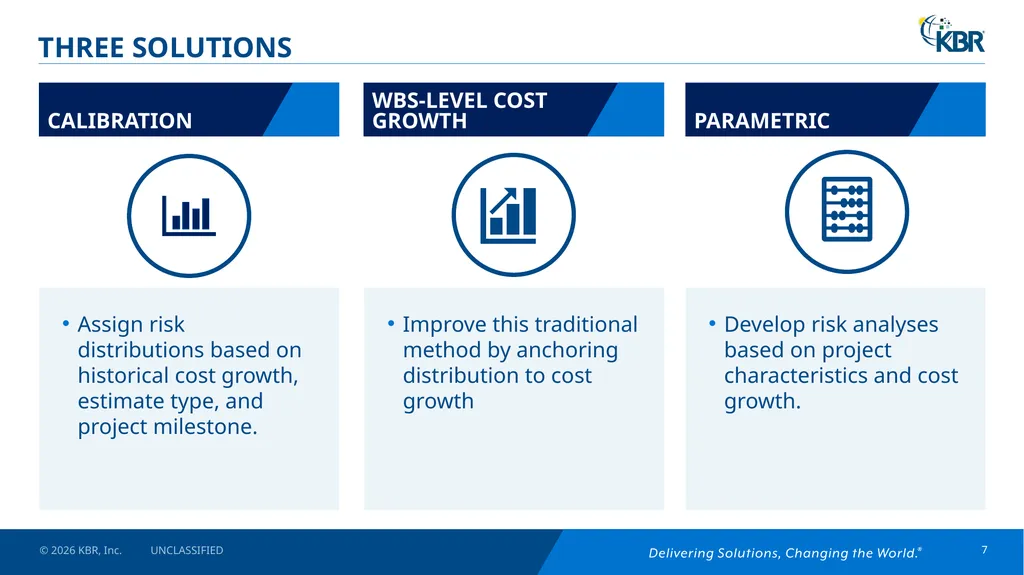
Assign risk distributions based on historical cost growth, estimate type, and project milestone. Improve this traditional method by anchoring distribution to cost growth Develop risk analyses based on project characteristics and cost growth. THREE SOLUTIONS © 2026 KBR, Inc. UNCLASSIFIED 7 CALIBRATION WBS-LEVEL COST GROWTH PARAMETRIC<br>
08
METHOD 1
CALIBRATION TO HISTORY © 2026 KBR, Inc. UNCLASSIFIED 8<br>
09
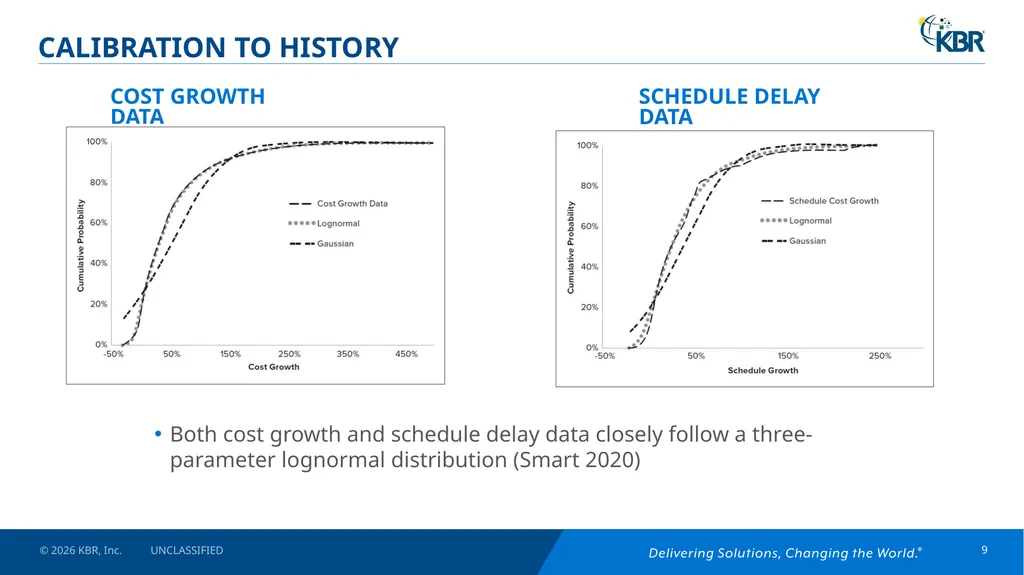
CALIBRATION TO HISTORY Both cost growth and schedule delay data closely follow a three-parameter lognormal distribution (Smart 2020) COST GROWTH DATA © 2026 KBR, Inc. UNCLASSIFIED 9 SCHEDULE DELAY DATA<br>
10
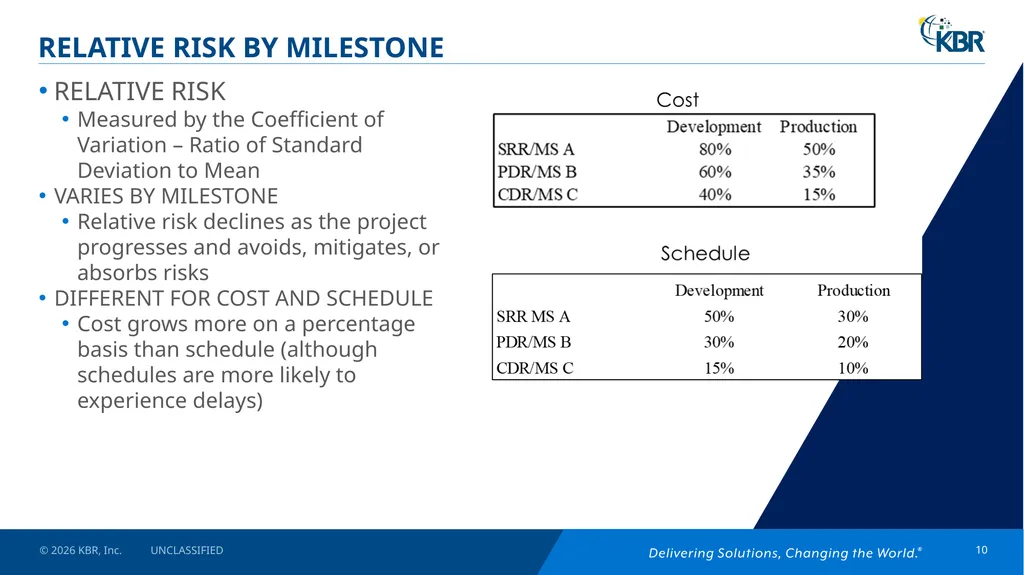
RELATIVE RISK BY MILESTONE RELATIVE RISK
Measured by the Coefficient of Variation – Ratio of Standard Deviation to Mean
VARIES BY MILESTONE
Relative risk declines as the project progresses and avoids, mitigates, or absorbs risks
DIFFERENT FOR COST AND SCHEDULE
Cost grows more on a percentage basis than schedule (although schedules are more likely to experience delays) © 2026 KBR, Inc. UNCLASSIFIED 10<br>
Measured by the Coefficient of Variation – Ratio of Standard Deviation to Mean
VARIES BY MILESTONE
Relative risk declines as the project progresses and avoids, mitigates, or absorbs risks
DIFFERENT FOR COST AND SCHEDULE
Cost grows more on a percentage basis than schedule (although schedules are more likely to experience delays) © 2026 KBR, Inc. UNCLASSIFIED 10<br>
11
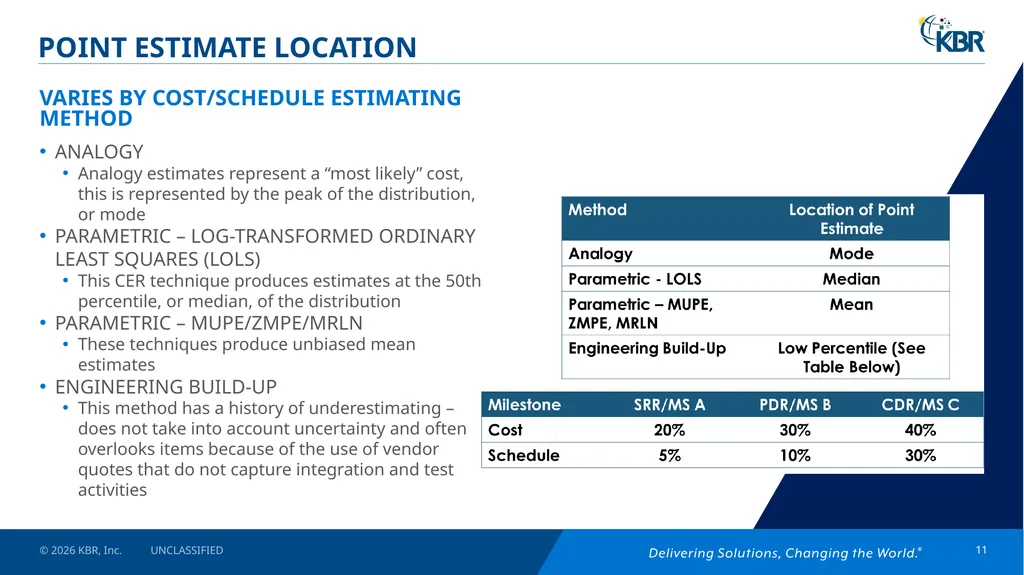
VARIES BY COST/SCHEDULE ESTIMATING METHOD POINT ESTIMATE LOCATION ANALOGY
Analogy estimates represent a “most likely” cost, this is represented by the peak of the distribution, or mode
PARAMETRIC – LOG-TRANSFORMED ORDINARY LEAST SQUARES (LOLS)
This CER technique produces estimates at the 50th percentile, or median, of the distribution
PARAMETRIC – MUPE/ZMPE/MRLN
These techniques produce unbiased mean estimates
ENGINEERING BUILD-UP
This method has a history of underestimating – does not take into account uncertainty and often overlooks items because of the use of vendor quotes that do not capture integration and test activities © 2026 KBR, Inc. UNCLASSIFIED 11<br>
Analogy estimates represent a “most likely” cost, this is represented by the peak of the distribution, or mode
PARAMETRIC – LOG-TRANSFORMED ORDINARY LEAST SQUARES (LOLS)
This CER technique produces estimates at the 50th percentile, or median, of the distribution
PARAMETRIC – MUPE/ZMPE/MRLN
These techniques produce unbiased mean estimates
ENGINEERING BUILD-UP
This method has a history of underestimating – does not take into account uncertainty and often overlooks items because of the use of vendor quotes that do not capture integration and test activities © 2026 KBR, Inc. UNCLASSIFIED 11<br>
12
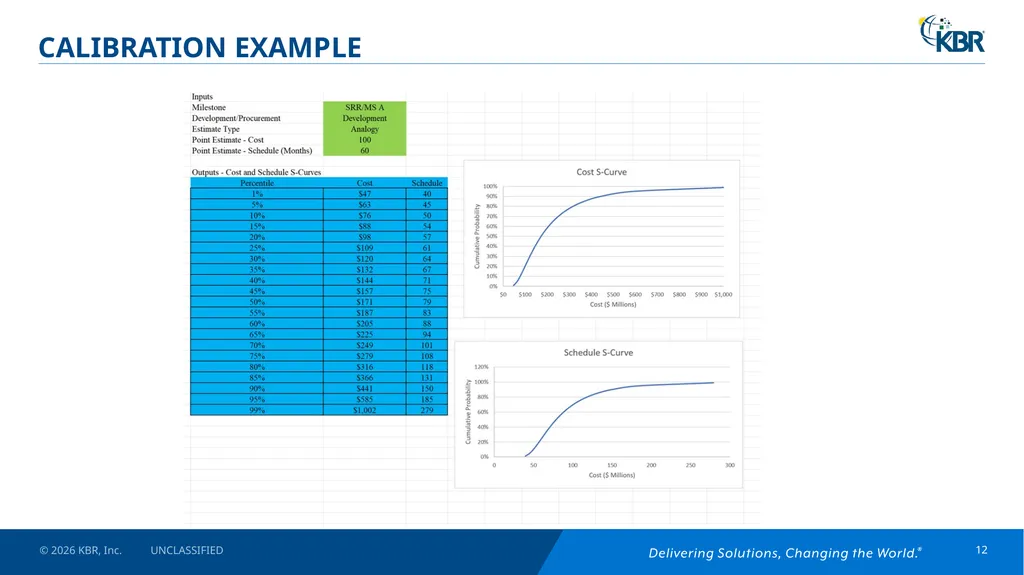
CALIBRATION EXAMPLE © 2026 KBR, Inc. UNCLASSIFIED 12<br>
13
METHOD 2
IMPROVED WBS AGGREGATION WITH WBS-LEVEL COST GROWTH © 2026 KBR, Inc. UNCLASSIFIED 13<br>
14
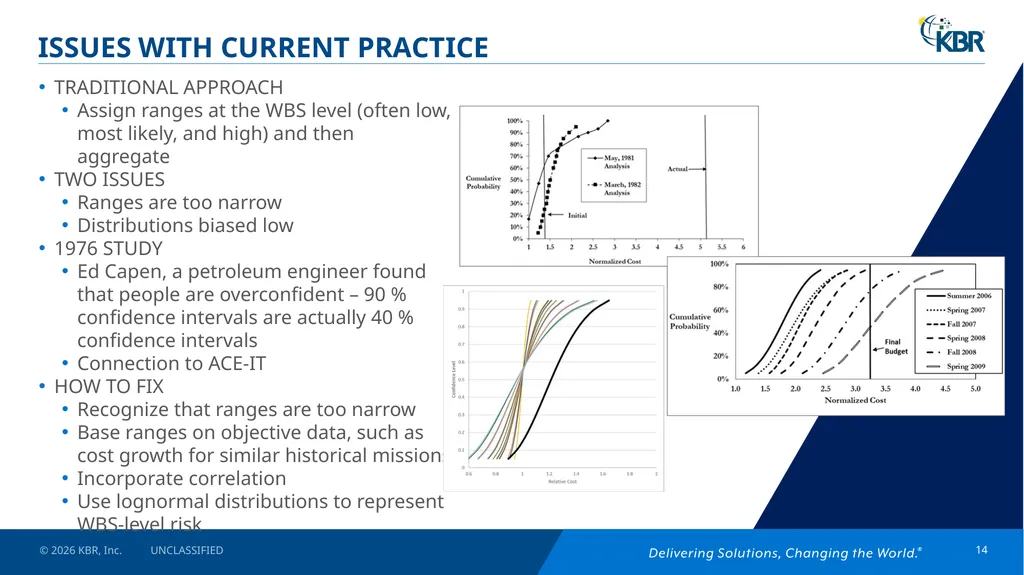
ISSUES WITH CURRENT PRACTICE TRADITIONAL APPROACH
Assign ranges at the WBS level (often low, most likely, and high) and then aggregate
TWO ISSUES
Ranges are too narrow
Distributions biased low
1976 STUDY
Ed Capen, a petroleum engineer found that people are overconfident – 90 % confidence intervals are actually 40 % confidence intervals
Connection to ACE-IT
HOW TO FIX
Recognize that ranges are too narrow
Base ranges on objective data, such as cost growth for similar historical missions
Incorporate correlation
Use lognormal distributions to represent WBS-level risk © 2026 KBR, Inc. UNCLASSIFIED 14<br>
Assign ranges at the WBS level (often low, most likely, and high) and then aggregate
TWO ISSUES
Ranges are too narrow
Distributions biased low
1976 STUDY
Ed Capen, a petroleum engineer found that people are overconfident – 90 % confidence intervals are actually 40 % confidence intervals
Connection to ACE-IT
HOW TO FIX
Recognize that ranges are too narrow
Base ranges on objective data, such as cost growth for similar historical missions
Incorporate correlation
Use lognormal distributions to represent WBS-level risk © 2026 KBR, Inc. UNCLASSIFIED 14<br>
15
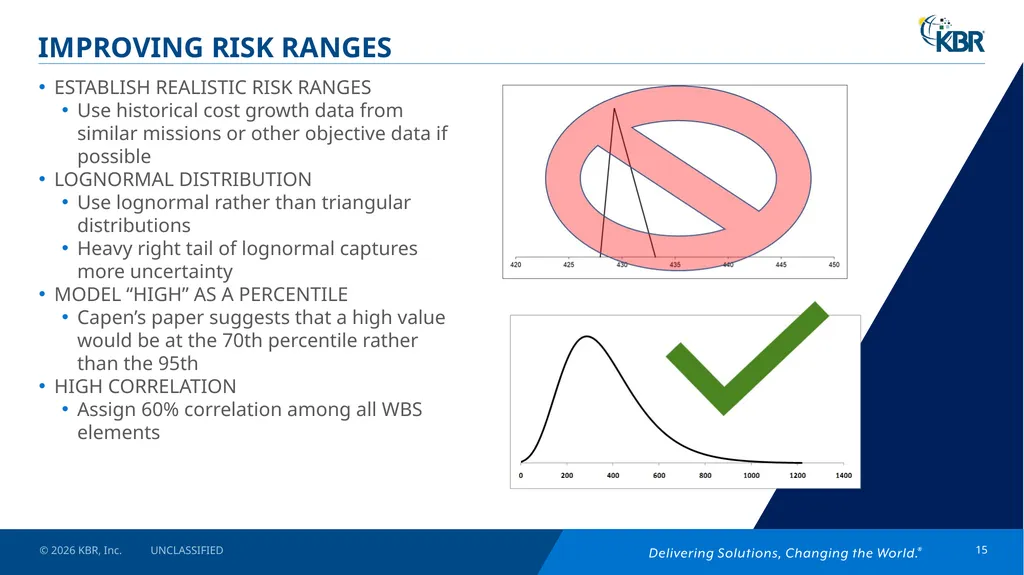
IMPROVING RISK RANGES ESTABLISH REALISTIC RISK RANGES
Use historical cost growth data from similar missions or other objective data if possible
LOGNORMAL DISTRIBUTION
Use lognormal rather than triangular distributions
Heavy right tail of lognormal captures more uncertainty
MODEL “HIGH” AS A PERCENTILE
Capen’s paper suggests that a high value would be at the 70th percentile rather than the 95th
HIGH CORRELATION
Assign 60% correlation among all WBS elements © 2026 KBR, Inc. UNCLASSIFIED 15<br>
Use historical cost growth data from similar missions or other objective data if possible
LOGNORMAL DISTRIBUTION
Use lognormal rather than triangular distributions
Heavy right tail of lognormal captures more uncertainty
MODEL “HIGH” AS A PERCENTILE
Capen’s paper suggests that a high value would be at the 70th percentile rather than the 95th
HIGH CORRELATION
Assign 60% correlation among all WBS elements © 2026 KBR, Inc. UNCLASSIFIED 15<br>
16
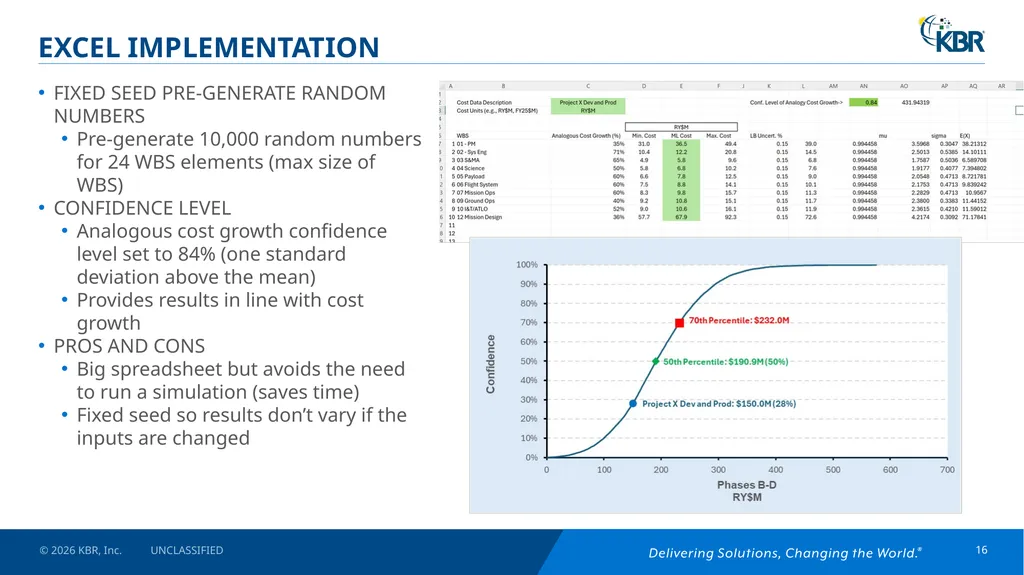
EXCEL IMPLEMENTATION FIXED SEED PRE-GENERATE RANDOM NUMBERS
Pre-generate 10,000 random numbers for 24 WBS elements (max size of WBS)
CONFIDENCE LEVEL
Analogous cost growth confidence level set to 84% (one standard deviation above the mean)
Provides results in line with cost growth
PROS AND CONS
Big spreadsheet but avoids the need to run a simulation (saves time)
Fixed seed so results don’t vary if the inputs are changed © 2026 KBR, Inc. UNCLASSIFIED 16<br>
Pre-generate 10,000 random numbers for 24 WBS elements (max size of WBS)
CONFIDENCE LEVEL
Analogous cost growth confidence level set to 84% (one standard deviation above the mean)
Provides results in line with cost growth
PROS AND CONS
Big spreadsheet but avoids the need to run a simulation (saves time)
Fixed seed so results don’t vary if the inputs are changed © 2026 KBR, Inc. UNCLASSIFIED 16<br>
17
METHOD 3
PARAMETRIC METHOD © 2026 KBR, Inc. UNCLASSIFIED 17<br>
18
“Research is what I’m doing when I don’t know what I’m doing.”
Werner von Braun © 2026 KBR, Inc. UNCLASSIFIED 18<br>
19
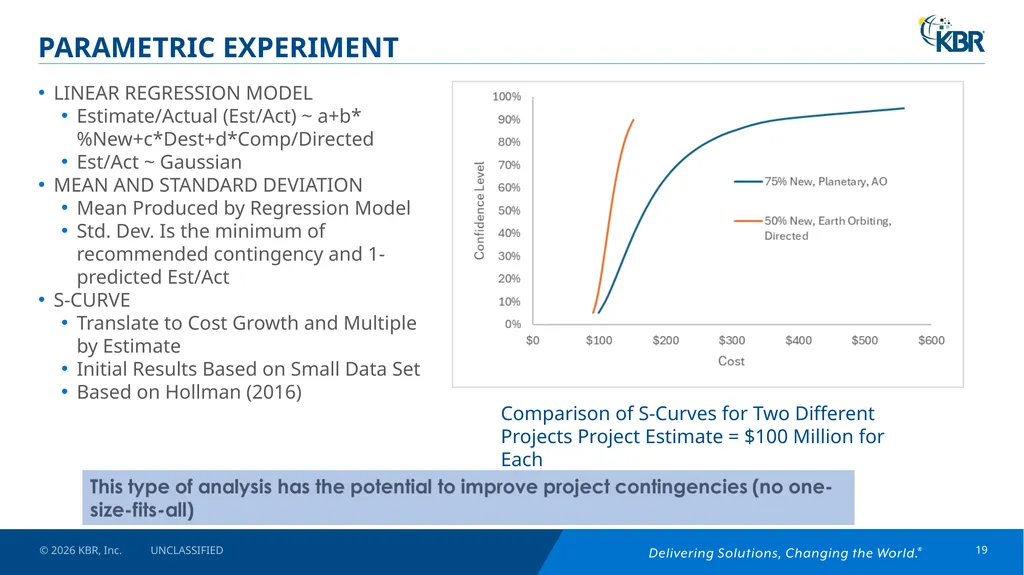
PARAMETRIC EXPERIMENT LINEAR REGRESSION MODEL
Estimate/Actual (Est/Act) ~ a+b*%New+c*Dest+d*Comp/Directed
Est/Act ~ Gaussian
MEAN AND STANDARD DEVIATION
Mean Produced by Regression Model
Std. Dev. Is the minimum of recommended contingency and 1-predicted Est/Act
S-CURVE
Translate to Cost Growth and Multiple by Estimate
Initial Results Based on Small Data Set
Based on Hollman (2016) © 2026 KBR, Inc. UNCLASSIFIED 19 Comparison of S-Curves for Two Different Projects Project Estimate = $100 Million for Each<br>
Estimate/Actual (Est/Act) ~ a+b*%New+c*Dest+d*Comp/Directed
Est/Act ~ Gaussian
MEAN AND STANDARD DEVIATION
Mean Produced by Regression Model
Std. Dev. Is the minimum of recommended contingency and 1-predicted Est/Act
S-CURVE
Translate to Cost Growth and Multiple by Estimate
Initial Results Based on Small Data Set
Based on Hollman (2016) © 2026 KBR, Inc. UNCLASSIFIED 19 Comparison of S-Curves for Two Different Projects Project Estimate = $100 Million for Each<br>
20
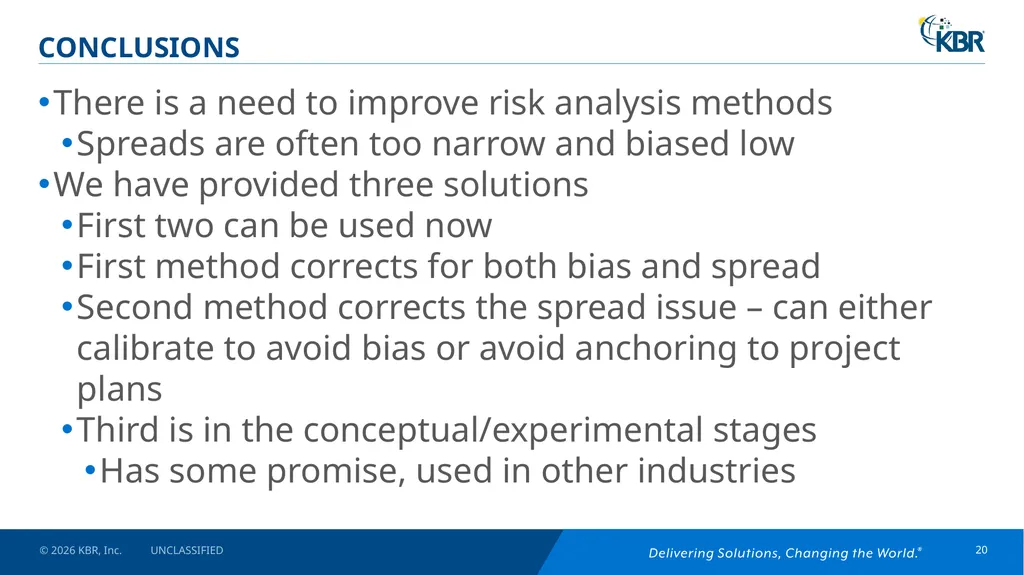
CONCLUSIONS There is a need to improve risk analysis methods
Spreads are often too narrow and biased low
We have provided three solutions
First two can be used now
First method corrects for both bias and spread
Second method corrects the spread issue – can either calibrate to avoid bias or avoid anchoring to project plans
Third is in the conceptual/experimental stages
Has some promise, used in other industries © 2026 KBR, Inc. UNCLASSIFIED 20<br>
Spreads are often too narrow and biased low
We have provided three solutions
First two can be used now
First method corrects for both bias and spread
Second method corrects the spread issue – can either calibrate to avoid bias or avoid anchoring to project plans
Third is in the conceptual/experimental stages
Has some promise, used in other industries © 2026 KBR, Inc. UNCLASSIFIED 20<br>
21
REFERENCES/FURTHER READING Some of Christian Smart’s papers related to risk can be found at https://www.iceaaonline.com/publications/solvingprm/
Cost Estimating Body of Knowledge 2.0 (Beta) (www.iceaaonline.com)
E.C. Capen, “The Difficulty of Assessing Uncertainty,” Journal of Petroleum Technology 28 (8) pp 843-850
John Hollmann, Project Risk Quantification (Gainesville: Probabilistic Publishing, 2016)
Christian B. Smart, Solving for Project Risk Management: Understanding the Critical Role of Uncertainty in Project Management, (New York: McGraw-Hill, 2020) © 2026 KBR, Inc. UNCLASSIFIED 21<br>
Cost Estimating Body of Knowledge 2.0 (Beta) (www.iceaaonline.com)
E.C. Capen, “The Difficulty of Assessing Uncertainty,” Journal of Petroleum Technology 28 (8) pp 843-850
John Hollmann, Project Risk Quantification (Gainesville: Probabilistic Publishing, 2016)
Christian B. Smart, Solving for Project Risk Management: Understanding the Critical Role of Uncertainty in Project Management, (New York: McGraw-Hill, 2020) © 2026 KBR, Inc. UNCLASSIFIED 21<br>
22
Thank You © 2026 KBR, Inc. UNCLASIFIED 22<br>