
Westgard Rules Detecting Changes in the Analytical
SN
Published · 39 slides · 0 views
1 / 1




Description
Westgard Rules Detecting Changes in the Analytical System Labs for Life Project Quality Control TRAINING Rules for what? Westgard has formulated rules to decide whether an analytical run is in-control or out-of-control. These rules can be
Related Topics
Share
Embed code
Download this presentation From Below
"Westgard Rules Detecting Changes in the Analytical" is the property of its rightful owner. Permission is granted to download and print the materials on this website for personal, non-commercial use only, and to display it on your personal computer provided you do not modify the materials and that you retain all copyright notices contained in the materials. By downloading content from our website, you accept the terms of this agreement.
Presentation Transcript
01
Westgard Rules
Detecting Changes in the Analytical System
Labs for Life Project Quality Control TRAINING<br>
02
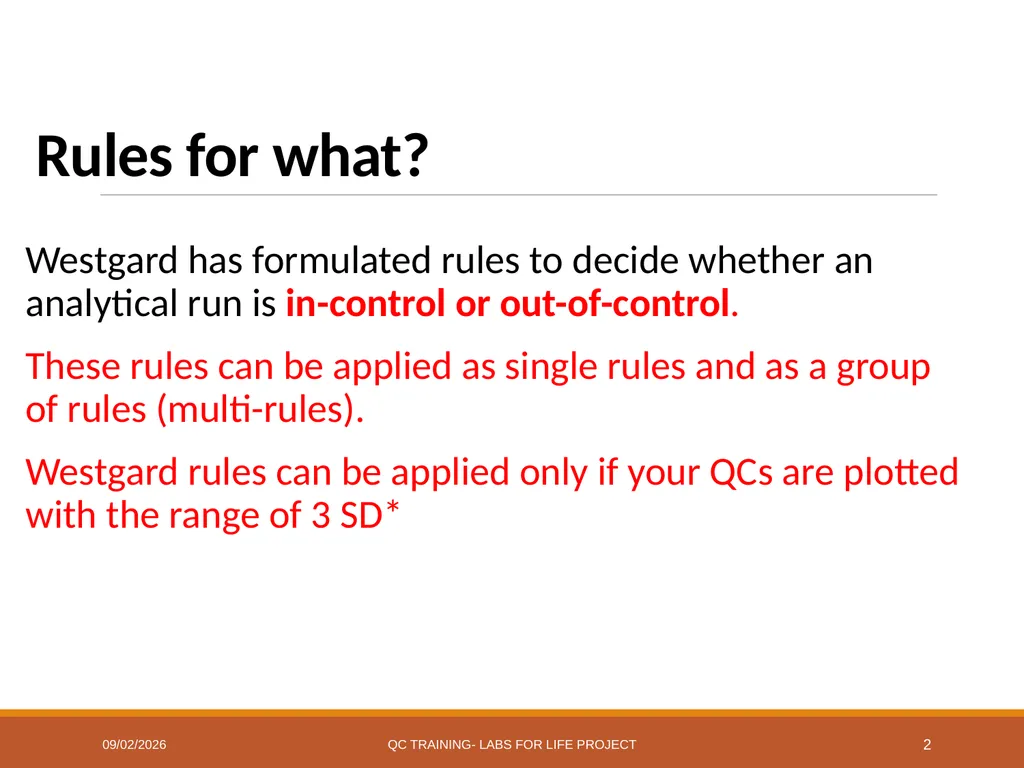
Rules for what? Westgard has formulated rules to decide whether an analytical run is in-control or out-of-control.
These rules can be applied as single rules and as a group of rules (multi-rules).
Westgard rules can be applied only if your QCs are plotted with the range of 3 SD* 7/7/2017 QC Training- Labs for Life Project 2<br>
These rules can be applied as single rules and as a group of rules (multi-rules).
Westgard rules can be applied only if your QCs are plotted with the range of 3 SD* 7/7/2017 QC Training- Labs for Life Project 2<br>
03
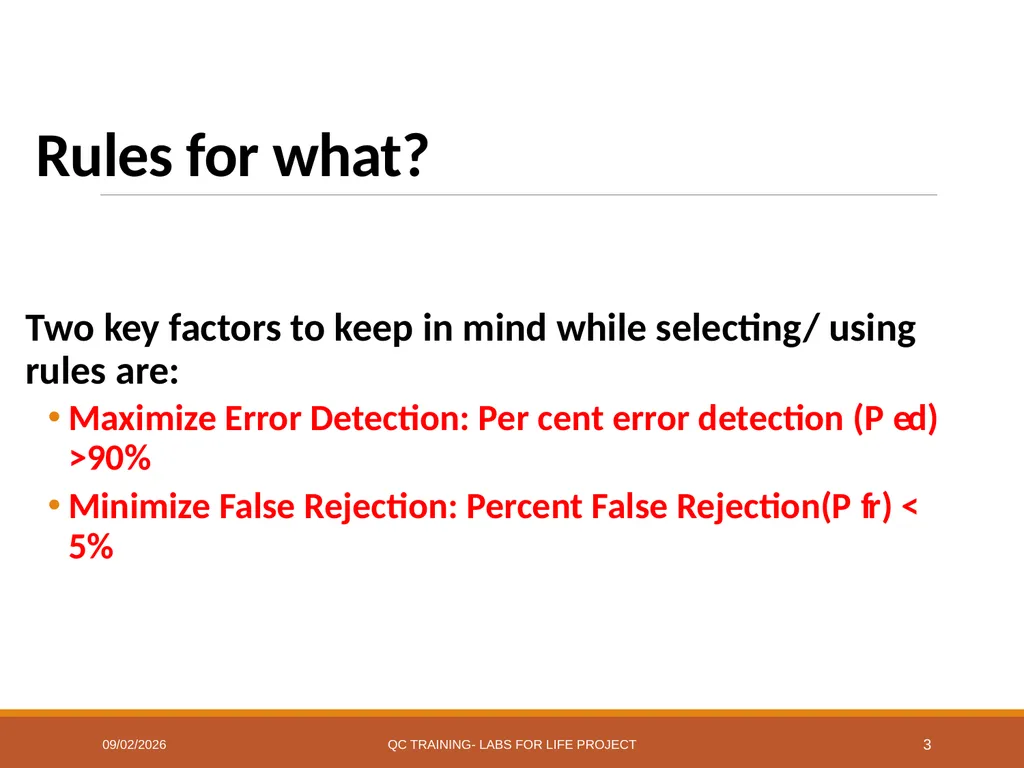
Rules for what? Two key factors to keep in mind while selecting/ using rules are:
Maximize Error Detection: Per cent error detection (P ed) >90%
Minimize False Rejection: Percent False Rejection(P fr) < 5% 7/7/2017 QC Training- Labs for Life Project 3<br>
Maximize Error Detection: Per cent error detection (P ed) >90%
Minimize False Rejection: Percent False Rejection(P fr) < 5% 7/7/2017 QC Training- Labs for Life Project 3<br>
04
While talking about QC rule nomenclatures we have to understand 2 sets of nomenclatures.
N and L
Within/ across of Run/material.
We will talk about these now 7/7/2017 QC Training- Labs for Life Project 4<br>
N and L
Within/ across of Run/material.
We will talk about these now 7/7/2017 QC Training- Labs for Life Project 4<br>
05
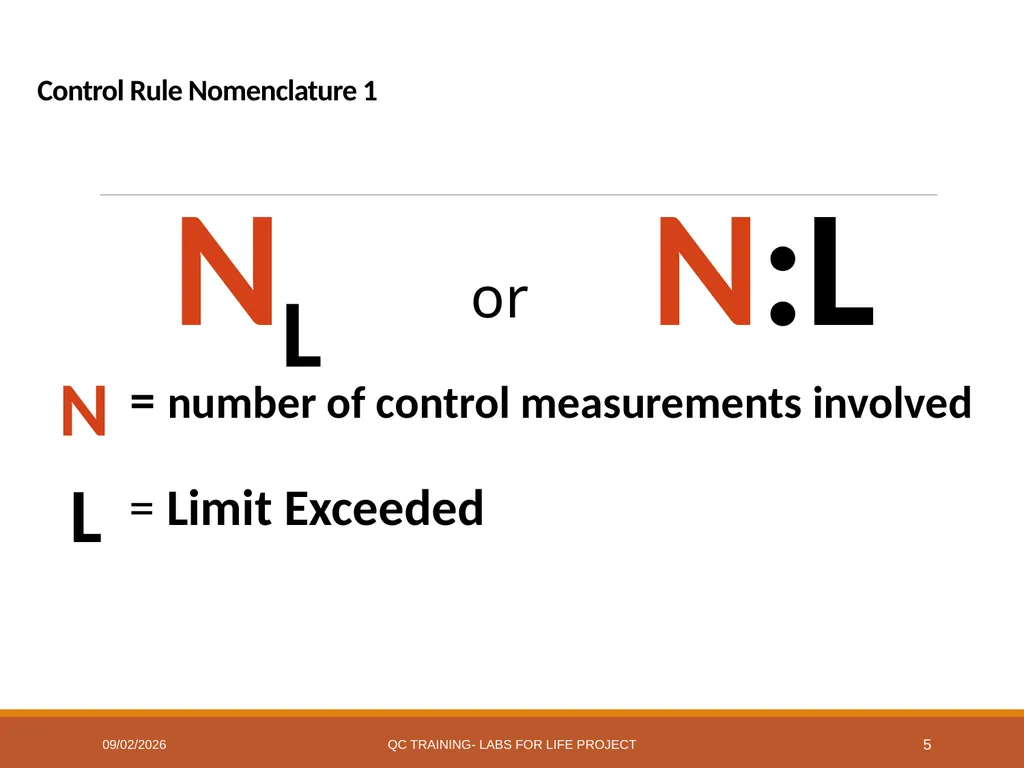
Control Rule Nomenclature 1 NL N:L N L = number of control measurements involved = Limit Exceeded or 7/7/2017 QC Training- Labs for Life Project 5<br>
06
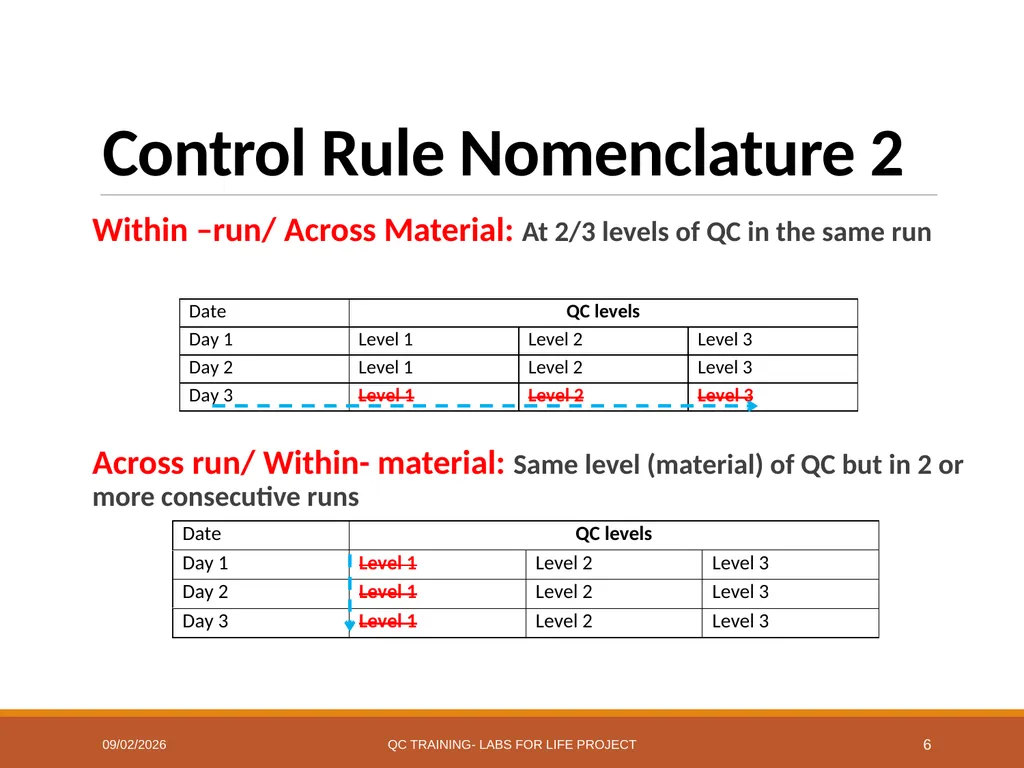
Control Rule Nomenclature 2 Within –run/ Across Material: At 2/3 levels of QC in the same run
Across run/ Within- material: Same level (material) of QC but in 2 or more consecutive runs 7/7/2017 QC Training- Labs for Life Project 6<br>
Across run/ Within- material: Same level (material) of QC but in 2 or more consecutive runs 7/7/2017 QC Training- Labs for Life Project 6<br>
07
Rule Violations Now that we know 2 things
What happens in stable analytical systems (Gaussian with stable mean and stable SDs)
How rule violations are named
Let us proceed with looking for specific rule violations and the possible reasons for their occurance 7/7/2017 QC Training- Labs for Life Project 7<br>
What happens in stable analytical systems (Gaussian with stable mean and stable SDs)
How rule violations are named
Let us proceed with looking for specific rule violations and the possible reasons for their occurance 7/7/2017 QC Training- Labs for Life Project 7<br>
08
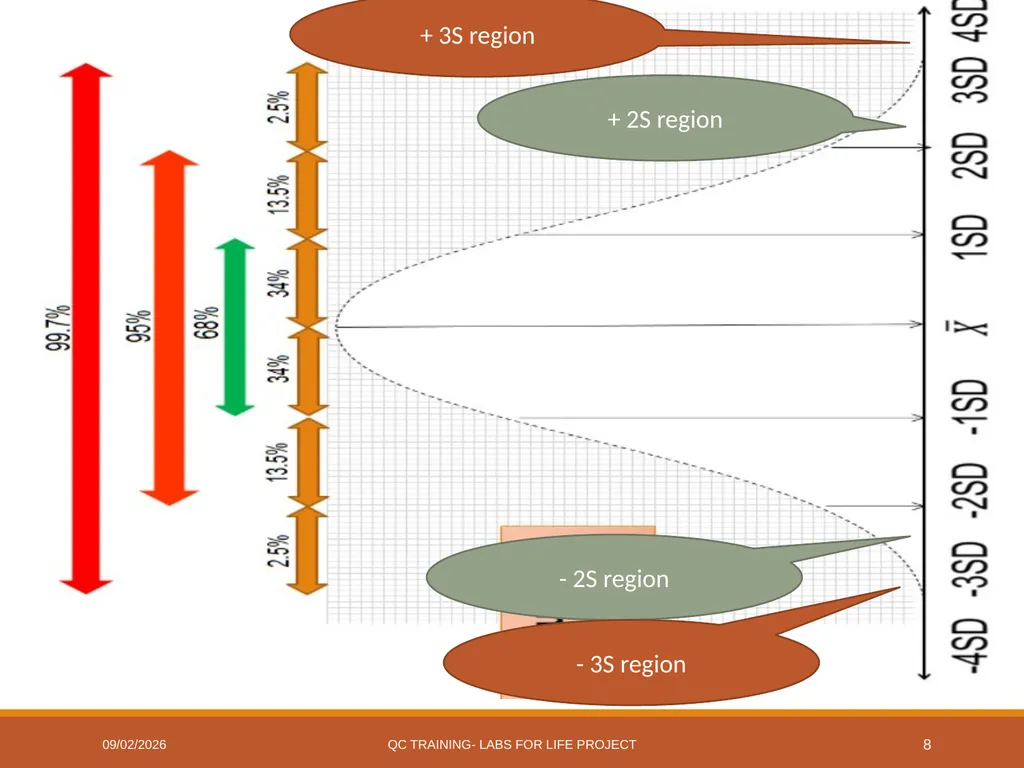
7/7/2017 QC Training- Labs for Life Project 8 + 3S region - 2S region - 3S region + 2S region<br>
09
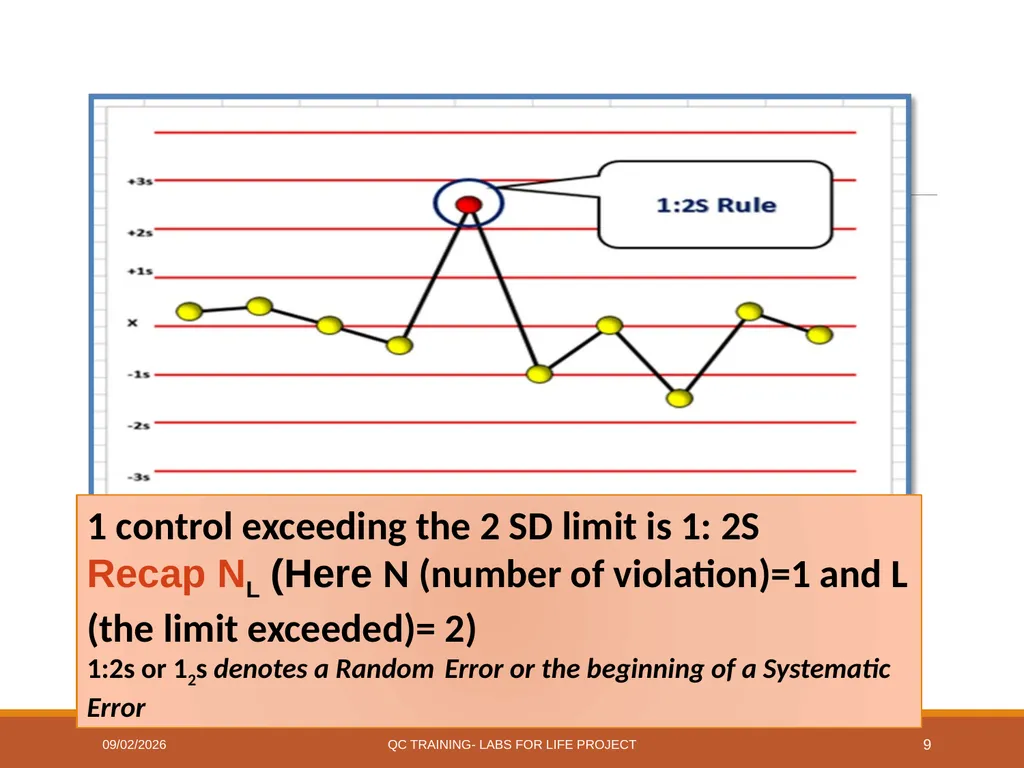
1 control exceeding the 2 SD limit is 1: 2S
Recap NL (Here N (number of violation)=1 and L (the limit exceeded)= 2)
1:2s or 12s denotes a Random Error or the beginning of a Systematic Error 7/7/2017 QC Training- Labs for Life Project 9<br>
Recap NL (Here N (number of violation)=1 and L (the limit exceeded)= 2)
1:2s or 12s denotes a Random Error or the beginning of a Systematic Error 7/7/2017 QC Training- Labs for Life Project 9<br>
10
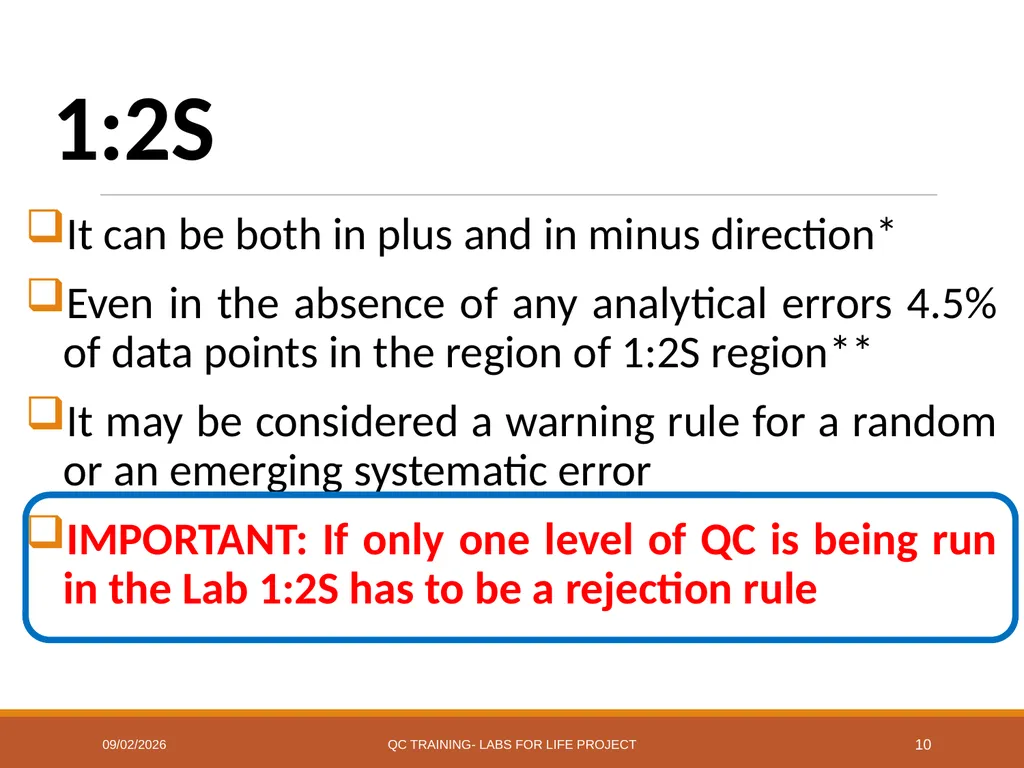
1:2S It can be both in plus and in minus direction*
Even in the absence of any analytical errors 4.5% of data points in the region of 1:2S region**
It may be considered a warning rule for a random or an emerging systematic error
IMPORTANT: If only one level of QC is being run in the Lab 1:2S has to be a rejection rule 7/7/2017 QC Training- Labs for Life Project 10<br>
Even in the absence of any analytical errors 4.5% of data points in the region of 1:2S region**
It may be considered a warning rule for a random or an emerging systematic error
IMPORTANT: If only one level of QC is being run in the Lab 1:2S has to be a rejection rule 7/7/2017 QC Training- Labs for Life Project 10<br>
11
What about the P fr and P ed of 1: 2s? Very good P ed as all runs going outside 2 SDs are considered outliers
Unacceptable P fr as:
4.7% good runs rejected if one control level is considered.
9.4% if 2 control levels
14% if 3 control levels 7/7/2017 QC Training- Labs for Life Project 11<br>
Unacceptable P fr as:
4.7% good runs rejected if one control level is considered.
9.4% if 2 control levels
14% if 3 control levels 7/7/2017 QC Training- Labs for Life Project 11<br>
12
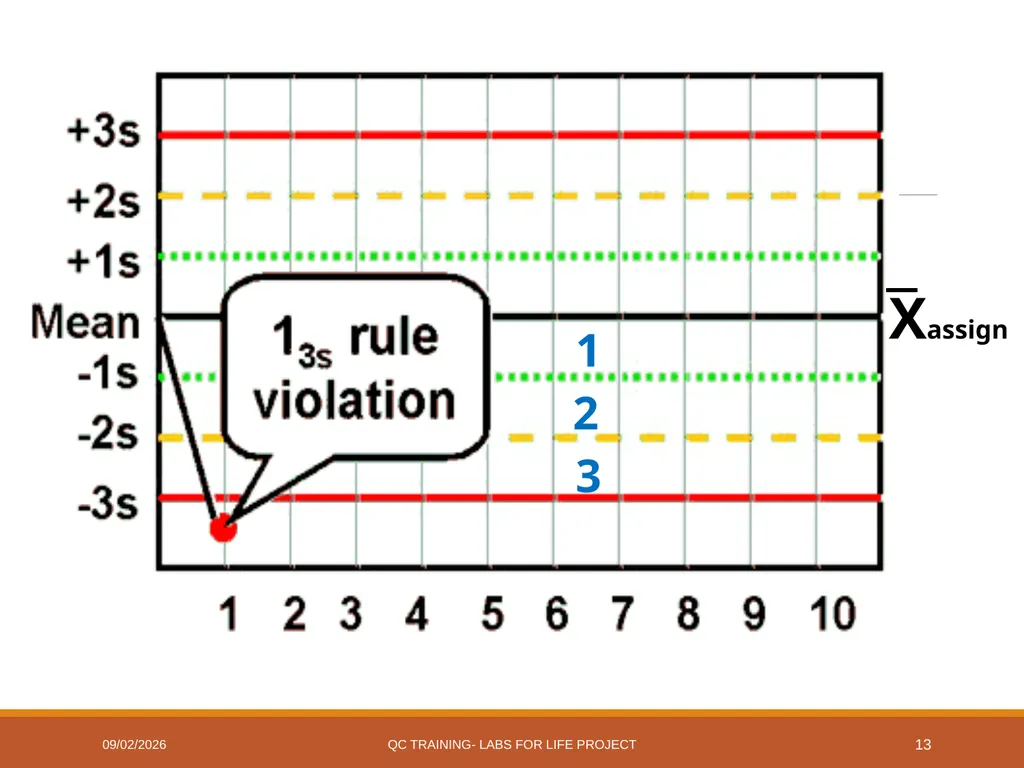
1 run, above 3 SD id 1:3 S
1:3s or 13s denotes a Random Error or a the beginning of a large Systematic Error 7/7/2017 QC Training- Labs for Life Project 12<br>
1:3s or 13s denotes a Random Error or a the beginning of a large Systematic Error 7/7/2017 QC Training- Labs for Life Project 12<br>
13
1 2 3 Xassign 7/7/2017 QC Training- Labs for Life Project 13<br>
14
1:3s or 13s 1:3s or 13s refers when the data point falls outside the set control limits of ± 3 SD
A run is rejected when a single control measurement exceeds the mean ±3SD control limit.
This rule identifies unacceptable
random error
possibly the beginning of a large systematic error. 7/7/2017 QC Training- Labs for Life Project 14<br>
A run is rejected when a single control measurement exceeds the mean ±3SD control limit.
This rule identifies unacceptable
random error
possibly the beginning of a large systematic error. 7/7/2017 QC Training- Labs for Life Project 14<br>
15
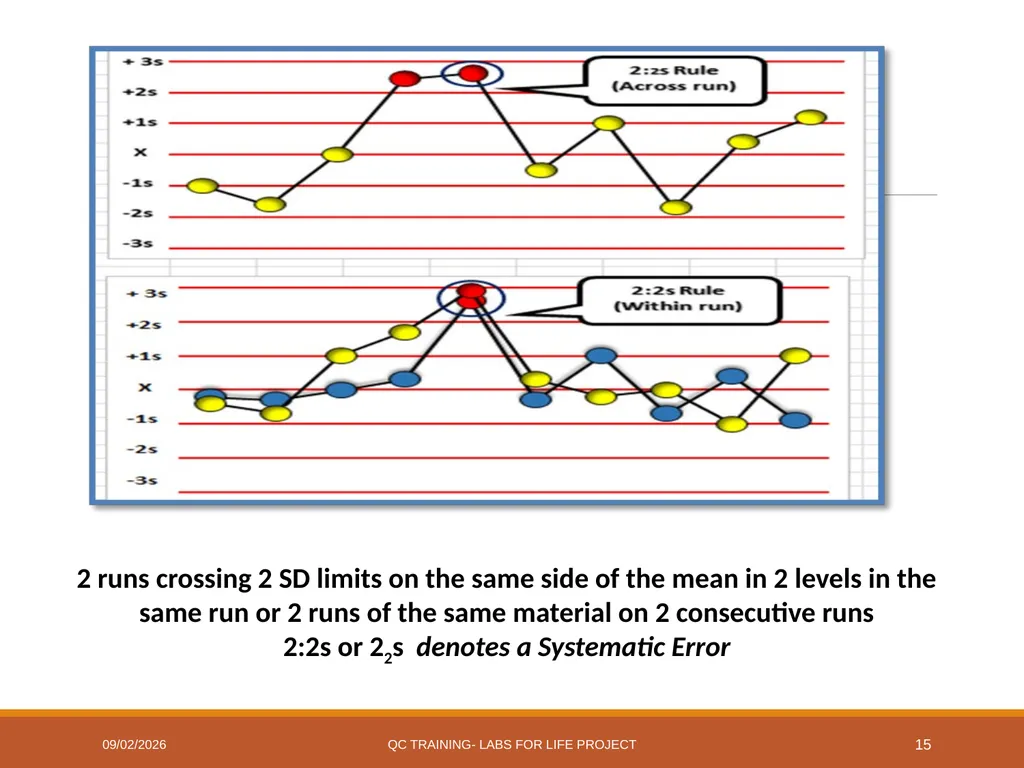
7/7/2017 QC Training- Labs for Life Project 15 2 runs crossing 2 SD limits on the same side of the mean in 2 levels in the same run or 2 runs of the same material on 2 consecutive runs
2:2s or 22s denotes a Systematic Error<br>
2:2s or 22s denotes a Systematic Error<br>
16
2:2s or 22s Two consecutive QC results greater than 2s on the same side of the mean.
This rule identifies systematic error only.
There are two applications to this rule:
within-run (in the 2 levels of QC in the same run)
across runs (In the same QC in 2 consecutive runs). 7/7/2017 QC Training- Labs for Life Project 16<br>
This rule identifies systematic error only.
There are two applications to this rule:
within-run (in the 2 levels of QC in the same run)
across runs (In the same QC in 2 consecutive runs). 7/7/2017 QC Training- Labs for Life Project 16<br>
17
Example of 2:2s if a normal (Level I) and abnormal (Level II) control are
>2s on the same side of the mean,
this run violates the within-run application for systematic error.
If however, Level I is acceptable and Level II is 1:2s, the Level II result from the previous run must be examined.
If Level II in the previous run was
at +2.0s or greater,
then the across run application for systematic error is violated. 7/7/2017 QC Training- Labs for Life Project 17<br>
>2s on the same side of the mean,
this run violates the within-run application for systematic error.
If however, Level I is acceptable and Level II is 1:2s, the Level II result from the previous run must be examined.
If Level II in the previous run was
at +2.0s or greater,
then the across run application for systematic error is violated. 7/7/2017 QC Training- Labs for Life Project 17<br>
18
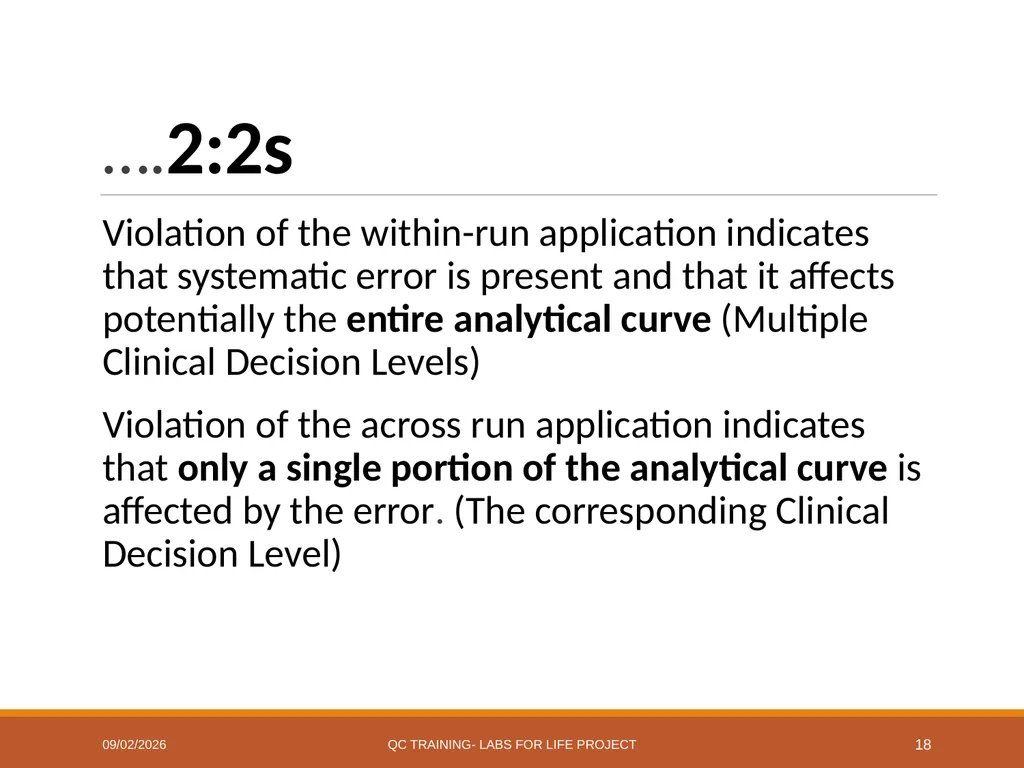
….2:2s Violation of the within-run application indicates that systematic error is present and that it affects potentially the entire analytical curve (Multiple Clinical Decision Levels)
Violation of the across run application indicates that only a single portion of the analytical curve is affected by the error. (The corresponding Clinical Decision Level) 7/7/2017 QC Training- Labs for Life Project 18<br>
Violation of the across run application indicates that only a single portion of the analytical curve is affected by the error. (The corresponding Clinical Decision Level) 7/7/2017 QC Training- Labs for Life Project 18<br>
19
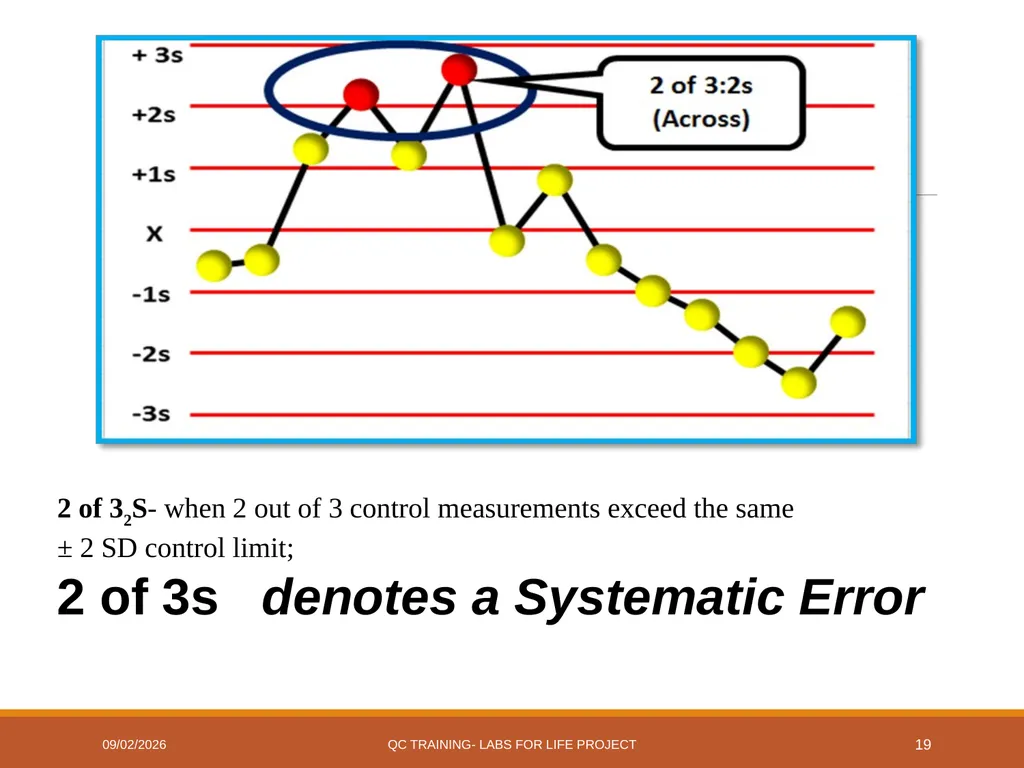
2 of 32S- when 2 out of 3 control measurements exceed the same
± 2 SD control limit;
2 of 3s denotes a Systematic Error 7/7/2017 QC Training- Labs for Life Project 19<br>
± 2 SD control limit;
2 of 3s denotes a Systematic Error 7/7/2017 QC Training- Labs for Life Project 19<br>
20
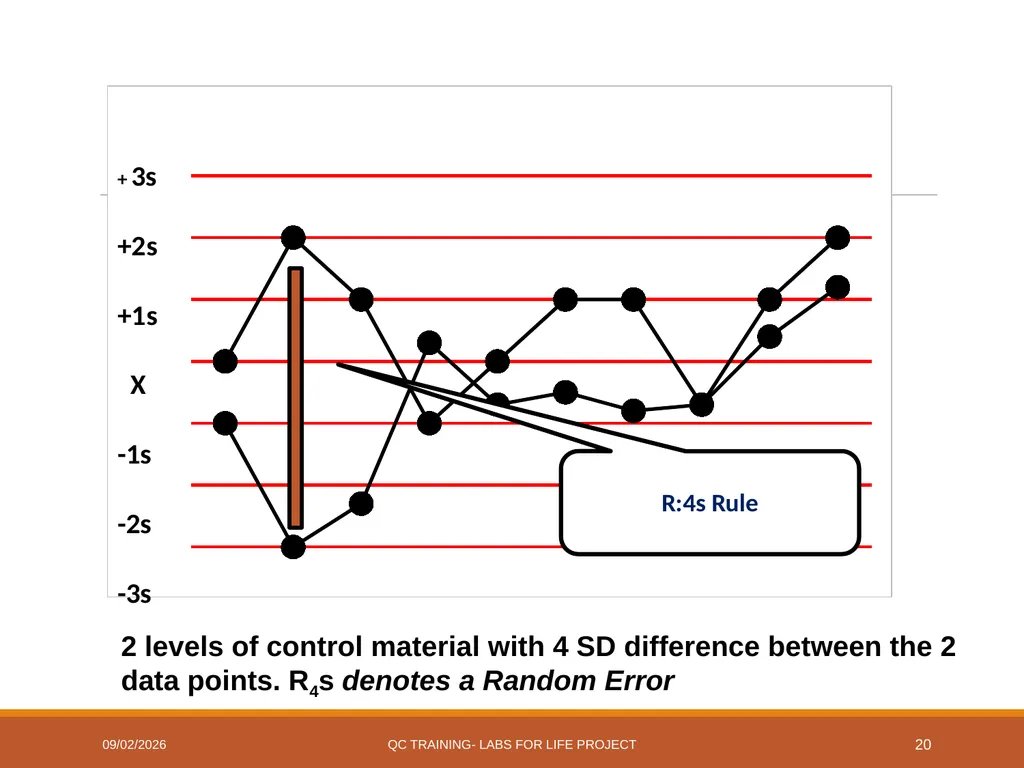
2 levels of control material with 4 SD difference between the 2 data points. R4s denotes a Random Error 7/7/2017 QC Training- Labs for Life Project 20<br>
21
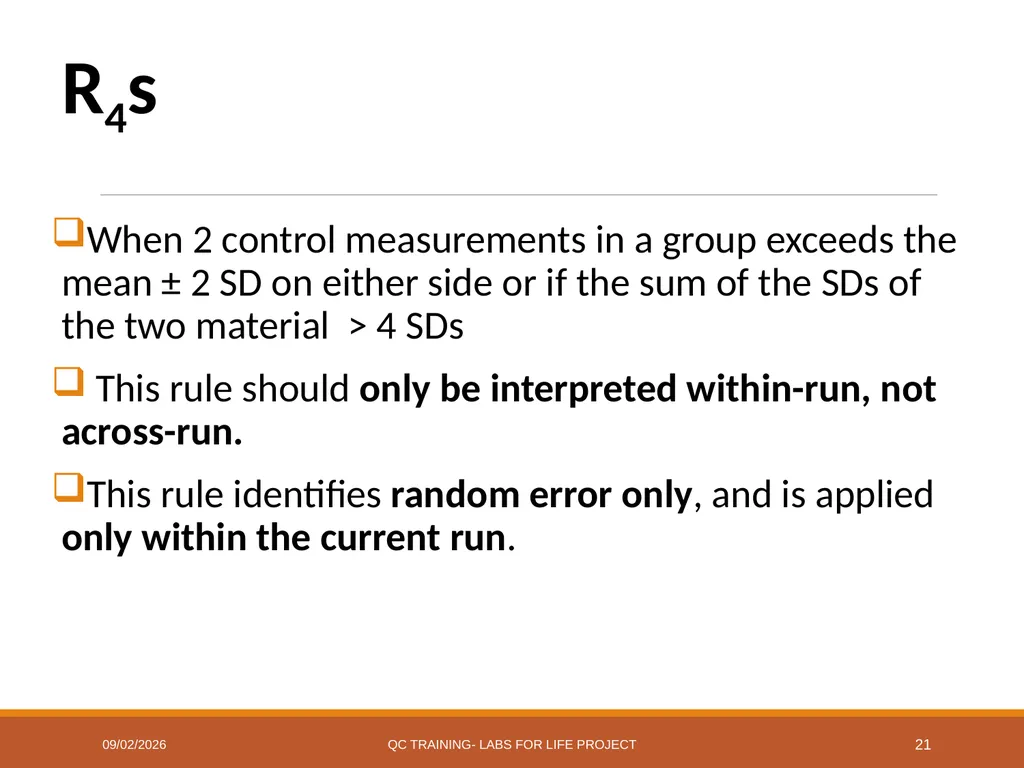
R4s When 2 control measurements in a group exceeds the mean ± 2 SD on either side or if the sum of the SDs of the two material > 4 SDs
This rule should only be interpreted within-run, not across-run.
This rule identifies random error only, and is applied only within the current run. 7/7/2017 QC Training- Labs for Life Project 21<br>
This rule should only be interpreted within-run, not across-run.
This rule identifies random error only, and is applied only within the current run. 7/7/2017 QC Training- Labs for Life Project 21<br>
22
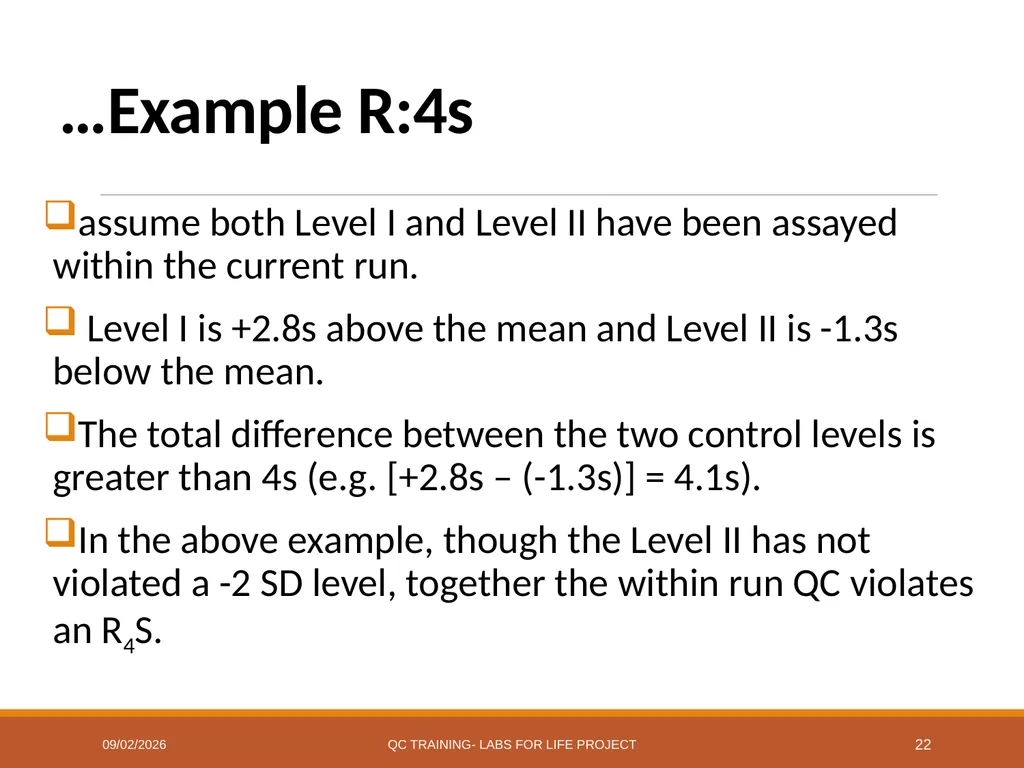
…Example R:4s assume both Level I and Level II have been assayed within the current run.
Level I is +2.8s above the mean and Level II is -1.3s below the mean.
The total difference between the two control levels is greater than 4s (e.g. [+2.8s – (-1.3s)] = 4.1s).
In the above example, though the Level II has not violated a -2 SD level, together the within run QC violates an R4S. 7/7/2017 QC Training- Labs for Life Project 22<br>
Level I is +2.8s above the mean and Level II is -1.3s below the mean.
The total difference between the two control levels is greater than 4s (e.g. [+2.8s – (-1.3s)] = 4.1s).
In the above example, though the Level II has not violated a -2 SD level, together the within run QC violates an R4S. 7/7/2017 QC Training- Labs for Life Project 22<br>
23
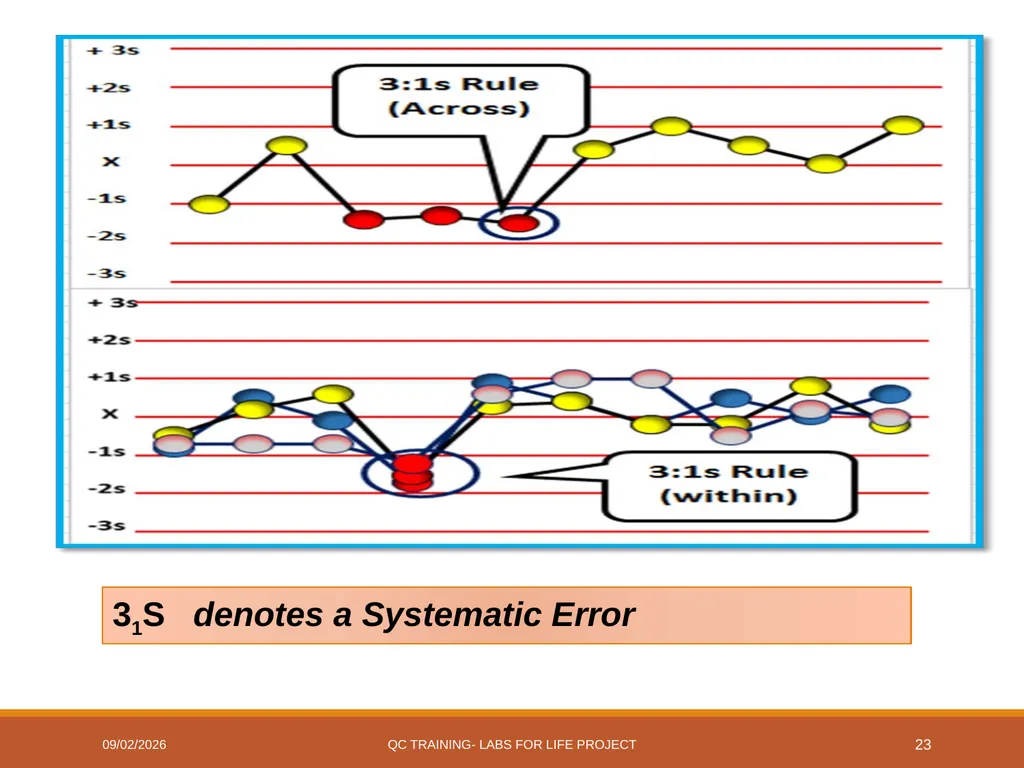
31S denotes a Systematic Error 7/7/2017 QC Training- Labs for Life Project 23<br>
24
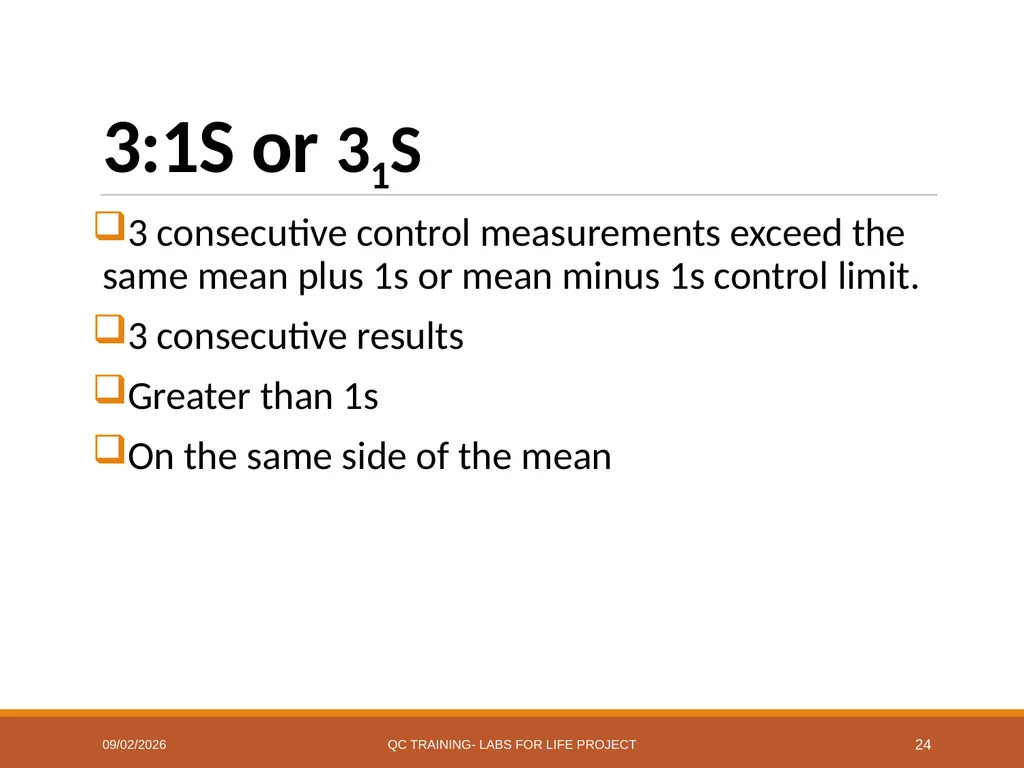
3:1S or 31S 3 consecutive control measurements exceed the same mean plus 1s or mean minus 1s control limit.
3 consecutive results
Greater than 1s
On the same side of the mean 7/7/2017 QC Training- Labs for Life Project 24<br>
3 consecutive results
Greater than 1s
On the same side of the mean 7/7/2017 QC Training- Labs for Life Project 24<br>
25
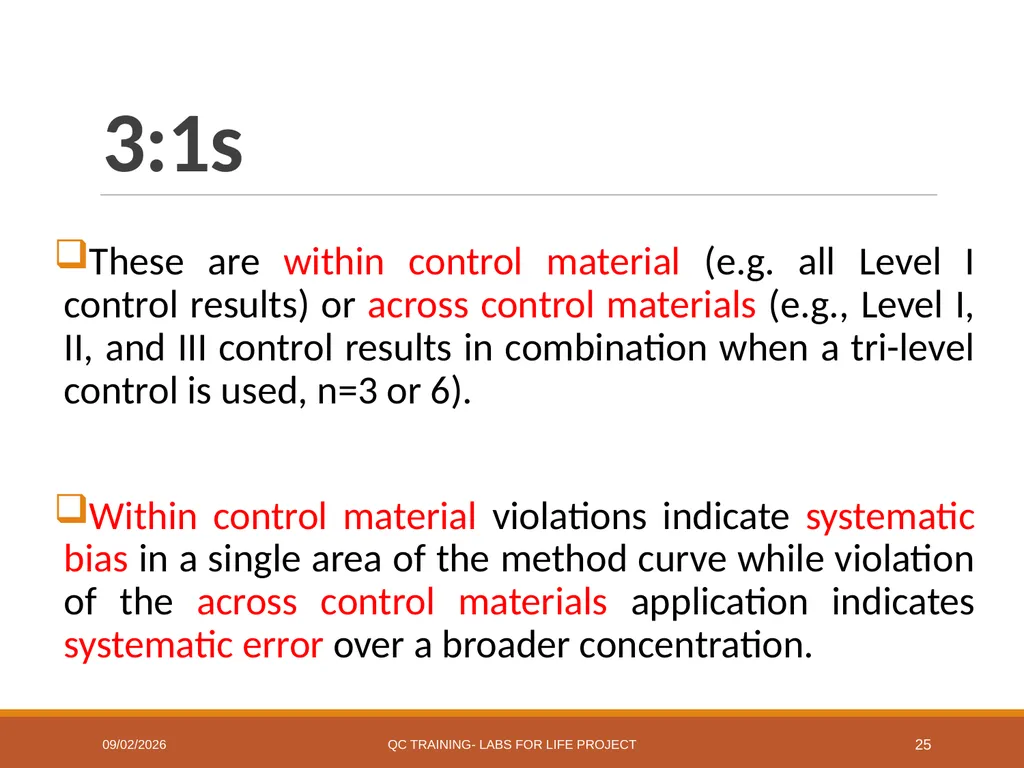
3:1s These are within control material (e.g. all Level I control results) or across control materials (e.g., Level I, II, and III control results in combination when a tri-level control is used, n=3 or 6).
Within control material violations indicate systematic bias in a single area of the method curve while violation of the across control materials application indicates systematic error over a broader concentration. 7/7/2017 QC Training- Labs for Life Project 25<br>
Within control material violations indicate systematic bias in a single area of the method curve while violation of the across control materials application indicates systematic error over a broader concentration. 7/7/2017 QC Training- Labs for Life Project 25<br>
26
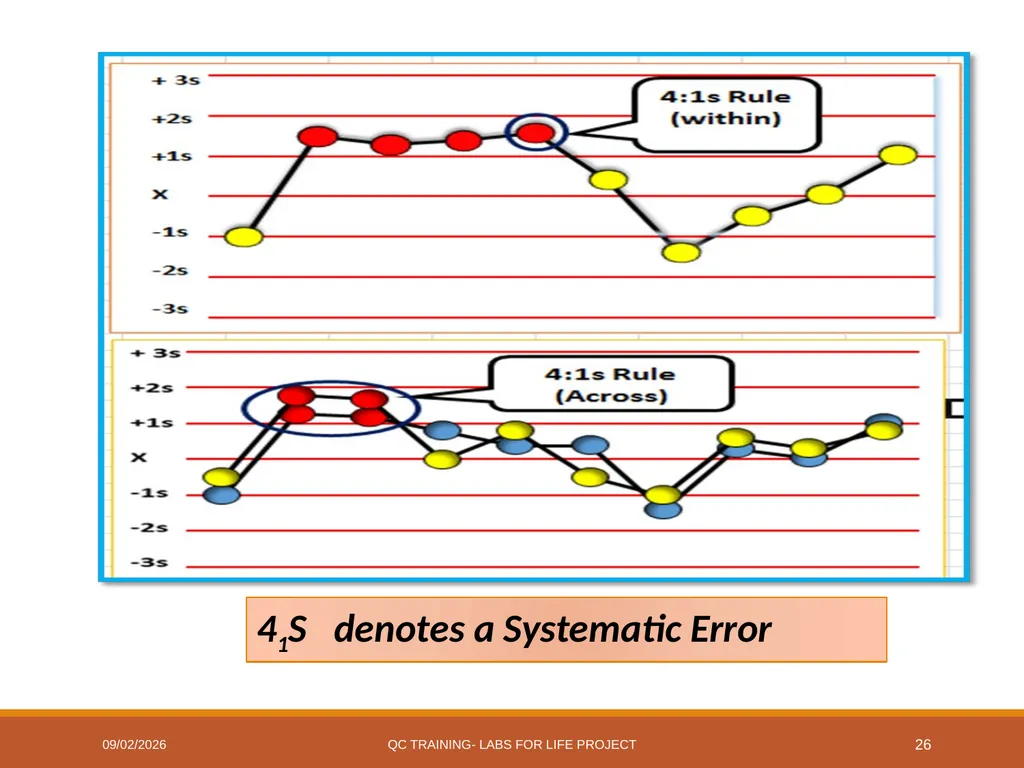
41S denotes a Systematic Error 7/7/2017 QC Training- Labs for Life Project 26<br>
27
4:1S or 41S In analytes with 2 levels of controls
When 4 consecutive control measurements exceed the same mean plus 1s or the same mean minus 1s control limit.
Four consecutive results
Greater than 1s
On the same side of the mean 7/7/2017 QC Training- Labs for Life Project 27<br>
When 4 consecutive control measurements exceed the same mean plus 1s or the same mean minus 1s control limit.
Four consecutive results
Greater than 1s
On the same side of the mean 7/7/2017 QC Training- Labs for Life Project 27<br>
28
4:1s There are two applications to the 3:1s and 4:1s rule.
These are within control material (e.g. all Level I control results) or across control materials (when n is 2 or 4).
Within control material violations indicate systematic bias in a single area of the method curve while violation of the across control materials application indicates systematic error over a broader concentration. 7/7/2017 QC Training- Labs for Life Project 28<br>
These are within control material (e.g. all Level I control results) or across control materials (when n is 2 or 4).
Within control material violations indicate systematic bias in a single area of the method curve while violation of the across control materials application indicates systematic error over a broader concentration. 7/7/2017 QC Training- Labs for Life Project 28<br>
29
6x, 8x,9x, 10x, 12x denotes Systematic Errors 7/7/2017 QC Training- Labs for Life Project 29<br>
30
6x, 8x,9x, 10x, 12x These rules are violated when there are:
6 or 8, or 9, or 10, or 12 control results on the same side of the mean regardless of the specific standard deviation in which they are located. 7/7/2017 QC Training- Labs for Life Project 30<br>
6 or 8, or 9, or 10, or 12 control results on the same side of the mean regardless of the specific standard deviation in which they are located. 7/7/2017 QC Training- Labs for Life Project 30<br>
31
6x, 8x,9x, 10x, 12x Application Each of these rules also has two applications:
Within control material (e.g., all Level I control results) or across control materials (e.g. Level I, II, and III control results in combination).
Within control material violations indicate systematic bias in a single area of the method curve while violation of the across control materials application indicates systematic bias over a broader concentration. 7/7/2017 QC Training- Labs for Life Project 31<br>
Within control material (e.g., all Level I control results) or across control materials (e.g. Level I, II, and III control results in combination).
Within control material violations indicate systematic bias in a single area of the method curve while violation of the across control materials application indicates systematic bias over a broader concentration. 7/7/2017 QC Training- Labs for Life Project 31<br>
32
7/7/2017 QC Training- Labs for Life Project 32<br>
33
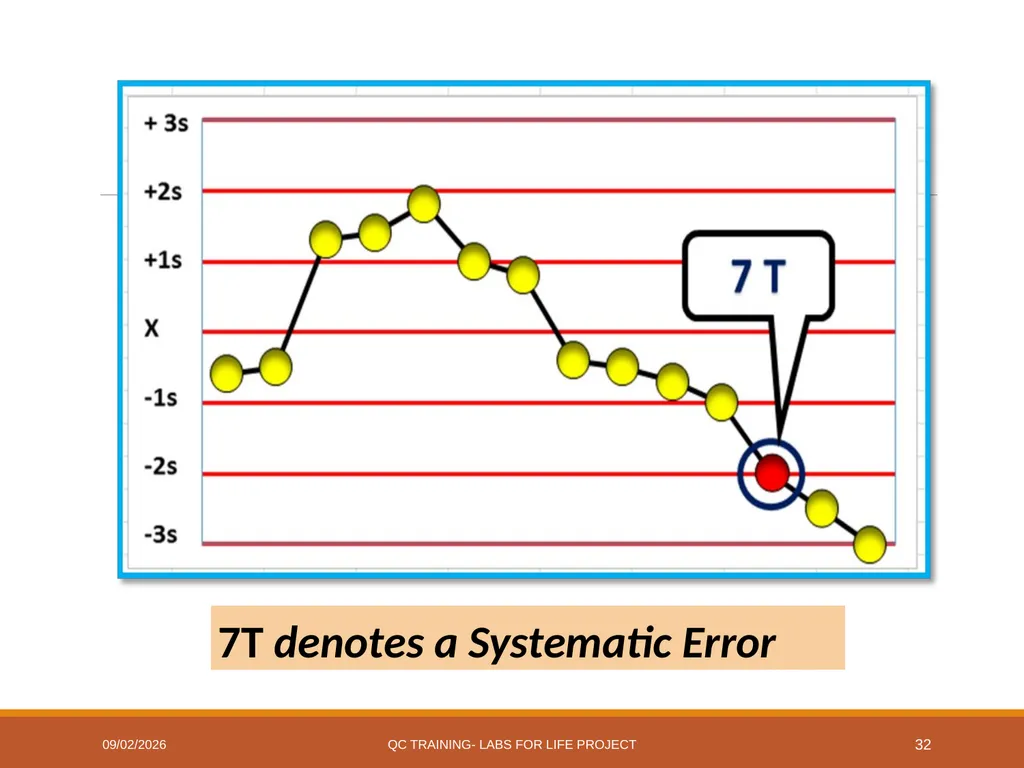
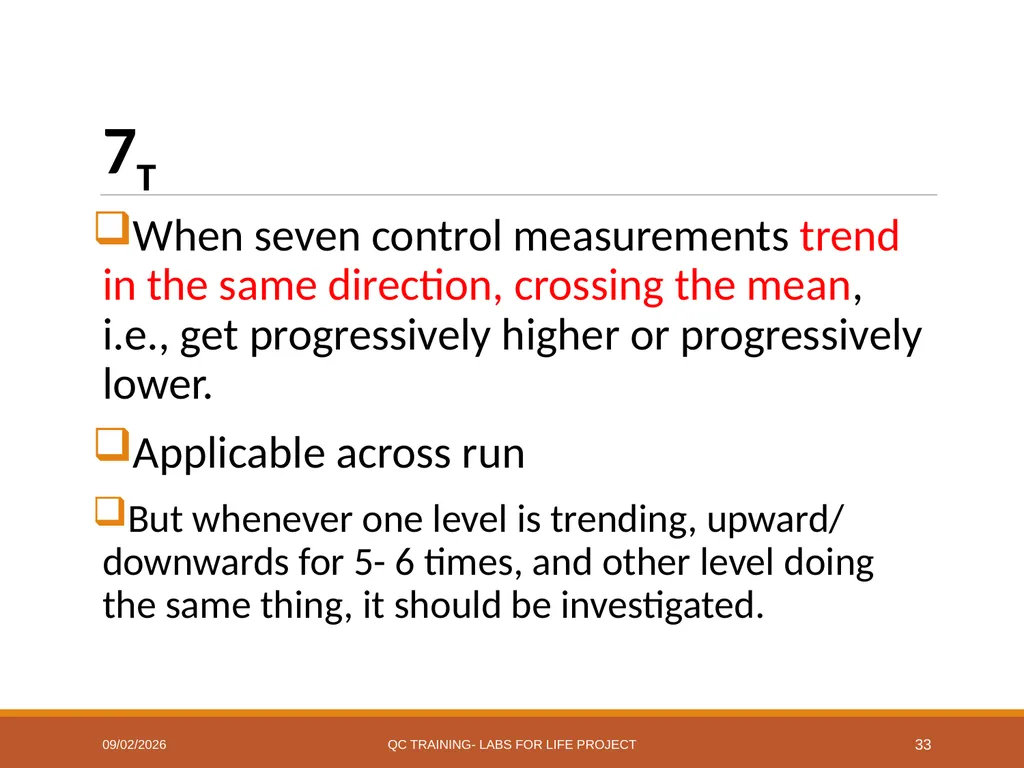
7T When seven control measurements trend in the same direction, crossing the mean, i.e., get progressively higher or progressively lower.
Applicable across run
But whenever one level is trending, upward/ downwards for 5- 6 times, and other level doing the same thing, it should be investigated. 7/7/2017 QC Training- Labs for Life Project 33<br>
Applicable across run
But whenever one level is trending, upward/ downwards for 5- 6 times, and other level doing the same thing, it should be investigated. 7/7/2017 QC Training- Labs for Life Project 33<br>
34
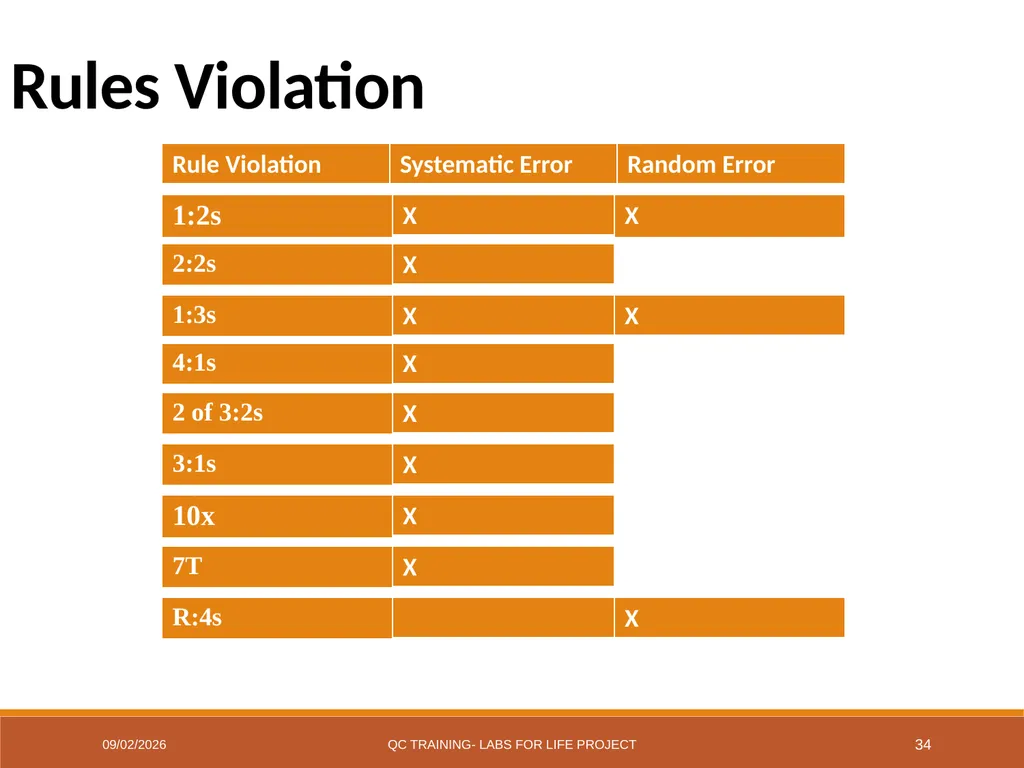
7/7/2017 QC Training- Labs for Life Project 34 Rules Violation<br>
35
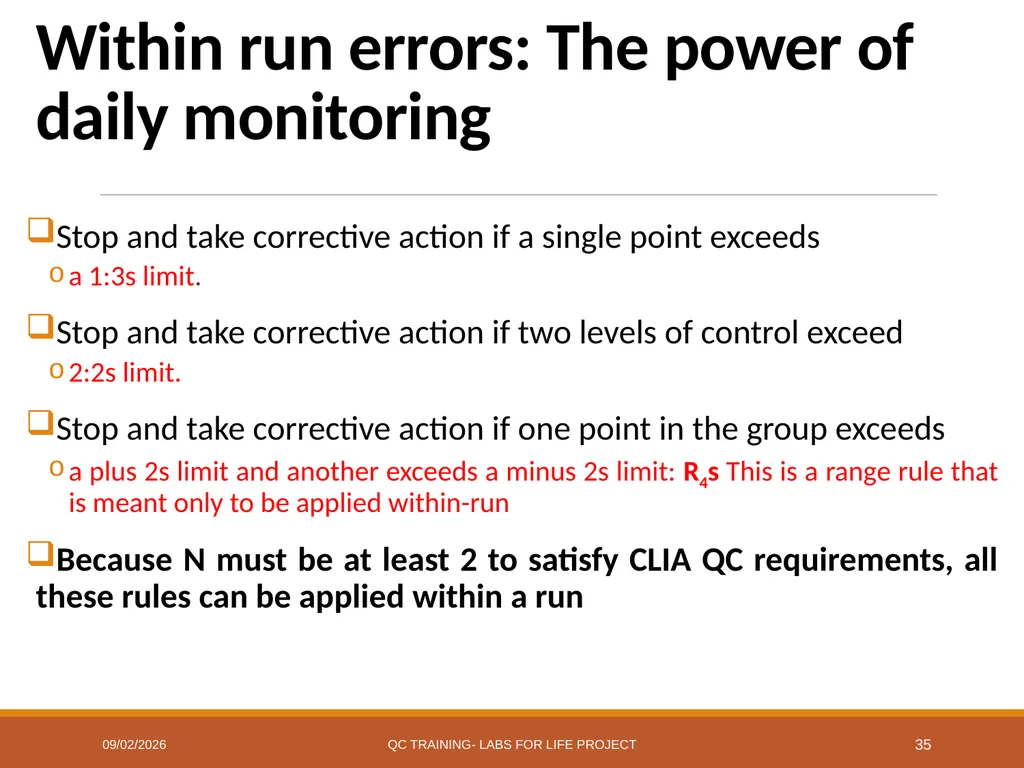
Within run errors: The power of daily monitoring Stop and take corrective action if a single point exceeds
a 1:3s limit.
Stop and take corrective action if two levels of control exceed
2:2s limit.
Stop and take corrective action if one point in the group exceeds
a plus 2s limit and another exceeds a minus 2s limit: R4s This is a range rule that is meant only to be applied within-run
Because N must be at least 2 to satisfy CLIA QC requirements, all these rules can be applied within a run 7/7/2017 QC Training- Labs for Life Project 35<br>
a 1:3s limit.
Stop and take corrective action if two levels of control exceed
2:2s limit.
Stop and take corrective action if one point in the group exceeds
a plus 2s limit and another exceeds a minus 2s limit: R4s This is a range rule that is meant only to be applied within-run
Because N must be at least 2 to satisfy CLIA QC requirements, all these rules can be applied within a run 7/7/2017 QC Training- Labs for Life Project 35<br>
36
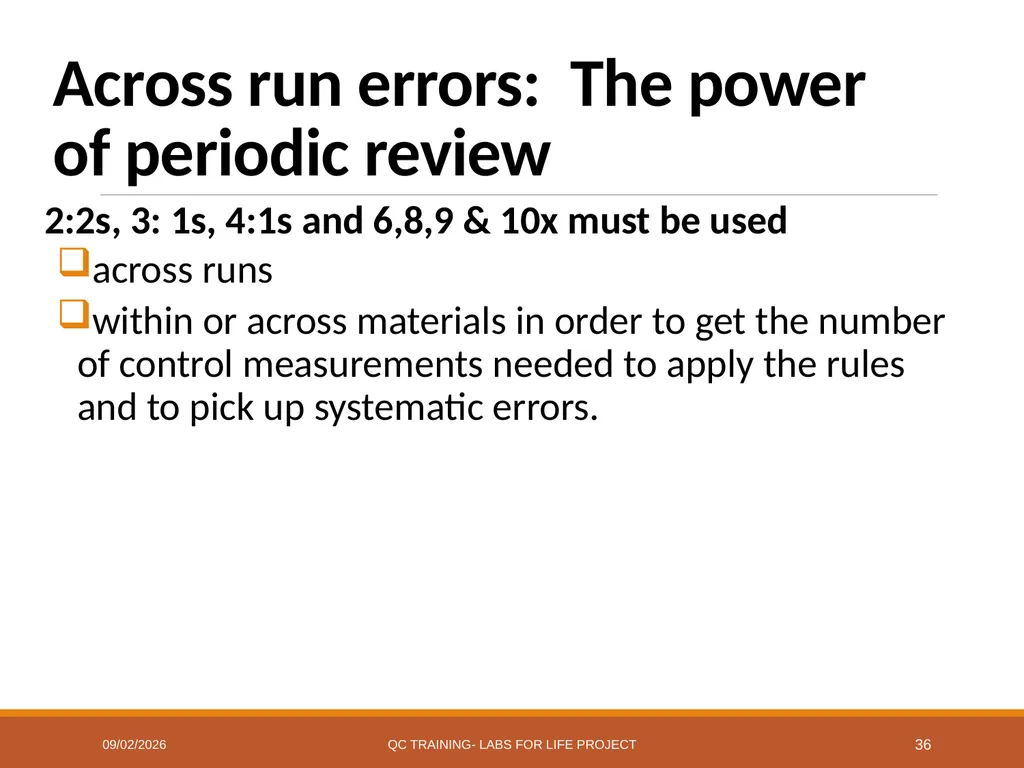
Across run errors: The power of periodic review 2:2s, 3: 1s, 4:1s and 6,8,9 & 10x must be used
across runs
within or across materials in order to get the number of control measurements needed to apply the rules and to pick up systematic errors. 7/7/2017 QC Training- Labs for Life Project 36<br>
across runs
within or across materials in order to get the number of control measurements needed to apply the rules and to pick up systematic errors. 7/7/2017 QC Training- Labs for Life Project 36<br>
37
Single rules and Multi-rules How to use these rules in your QC planning?
Single-rules or Multi-rules may be employed as necessary (to be discussed in later presentations) 7/7/2017 QC Training- Labs for Life Project 37<br>
Single-rules or Multi-rules may be employed as necessary (to be discussed in later presentations) 7/7/2017 QC Training- Labs for Life Project 37<br>
38
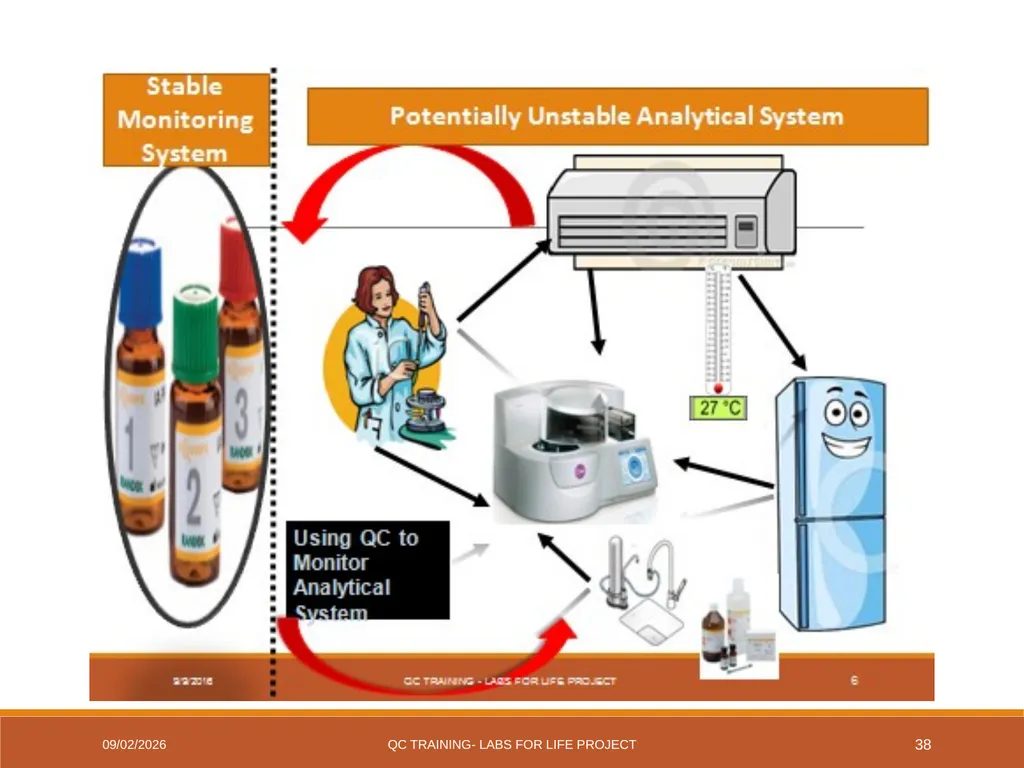
7/7/2017 QC Training- Labs for Life Project 38<br>
39
THANK YOU 7/7/2017 QC Training- Labs for Life Project 39<br>