www.carteeh.org Lecture #29: Prevalence,
Description: www.carteeh.org Lecture 29: Prevalence, Incidence, and Measures of Association Mary A. Fox, PhD, MPH Johns Hopkins Bloomberg School of Public Health Risk Sciences and Public Policy Institute mfox9jhu.edu 443-287-0778 The author declares
Related Topics
Download Presentation
"www.carteeh.org Lecture #29: Prevalence," is the property of its rightful owner. Permission is granted to download and print the materials on this website for personal, non-commercial use only, and to display it on your personal computer provided you do not modify the materials and that you retain all copyright notices contained in the materials. By downloading content from our website, you accept the terms of this agreement.
Presentation Transcript
slide1. www.carteeh.org<br>
slide2. Lecture #29: Prevalence, Incidence, and Measures of Association Mary A. Fox, PhD, MPH
Johns Hopkins Bloomberg School of Public Health
Risk Sciences and Public Policy Institute
mfox9@jhu.edu / 443-287-0778
The author declares that there is no conflict of interest
Lecture Track: HT<br>
slide3. The practice of public health is organized by:
Three core functions in a cycle of adaptive management
Assessment
Policy and program development
Assurance (implementation and evaluation)
This session focuses on the data and metrics used for assessments Introduction<br>
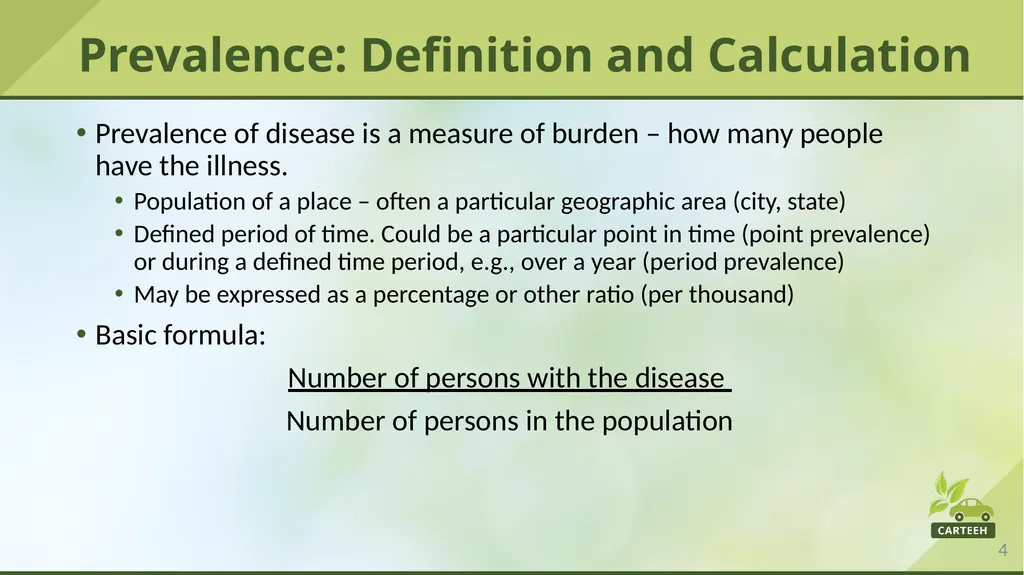
slide4. Prevalence of disease is a measure of burden – how many people have the illness.
Population of a place – often a particular geographic area (city, state)
Defined period of time. Could be a particular point in time (point prevalence) or during a defined time period, e.g., over a year (period prevalence)
May be expressed as a percentage or other ratio (per thousand)
Basic formula:
Number of persons with the disease
Number of persons in the population Prevalence: Definition and Calculation<br>
slide5. Prevalence data are typically available from routine surveillance systems and surveys collected by health agencies at the local, state or national levels.
For example the US CDC collects and provides asthma prevalence data
https://www.cdc.gov/asthma/asthmadata.htm
Example from Shikowski et al. 2014
In the European Community Respiratory Health Survey cohort COPD prevalence was 3.4% Prevalence: Data and Examples<br>
slide6. Incidence of disease is the number of new cases of disease
Defined place – often a particular geographic area (city, state)
Population at risk
Defined period of time
May be expressed as a percentage or other ratio (per thousand)
Basic formula:
Number of new cases of disease in a population over defined time
Number of persons at risk in the population during that time Incidence: Definition and Calculation<br>
slide7. Incidence data are typically available from routine surveillance systems and surveys collected by health agencies at the local, state or national levels.
Incidence data for cancer are gathered and disseminated by cancer registries
Example from Shikowski et al. 2014
In the European Community Respiratory Health Survey COPD incidence was 3.4% Incidence: Data and Examples<br>
slide8. Relative risk (RR)
Odds ratio (OR)
Attributable risk (AR) Measures of Association and Risk<br>
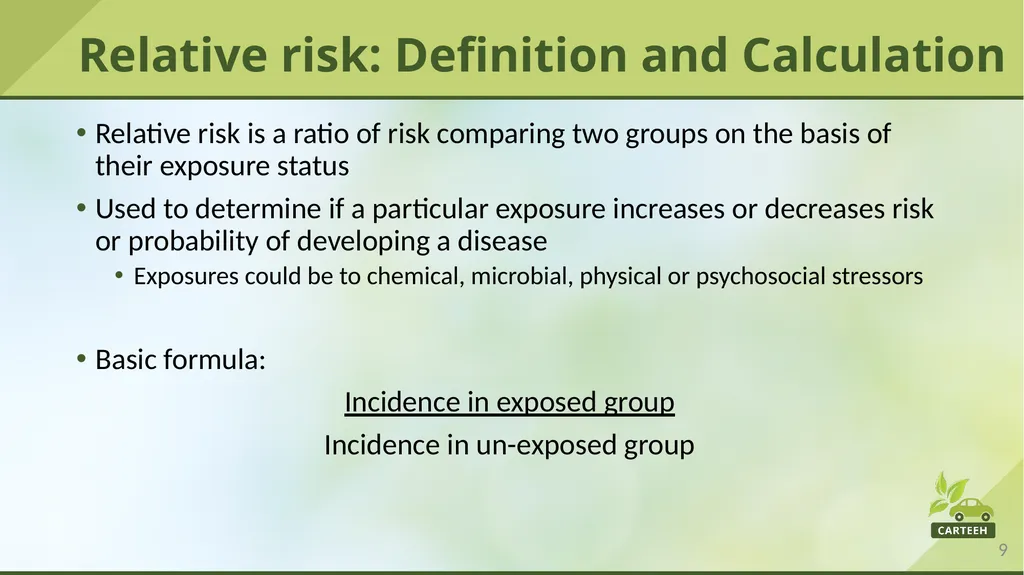
slide9. Relative risk is a ratio of risk comparing two groups on the basis of their exposure status
Used to determine if a particular exposure increases or decreases risk or probability of developing a disease
Exposures could be to chemical, microbial, physical or psychosocial stressors
Basic formula:
Incidence in exposed group
Incidence in un-exposed group Relative risk: Definition and Calculation<br>
slide10. Relative risk can be calculated from cohort study data
Cohort studies follow groups of people defined by exposure status over time to see whether disease develops (or not)
Example from Rajagopalan et al 2018
Short-term increases in exposure to PM2.5 increase the relative risk of cardiovascular mortality by 1% to 3% Relative risk: Data and Examples<br>
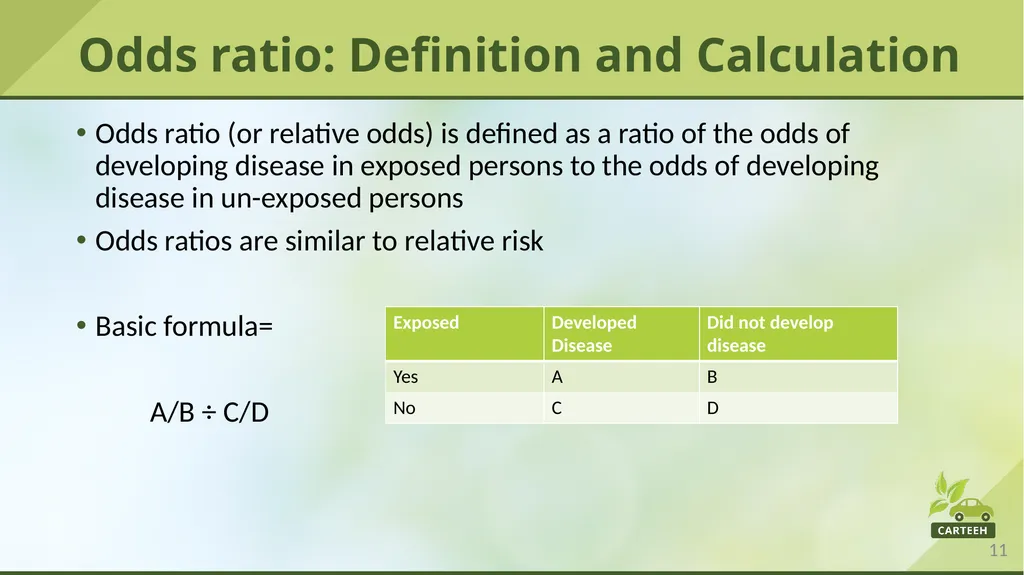
slide11. Odds ratio (or relative odds) is defined as a ratio of the odds of developing disease in exposed persons to the odds of developing disease in un-exposed persons
Odds ratios are similar to relative risk
Basic formula=
A/B ÷ C/D Odds ratio: Definition and Calculation<br>
slide12. Odds ratios are calculated from case-control studies
A case-control study starts by identifying those with and without disease absent other knowledge of the incidence of disease in the underlying population. Then exposures are assessed in both cases and controls to examine potential association with disease.
Example from Lee et al. 2014
All studies in this review that assessed the association of carbon monoxide (CO) exposure and allergic diseases reported odds ratios greater than 1, indicating increased risk with exposure Odds ratio: Data and Examples<br>
slide13. Attributable risk is a measure of how much of the disease risk is due to a certain exposure, after accounting for the background risk of disease (in unexposed people).
Attributable risk is determined by subtracting the risk of disease in the unexposed group from risk in the exposed group Attributable risk: Definition<br>
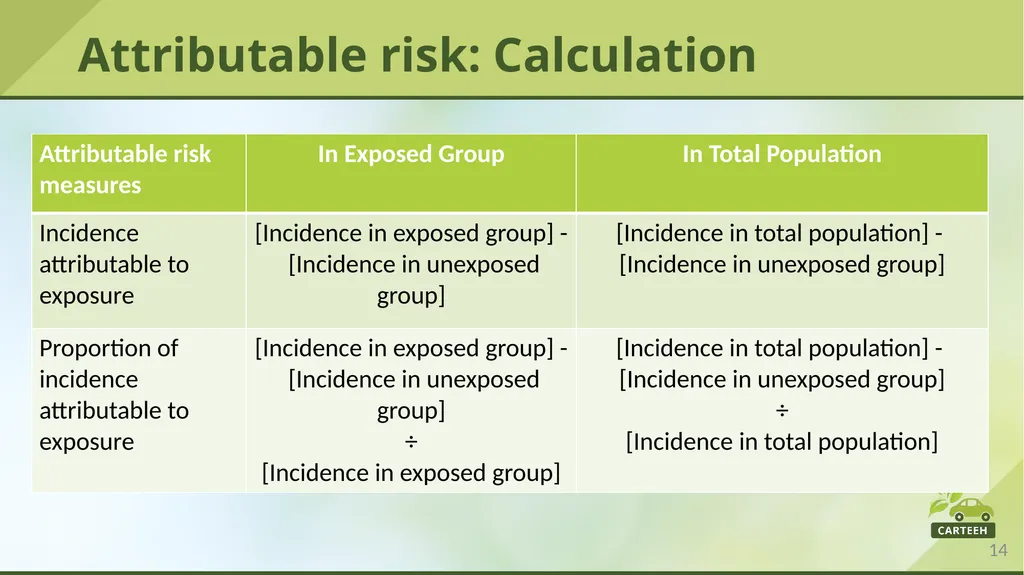
slide14. Attributable risk: Calculation<br>
slide15. Attributable risk data are developed from a combination of health risk research and population health statistics.
Example:
“Air pollution, both outdoor and household burning of solid fuels, was the fifth leading risk factor for mortality following diet, high blood pressure, tobacco and high fasting blood glucose, contributing to 4.9 million deaths worldwide, or 8.7% of global mortality in 2017.” (Boogaard et al. 2019, pg. 418) Attributable risk: Data and Examples<br>
slide16. The practice of public health includes assessing population health status and burden of disease, research on causes and contributors to disease risk, and the development and implementation of interventions to reduce risks to health.
This lecture covered the most common measures of disease risk and burden used in public health.
Examples provided in this lecture were drawn from the literature on air pollution exposure and chronic diseases but the measures described are used in all aspects of public health and can be applied to any health topic such as injury, infectious disease, etc. Discussion<br>
slide17. Measures of prevalence, incidence and risk are foundational tools in public health research.
These measures continue to be applied in new areas of public health concern, for example, in recent years attribution science has been important to raise awareness of ongoing health impacts of the changing climate. See Ebi et al. 2017. Research Gaps and Future Directions<br>
slide18. The practice of public health includes assessing population health status, research on causes and contributors to disease risk, and the development and implementation of interventions to reduce risks and improve health.
Assessments of population health status include both prevalence of disease (all cases) as well as incidence of disease (new cases)
Studies to identify risk factors and causes of disease often report relative risk or odds ratios
Defining how much of the burden of disease is due to a particular cause is done using measures of attributable risk Take-Home Messages<br>
slide19. AR: attributable risk
CDC: Centers for Disease Control and Prevention
CO: carbon monoxide
COPD: chronic obstructive pulmonary disease
OR: odds ration
PM: particulate matter
RR: relative risk List of Abbreviations<br>
slide20. Boogaard, H., Walker, K., Cohen, A.J., 2019. Air pollution: the emergence of a major global health risk factor. International Health, 11, pp. 417-421. doi:10.1093/inthealth/ihz078.
Ebi, K.L., Ogden, N.H., Semenza, J.C., Woodward, A., 2017. Detecting and Attributing Health Burdens to Climate Change. Environmental Health Perspectives. 125(8):085004. doi: 10.1289/EHP1509.
Lee, J.Y., Lee, S.B., Bae, G.N., 2014. A review of the association between air pollutant exposure and allergic diseases in children. Atmospheric Pollution Research, 5, pp. 616-629. References<br>
slide21. Rajagopalan, S., Al-Kindi, S.G., Brook, R.D., 2018. Air Pollution and Cardiovascular Disease: JACC State-of-the-Art Review. Journal of the American College of Cardiology, 72, pp. 2054-2070. doi: 10.1016/j.jacc.2018.07.099.
Schikowski ,T., Adam, M., Marcon, A., Cai, Y., Vierkötter, A., Carsin, A.E.,et al., 2014. Association of ambient air pollution with the prevalence and incidence of COPD. European Respiratory Journal, 44, pp. 614-626. doi:10.1183/09031936.00132213. References<br>
slide22. Principles of Epidemiology in Public Health Practice
https://www.cdc.gov/csels/dsepd/ss1978/lesson1/section1.html
Gordis Epidemiology, 6th Edition (Celentano and Szklo 2019) Reading List<br>
slide23. Not applicable Acknowledgements<br>

slide2. Lecture #29: Prevalence, Incidence, and Measures of Association Mary A. Fox, PhD, MPH
Johns Hopkins Bloomberg School of Public Health
Risk Sciences and Public Policy Institute
mfox9@jhu.edu / 443-287-0778
The author declares that there is no conflict of interest
Lecture Track: HT<br>
slide3. The practice of public health is organized by:
Three core functions in a cycle of adaptive management
Assessment
Policy and program development
Assurance (implementation and evaluation)
This session focuses on the data and metrics used for assessments Introduction<br>
slide4. Prevalence of disease is a measure of burden – how many people have the illness.
Population of a place – often a particular geographic area (city, state)
Defined period of time. Could be a particular point in time (point prevalence) or during a defined time period, e.g., over a year (period prevalence)
May be expressed as a percentage or other ratio (per thousand)
Basic formula:
Number of persons with the disease
Number of persons in the population Prevalence: Definition and Calculation<br>
slide5. Prevalence data are typically available from routine surveillance systems and surveys collected by health agencies at the local, state or national levels.
For example the US CDC collects and provides asthma prevalence data
https://www.cdc.gov/asthma/asthmadata.htm
Example from Shikowski et al. 2014
In the European Community Respiratory Health Survey cohort COPD prevalence was 3.4% Prevalence: Data and Examples<br>
slide6. Incidence of disease is the number of new cases of disease
Defined place – often a particular geographic area (city, state)
Population at risk
Defined period of time
May be expressed as a percentage or other ratio (per thousand)
Basic formula:
Number of new cases of disease in a population over defined time
Number of persons at risk in the population during that time Incidence: Definition and Calculation<br>
slide7. Incidence data are typically available from routine surveillance systems and surveys collected by health agencies at the local, state or national levels.
Incidence data for cancer are gathered and disseminated by cancer registries
Example from Shikowski et al. 2014
In the European Community Respiratory Health Survey COPD incidence was 3.4% Incidence: Data and Examples<br>
slide8. Relative risk (RR)
Odds ratio (OR)
Attributable risk (AR) Measures of Association and Risk<br>
slide9. Relative risk is a ratio of risk comparing two groups on the basis of their exposure status
Used to determine if a particular exposure increases or decreases risk or probability of developing a disease
Exposures could be to chemical, microbial, physical or psychosocial stressors
Basic formula:
Incidence in exposed group
Incidence in un-exposed group Relative risk: Definition and Calculation<br>
slide10. Relative risk can be calculated from cohort study data
Cohort studies follow groups of people defined by exposure status over time to see whether disease develops (or not)
Example from Rajagopalan et al 2018
Short-term increases in exposure to PM2.5 increase the relative risk of cardiovascular mortality by 1% to 3% Relative risk: Data and Examples<br>
slide11. Odds ratio (or relative odds) is defined as a ratio of the odds of developing disease in exposed persons to the odds of developing disease in un-exposed persons
Odds ratios are similar to relative risk
Basic formula=
A/B ÷ C/D Odds ratio: Definition and Calculation<br>
slide12. Odds ratios are calculated from case-control studies
A case-control study starts by identifying those with and without disease absent other knowledge of the incidence of disease in the underlying population. Then exposures are assessed in both cases and controls to examine potential association with disease.
Example from Lee et al. 2014
All studies in this review that assessed the association of carbon monoxide (CO) exposure and allergic diseases reported odds ratios greater than 1, indicating increased risk with exposure Odds ratio: Data and Examples<br>
slide13. Attributable risk is a measure of how much of the disease risk is due to a certain exposure, after accounting for the background risk of disease (in unexposed people).
Attributable risk is determined by subtracting the risk of disease in the unexposed group from risk in the exposed group Attributable risk: Definition<br>
slide14. Attributable risk: Calculation<br>
slide15. Attributable risk data are developed from a combination of health risk research and population health statistics.
Example:
“Air pollution, both outdoor and household burning of solid fuels, was the fifth leading risk factor for mortality following diet, high blood pressure, tobacco and high fasting blood glucose, contributing to 4.9 million deaths worldwide, or 8.7% of global mortality in 2017.” (Boogaard et al. 2019, pg. 418) Attributable risk: Data and Examples<br>
slide16. The practice of public health includes assessing population health status and burden of disease, research on causes and contributors to disease risk, and the development and implementation of interventions to reduce risks to health.
This lecture covered the most common measures of disease risk and burden used in public health.
Examples provided in this lecture were drawn from the literature on air pollution exposure and chronic diseases but the measures described are used in all aspects of public health and can be applied to any health topic such as injury, infectious disease, etc. Discussion<br>
slide17. Measures of prevalence, incidence and risk are foundational tools in public health research.
These measures continue to be applied in new areas of public health concern, for example, in recent years attribution science has been important to raise awareness of ongoing health impacts of the changing climate. See Ebi et al. 2017. Research Gaps and Future Directions<br>
slide18. The practice of public health includes assessing population health status, research on causes and contributors to disease risk, and the development and implementation of interventions to reduce risks and improve health.
Assessments of population health status include both prevalence of disease (all cases) as well as incidence of disease (new cases)
Studies to identify risk factors and causes of disease often report relative risk or odds ratios
Defining how much of the burden of disease is due to a particular cause is done using measures of attributable risk Take-Home Messages<br>
slide19. AR: attributable risk
CDC: Centers for Disease Control and Prevention
CO: carbon monoxide
COPD: chronic obstructive pulmonary disease
OR: odds ration
PM: particulate matter
RR: relative risk List of Abbreviations<br>
slide20. Boogaard, H., Walker, K., Cohen, A.J., 2019. Air pollution: the emergence of a major global health risk factor. International Health, 11, pp. 417-421. doi:10.1093/inthealth/ihz078.
Ebi, K.L., Ogden, N.H., Semenza, J.C., Woodward, A., 2017. Detecting and Attributing Health Burdens to Climate Change. Environmental Health Perspectives. 125(8):085004. doi: 10.1289/EHP1509.
Lee, J.Y., Lee, S.B., Bae, G.N., 2014. A review of the association between air pollutant exposure and allergic diseases in children. Atmospheric Pollution Research, 5, pp. 616-629. References<br>
slide21. Rajagopalan, S., Al-Kindi, S.G., Brook, R.D., 2018. Air Pollution and Cardiovascular Disease: JACC State-of-the-Art Review. Journal of the American College of Cardiology, 72, pp. 2054-2070. doi: 10.1016/j.jacc.2018.07.099.
Schikowski ,T., Adam, M., Marcon, A., Cai, Y., Vierkötter, A., Carsin, A.E.,et al., 2014. Association of ambient air pollution with the prevalence and incidence of COPD. European Respiratory Journal, 44, pp. 614-626. doi:10.1183/09031936.00132213. References<br>
slide22. Principles of Epidemiology in Public Health Practice
https://www.cdc.gov/csels/dsepd/ss1978/lesson1/section1.html
Gordis Epidemiology, 6th Edition (Celentano and Szklo 2019) Reading List<br>
slide23. Not applicable Acknowledgements<br>