/
Quantifying progression and regression across the spectrum of pulmonary tuberculosis: Quantifying progression and regression across the spectrum of pulmonary tuberculosis:

Quantifying progression and regression across the spectrum of pulmonary tuberculosis: - PowerPoint Presentation

wang
wang . @wang
Follow
27 views
Uploaded On 2024-02-09

Quantifying progression and regression across the spectrum of pulmonary tuberculosis: - PPT Presentation

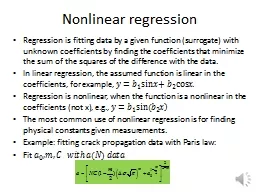
Alexandra Richards Introduction Background on TB modelling Systematic Review Model fitting Implications 1 Background on TB modelling Systematic Review Model fitting Implications 2 Background ID: 1045323

disease tuberculosis infectious clinical tuberculosis disease clinical infectious subclinical progression natural history individuals model review pulmonary modellingsystematic infection reviewmodel

Share:

Link:

Embed:

Download Presentation from below link

Download Presentation The PPT/PDF document "Quantifying progression and regression a..." is the property of its rightful owner. Permission is granted to download and print the materials on this web site for personal, non-commercial use only, and to display it on your personal computer provided you do not modify the materials and that you retain all copyright notices contained in the materials. By downloading content from our website, you accept the terms of this agreement.


Presentation Transcript

1. Quantifying progression and regression across the spectrum of pulmonary tuberculosis: a data synthesis studyAlexandra Richards

2. IntroductionBackground on TB modellingSystematic ReviewModel fittingImplications1

3. Background on TB modellingSystematic ReviewModel fittingImplications2

4. BackgroundTB models 1995Waaler HT. A Dynamic Model for the Epidemiology of Tuberculosis. Am Rev Respir Dis. 1968 Oct;98(4):591–600.Blower SM, Small PM, Hopewell PC. Control Strategies for Tuberculosis Epidemics: New Models for Old Problems. Science. 1996 Jul 26;273(5274):497–500.Menzies NA, et al. Prospects for Tuberculosis Elimination in the United States: Results of a Transmission Dynamic Model. Am J Epidemiol. 2018 Sep;187(9):2011–20.196820183

5. BackgroundTB natural history1977Drain PK, et al. Incipient and Subclinical Tuberculosis: a Clinical Review of Early Stages and Progression of Infection. Clinical Microbiology Reviews. 2018;31(4):24.Barry CE, et al. The spectrum of latent tuberculosis: rethinking the biology and intervention strategies. Nat Rev Microbiol. 2009 Dec;7(12):845–55.Gothi GD. Natural History of Tuberculosis. Indian Journal of Tuberculosis. 1977;25(2).201820094

6. BackgroundPrevalence surveysOnozaki I, et al. National tuberculosis prevalence surveys in Asia, 1990-2012: an overview of results and lessons learned. Trop Med Int Health. 2015 Sep;20(9):1128–45.Frascella B, et al. Subclinical Tuberculosis Disease—A Review and Analysis of Prevalence Surveys to Inform Definitions, Burden, Associations, and Screening Methodology. Clinical Infectious Diseases. 2021 Aug 1;73(3):e830–41.5

7. DefinitionsClinical disease – infectious disease (bacteriologically positive), reports symptomsSubclinical disease – infectious disease, does not report symptomsPrevalence – proportion of infectious disease in the population (subclinical + clinical)TB disease – any progression beyond infection that can be detected through testing (e.g. x-rays), not necessarily infectious6

8. The problemWhere can we find data on symptoms and understand how disease develops?7

9. Background on TB modellingSystematic ReviewModel fittingImplications8

10. Systematic ReviewDates: 1895-1960Databases: PubMed, EMBASE, Web of Science, Index Medicus, Personal librariesRequirements: pulmonary TB in adults (> 10 years old), with bacteriological testing and no medical or surgical interventionsSossen B, et al. The natural history of untreated pulmonary tuberculosis in adults: a systematic review and meta-analysis. The Lancet Respiratory Medicine. 2023 Mar 23 0(0). 9

11. DataSystematic review22 studies for disease progression, 2 for infection progression (not used further here)1935 – 200413 observational studies, 11 controlled trials11,894 individuals with 1,527 events recordedIn disease progression studies: 5,942 individuals and 1034 eventsOther sources- Mortality rate from clinical disease (0.39)- Ratio of subclinical to clinical disease (1:1)- Ratio of minimal to infectious disease (2.5:1)Sossen B, et al. The natural history of untreated pulmonary tuberculosis in adults: a systematic review and meta-analysis. The Lancet Respiratory Medicine. 2023 Mar 23 0(0). Tiemersma EW, et al.. Natural history of tuberculosis: duration and fatality of untreated pulmonary tuberculosis in HIV negative patients: a systematic review. PLoS ONE. 2011 Apr 4;6(4):e17601.Ragonnet R, et al. Revisiting the Natural History of Pulmonary Tuberculosis: A Bayesian Estimation of Natural Recovery and Mortality Rates. Clinical Infectious Diseases. 2021 Jul 1;73(1):e88–96.Frascella B, et al. Subclinical Tuberculosis Disease—A Review and Analysis of Prevalence Surveys to Inform Definitions, Burden, Associations, and Screening Methodology. Clinical Infectious Diseases. 2021 Aug 1;73(3):e830–41.Onozaki I, et al. National tuberculosis prevalence surveys in Asia, 1990-2012: an overview of results and lessons learned. Trop Med Int Health. 2015 Sep;20(9):1128–45.Mungai BN, et al. ‘If not TB, what could it be?’ Chest X-ray findings from the 2016 Kenya Tuberculosis Prevalence Survey. Thorax. 2021 Jun 1;76(6):607–14.10

12. Background on TB modellingSystematic ReviewModel fittingImplications11

13. Model structureMinimal:individuals with pathological changes in their lungs, due to M.tb with all bacteriologic tests negative (likely not infectious) Subclinical:individuals with positive bacteriologic tests (likely infectious) but nt reporting symptoms, also likely to have pathological changes in their lungs Clinical:individuals with with positive bacteriologic tests (likely infectious) and exhibiting symptoms of TB, also likely to have pathological changes in their lungs 12

14. Data assumptions13Minimal diseaseSubclinical diseaseClinical diseaseNational Tuberculosis Association. Diagnostic standards and classification of tuberculosis. [Internet]. 1940 ed. New York, N.Y.,; 1940.

15. TB Disease Model - Fitting ProcessCumulative – count everyone who has ever reached the state of interestSingle – count everyone in the state of interest at a particular time14

16. Model Priors15

17. Parameter fitting16

18. Results17

19. Background on TB modellingSystematic ReviewModel fittingImplications18

20. What does this mean?We have data-based parameters to inform a natural history modelCreated a model to follow individuals through diseaseThree cohorts:All subclinical disease at startAll clinical disease at startShared distribution of minimal/subclinical/clinicalFollowed for 5 years to see changes in trajectory and ultimate outcomes19

21. What does this mean?Median duration ~12 months~14% with infectious disease by 5 years50% with subclinical never developed symptoms 20

22. What does this mean?21

23. What does this mean? Where next?It is unlikely that everyone with TB will develop symptomsMinimal disease may hold a reservoir for future progressionNeed to think about appropriate treatments at different stages of diseaseNeed to find easy detection methods for non-clinical diseaseA paper extending this work to include progression from infection accepted at PNAS (available on medRxiv) Horton KC, et al. Re-evaluating progression and pathways following Mycobacteria tuberculosis infection within the spectrum of tuberculosis disease. medRxiv; 202222

24. AcknowledgementsLSHTMRein HoubenJon EmeryKatherine HortonNicky McCreeshAlison GrantSystematic ReviewHanif EsmailBianca SossenTorben HeinsohnBeatrice FrascellaFederica BalzariniAurea Orandi-AlacreuBrit HäckerEwelina RogozinskaFrank CobelensKatharina Kranzer23