PPT-Ansoff Growth Matrix
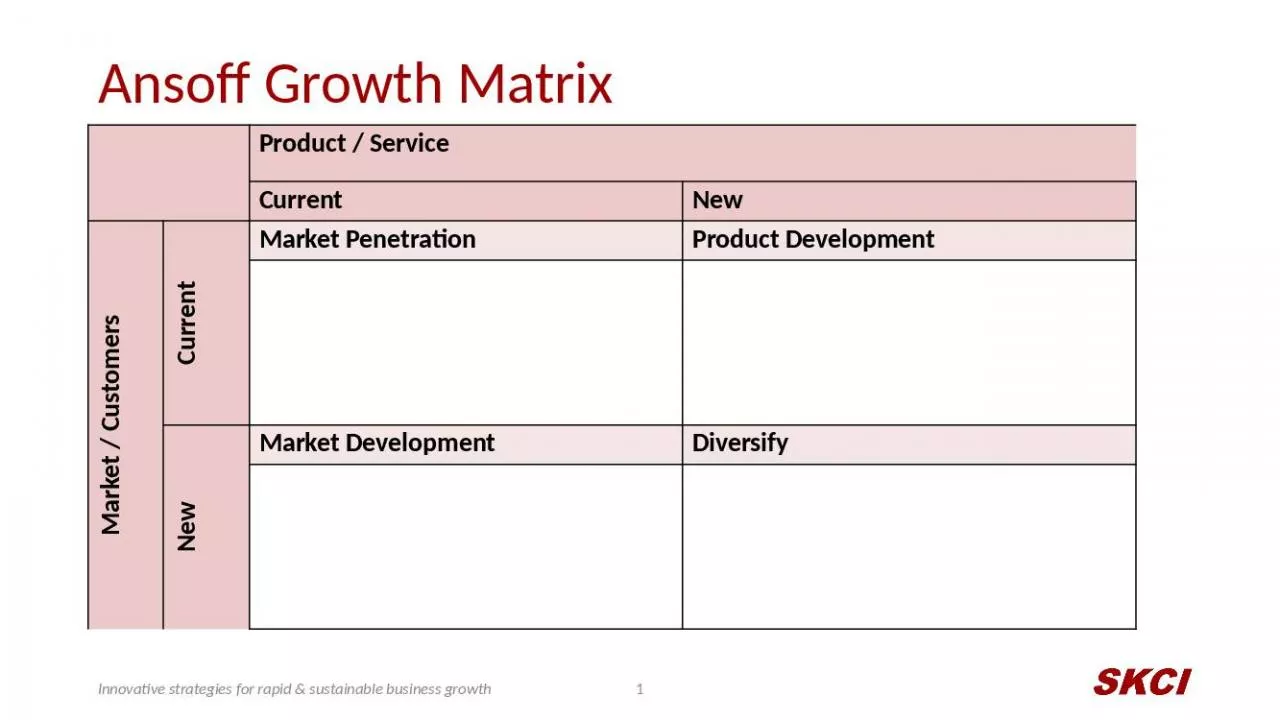
Ansoff Growth Matrix 1 Product Service Current New Market Customers Current Market Penetration Product Development New Market Development Diversify
Download Presentation
"Ansoff Growth Matrix" is the property of its rightful owner. Permission is granted to download and print materials on this website for personal, non-commercial use only, provided you retain all copyright notices. By downloading content from our website, you accept the terms of this agreement.
Presentation Transcript
Transcript not available.