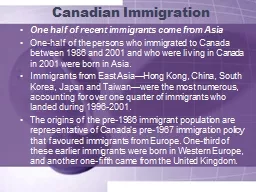
Onehalf of the persons who immigrated to Canada between 1986 and 2001 and who were living in Canada in 2001 were born in Asia Immigrants from East AsiaHong Kong China South Korea Japan and Taiwanwere the most numerous accounting for over one quarter of immigrants who landed during 1 ID: 725515
Download Presentation The PPT/PDF document "Canadian Immigration One half of recent ..." is the property of its rightful owner. Permission is granted to download and print the materials on this web site for personal, non-commercial use only, and to display it on your personal computer provided you do not modify the materials and that you retain all copyright notices contained in the materials. By downloading content from our website, you accept the terms of this agreement.
Slide1
Canadian Immigration
One half of recent immigrants come from Asia
One-half of the persons who immigrated to Canada between 1986 and 2001 and who were living in Canada in 2001 were born in Asia.
Immigrants
from East Asia—Hong Kong, China, South Korea, Japan and Taiwan—were the most numerous, accounting for over one quarter of immigrants who landed during 1996-2001.
The origins of the pre-1986 immigrant population are representative of Canada’s pre-1967 immigration policy that favoured immigrants from Europe. One-third of these earlier immigrants were born in Western Europe, and another one-fifth came from the United Kingdom. Slide2
Immigration PatternsSlide3
Asian countries of birth are predominant
Over the past several decades there has been a considerable change in the source countries of immigrants.
In
2001, for example, there were 963,000 residents who had very recently landed in Canada, between 1996 and 2001.
The
most common country of birth for these immigrants was China, accounting for 13% of these new permanent residents to Canada, and 17% including persons born in Hong Kong. The ten most common countries of birth—China, India, the Philippines, Pakistan, Hong Kong, Iran, Taiwan, the United States, South Korea and Sri Lanka—accounted for 52% of these very recent immigrants.
In
comparison, only three of these countries—the United States, India and China—were in the top ten countries of birth of immigrants who landed in Canada before 1986.
Among earlier immigrants—those arriving in Canada before 1986—the United Kingdom and Italy were the most common countries of birth, accounting for 28% of this group.Slide4
Birth Origins
In general, the birth origins of Canada’s immigrant population vary in relation to the period of immigration.
European birth origins are predominant among those who immigrated in the 1950s, 1960s and to a lesser extent in the 1970s, and Asian birth origins are predominant among those who immigrated in the 1980s and 1990s.
For very recent immigrants, nine of the top ten countries of birth are in Asia, as are six of the top ten countries of birth of immigrants who landed during the 1986-1995 period.Slide5
Period of Immigration – Table 1
Table B-1: Immigrants by period of immigration—top ten countries of birth, Canada, 2001
(
number and percentage distribution)
All
immigrants
Rank
Country
Number
Share
1
United Kingdom
606,000
11%
2
China, People’s Republic of
332,800
6%
3
Italy
315,500
6%
4
India
314,700
6%
5
United States
237,900
4%
6
Hong Kong
235,600
4%
7
Philippines
232,700
4%
8
Poland
180,400
3%
9
Germany
174,100
3%
10
Portugal
153,500
3%
Top ten countries
2,783,200
51%
All other countries
2,665,300
49%
Total
5,448,500
100%Slide6
Period of Immigration – Table 2
Immigrated before 1986
1
United Kingdom
536,300
18%
2
Italy
305,500
10%
3
United States
164,100
6%
4
Germany
151,300
5%
5
Portugal
119,400
4%
6
India
117,000
4%
7
Netherlands
108,600
4%
8
China, People’s Republic of
95,900
3%
9
Poland
89,300
3%
10
Viet Nam
76,100
3%
Top ten countries
1,763,500
60%
All other countries
1,193,100
40%
Total
2,956,600
100%Slide7
Period of Immigration – Table 3
Immigrated 1986-1995
1
Hong Kong
131,100
9%
2
China, People’s Republic of
112,000
7%
3
India
106,000
7%
4
Philippines
105,700
7%
5
Poland
82,800
5%
6
Viet Nam
61,300
4%
7
Sri Lanka
54,800
4%
8
United Kingdom
49,900
3%
9
United States
44,100
3%
10
Jamaica
36,600
2%
Top ten countries
784,300
51%
All other countries
744,200
49%
Total
1,528,500
100%Slide8
Period of Immigration – Table 4
Immigrated 1996-2001
1
China, People’s Republic of
124,900
13%
2
India
91,600
10%
3
Philippines
55,500
6%
4
Pakistan
43,100
4%
5
Hong Kong
37,700
4%
6
Iran
31,100
3%
7
Taiwan
30,300
3%
8
United States
29,700
3%
9
South Korea
29,200
3%
10
Sri Lanka
25,300
3%
Top ten countries
498,400
52%
All other countries
464,900
48%
Total
963,300
100%Slide9
Provincial Settlement Patterns
The
distribution of the immigrant population over Canada’s major regions has been rather stable over time.
Over
one-half of each of the three successive groups of immigrants (earlier immigrants, immigrants who landed during the 1986-1995 period, and 1996-2001 very recent immigrants) lives in Ontario.
The
shares of British Columbia and Quebec have increased somewhat, while other regions have seen their shares decline.Slide10
Provincial Settlement Patterns (cont’d)
Table B-2: Immigrants by period of immigration and Canadian-born—province or territory, Canada, 2001 (number and percentage distribution)
Canadian-born
Immigrants
Immigrated before 1986
Immigrated 1986-1995
Immigrated 1996-2001
British Columbia
2,821,900
1,009,800
527,900
290,500
191,400
Alberta
2,485,500
438,300
259,100
112,700
66,600
Saskatchewan
912,200
47,800
32,500
8,700
6,600
Manitoba
965,500
133,700
85,900
30,200
17,500
Ontario
8,164,900
3,030,100
1,621,600
869,700
538,700
Quebec
6,378,400
707,000
373,700
201,700
131,700
New Brunswick
695,600
22,500
16,500
3,400
2,600
Prince Edward Island
128,900
4,100
3,000
600
500
Nova Scotia
853,700
41,300
27,500
8,000
5,700
Newfoundland and Labrador
499,100
8,000
5,400
1,500
1,100
Yukon/Northwest Territory/Nunavut
86,200
5,900
3,500
1,500
800
Canada
23,991,900
5,448,500
2,956,600
1,528,500
963,300Slide11
Provincial Settlement Patterns
(cont’d)
British Columbia
11.8%
18.5%
17.9%
19.0%
19.9%
Alberta
10.4%
8.0%
8.8%
7.4%
6.9%
Saskatchewan
3.8%
0.9%
1.1%
0.6%
0.7%
Manitoba
4.0%
2.5%
2.9%
2.0%
1.8%
Ontario
34.0%
55.6%
54.8%
56.9%
55.9%
Quebec
26.6%
13.0%
12.6%
13.2%
13.7%
New Brunswick
2.9%
0.4%
0.6%
0.2%
0.3%
Prince Edward Island
0.5%
0.1%
0.1%
0.0%
0.1%
Nova Scotia
3.6%
0.8%
0.9%
0.5%
0.6%
Newfoundland and Labrador
2.1%
0.1%
0.2%
0.1%
0.1%
Yukon/Northwest Territory/Nunavut
0.4%
0.1%
0.1%
0.1%
0.1%
Canada
100%
100%
100%
100%
100%Slide12
Settlement Preferences of Immigrants
The settlement preferences of immigrants, while fairly stable over time, are very different from the choices made by persons born in Canada.
More
than one in two recent immigrants and one in three Canadian-born live in Ontario, and one in five recent immigrants and one in eight Canadian-born live in British Columbia.
Only
these two provinces have a larger share of the country’s 5.4 million immigrants than of the 24 million Canadian-born.
At
the opposite end of the spectrum are the Atlantic provinces with 10% of the Canadian-born and only 1% of recent immigrants.Slide13Slide14Slide15