PPT-PanGenome Visualization with JBrowse
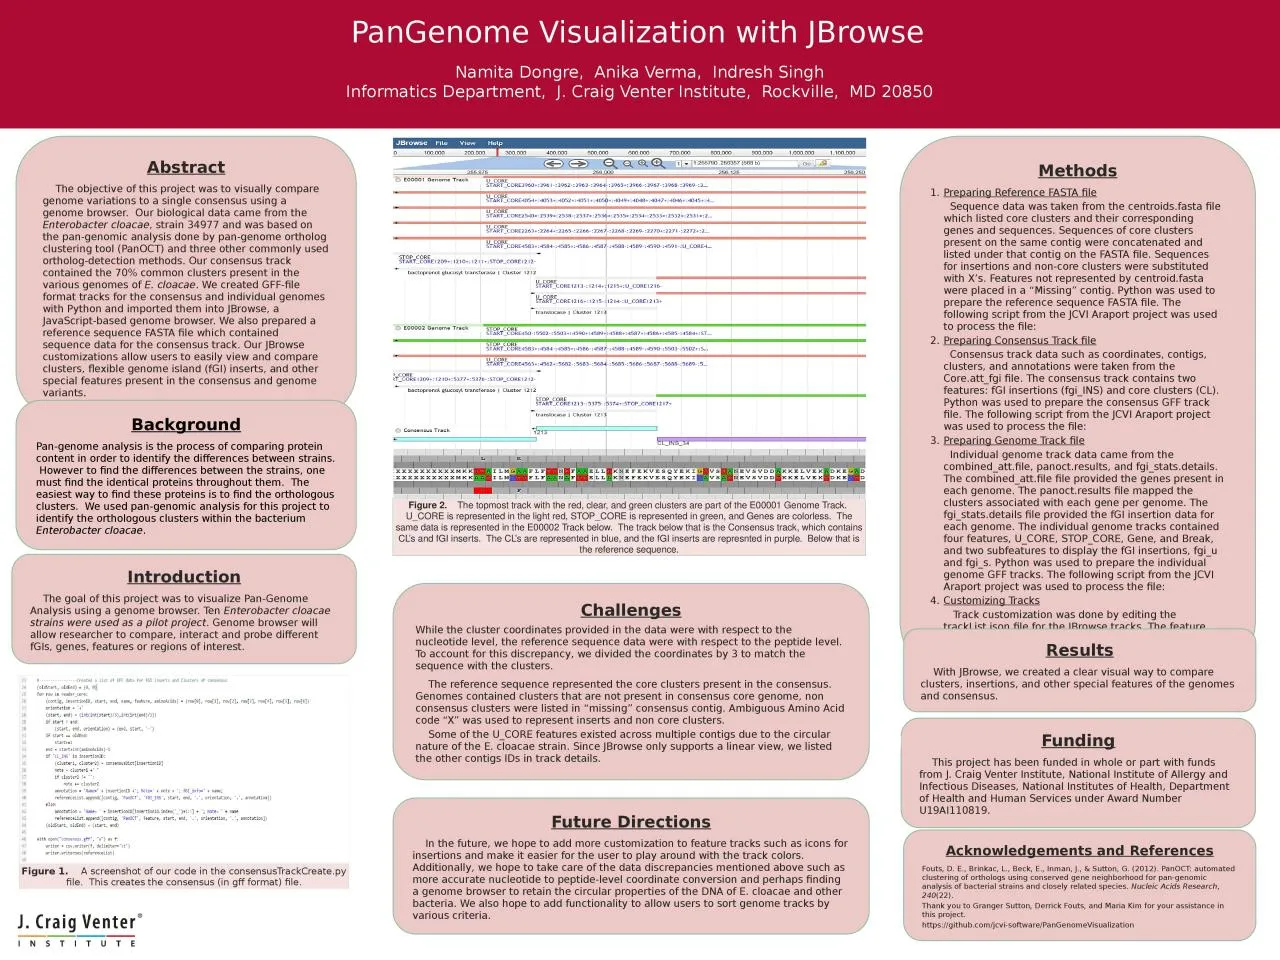
Namita Dongre Anika Verma Indresh Singh Informatics Department J Craig Venter Institute Rockville MD 20850 Abstract The objective of this project was to visually
Download Presentation
"PanGenome Visualization with JBrowse" is the property of its rightful owner. Permission is granted to download and print materials on this website for personal, non-commercial use only, provided you retain all copyright notices. By downloading content from our website, you accept the terms of this agreement.
Presentation Transcript
Transcript not available.