/
Food choices, influences and barriers to healthy eating among rural Latino migrant and Food choices, influences and barriers to healthy eating among rural Latino migrant and

Food choices, influences and barriers to healthy eating among rural Latino migrant and - PowerPoint Presentation

calandra-battersby
calandra-battersby . @calandra-battersby
Follow
370 views
Uploaded On 2018-09-30

Food choices, influences and barriers to healthy eating among rural Latino migrant and - PPT Presentation

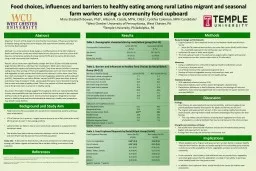
Mary Elizabeth Bowen PhD 1 Allison R Casola MPH CHES 2 Cynthia Coleman MPH Candidate 1 1 West Chester University of Pennsylvania West Chester PA 2 Temple University Philadelphia PA ID: 682703

healthy food cupboard latino food healthy latino cupboard choices seasonal clients barriers eating migrant farm study vegetables workers influences

Share:

Link:

Embed:

Download Presentation from below link

Download Presentation The PPT/PDF document "Food choices, influences and barriers to..." is the property of its rightful owner. Permission is granted to download and print the materials on this web site for personal, non-commercial use only, and to display it on your personal computer provided you do not modify the materials and that you retain all copyright notices contained in the materials. By downloading content from our website, you accept the terms of this agreement.


Presentation Transcript

Slide1

Food choices, influences and barriers to healthy eating among rural Latino migrant and seasonal farm workers using a community food cupboard Mary Elizabeth Bowen, PhD1, Allison R. Casola, MPH, CHES2, Cynthia Coleman, MPH Candidate1 1West Chester University of Pennsylvania, West Chester, PA2Temple University, Philadelphia, PA

Abstract

Background and Study Aim

Discussion

Methods

Results

Objective: The aim of this study is to describe the food choices, influences and barriers to healthy eating among rural Latino migrant and seasonal farm workers utilizing a community food cupboard. Methods: In a cross-sectional study design, a modified version of the CDC’s National Health and Nutrition survey was administered at two time points over the course of 60 days to a convenience sample of unique Latino (N=70) and non-Latino (N=41) clients using a rural community food cupboard. Results: Latino clients were significantly younger (M=39 vs. 50 years old) and reported larger families (M=4.6 vs. 3.0) than their counterparts. Most Latino clients were associated with migrant and seasonal farm work. Sixty-three percent of clients reported eating at least five servings of fruits and vegetables/week and most clients listed fruits and vegetables as their primary food choice at the cupboard. Latinos were more likely than their counterparts to request more fruit and vegetable availability at the cupboard (p≤0.05). Compared to non-Latino Whites, Latinos (p≤0.001) were least likely to desire and choose “easy to prepare” foods. Latinos (p≤0.001) were most interested in learning how to cook and prepare healthy meals. Thirty-nine percent of clients reported food cost at the grocery store as a barrier to healthy eating.Discussion: This study’s findings suggest food cupboard clients are making healthy food choices where available but that choices are limited by monthly access to the cupboard and food costs at the grocery store. Community-level programs designed to increase access to healthy foods and provide educational sessions on healthy meal preparation may benefit needy families.

Food insecurity (FI) is associated with racial/ ethnic membership, poverty and fewer years of education.27% of Latinos live in poverty – largely because they are more likely than other racial/ ethnic groups to work in low-paying positions. Latino families are likely to rely on community food cupboards to supplement their nutritional needs. Few studies have examined the relationship between culture, food choice, and FI, and even fewer have focused on this vulnerable population.Study Aim: To describe the food choices, influences and barriers to healthy eating among rural Latino migrant and seasonal farm workers utilizing a community food cupboard.

Research Design and Participants:English/Spanish 11-item modified version of the National Health and Nutrition Survey Latino (N=70) seasonal farm workers and other Non-Latino (N=41) adult clients of a rural food cupboard in the northeastern part of the U.S.Individuals 18 years or older were eligible. The food cupboard used in this study serves largely Latino migrant and seasonal farm workers across four communities within a 25-mile radius. Measures: Using a modified version of the CDC’s National Health and Nutrition survey: FI (yes/no) in the past month, List of food choices at the cupboard and grocery store, Number of fruit and vegetable servings consumed per week, and Influences on food choices and barriers to healthy eating.Statistical Analysis:SPSS statistical software (version 22.0). Descriptive statistics were used to report demographic characteristics. Racial/ethnic differences in food influences, barriers, and servings of fruits and vegetables, meat and prepackaged food were examined by chi-square statistics and one-way ANOVA’s.

Findings:Food choices are associated with cost and accessibility and food cupboards can provide additional healthy food options for adults and families at risk for FI.The migrant and seasonal farm workers in this study were making healthy food choices when possible, desiring healthy meals and fewer prepackaged food options for their families. This may reflect cultural traditions of eating fresh vegetables and fruits and whole grains; a cultural tradition that may be maintained in this ethnic enclave.Strengths and Limitations of Study:Few studies have examined the influences and barriers of healthy eating among migrant and seasonal farm workers .Findings from this study are limited by small sample size.

Implications

Where possible, Latino migrant and seasonal farm workers desire to prepare healthy meals for their families. Barriers to healthy eating for this vulnerable group of adults include cost and the availability of fruits, vegetables and dairy at community food cupboards. Food cupboards should seek to find additional ways to provide fruits, vegetables, and whole grains given that this population is limited in their ability to purchase these healthy foods from the grocery store. In addition, food cupboard clients would benefit from classes on healthy meal preparation.

References

Martin, K.S., Wu, R., Wolff, M., Colantonia, A.G., & Grady, J. (2013). A Novel Food Pantry Program; Food Security, Self-Sufficiency, and Diet-Quality Outcomes. American Journal of Preventative Medicine, 45(5), 569-575Quandt, S.A., Arcury, T.A., Tapia, J., & Davis, J.E. (2004). Household Food Security Among Migrant and Seasonal Latino Farmworkers in North Carolina. Public Health Reports, 119, 568-576

Table 1. Demographic characteristics by racial/ethnic group (N=111)

Demographic Characteristics

Latino (N=70)N (%)Non-Latino (N=41)N (%) Age (years)39.3 (11.6)50.3 (14.7)Female50 (78.1)32 (78.0)Family Size, M (SD)4.6 (1.8)3.0 (1.5)

Table 2. Barriers and Influences to Healthy Food Choices by Racial/Ethnic Group (N=111)Barriers to Healthy EatingLatino (N=70)Non-Latino (N=41)Family and friends unsupportive7.72.7Unfamiliar with healthy foods9.213.5Don't know how to cook 16.924.3Don't like trying new foods6.22.7Don't have time to prepare 10.810.8Cost40.048.6Fruits and vegetables spoil3.18.1Limit on healthy foods at cupboard10.821.6Transportation to grocery store3.15.4 Influences on Food/Meal Choices  Eat what family wants63.148.6Inexpensive foods35.451.4Easy to prepare/cook foods12.3**35.1Familiar Foods18.813.5Know how to cook35.935.1Culturally important foods0.07.8Note: Responses based on yes/no*p≤0.05, **p≤0.01.

Table 3. Food Cupboard Requests by Racial/Ethnic Group

(N=50)

Food Cupboard Requests

Latino (N=32)

M (SD)

Non-Latino (N=18)

M (SD

)


Fruits and Vegetables

0.69* (0.5)

0.39 (0.5)

Dairy Products

0.34

(0.5)

0.11 (0.3)

Proteins (Meats)

0.41 (0.5)

0.56 (0.5)

Breads, Pastas, Cereals

0.24 (0.4)

0.17 (0.4)

Canned Foods

0.24 (0.4)

0.06 (0.2)

Drinks

0.10 (0.3)

0.17 (0.4)

Dessert

0.00 (0.0)

0.00 (0.0)

p=0.07, *p≤

0.05, **p≤0.01.