/
Assessing Avian-Wind Turbine Collision Risk: Assessing Avian-Wind Turbine Collision Risk:

Assessing Avian-Wind Turbine Collision Risk: - PowerPoint Presentation

debby-jeon
debby-jeon . @debby-jeon
Follow
403 views
Uploaded On 2016-12-19

Assessing Avian-Wind Turbine Collision Risk: - PPT Presentation

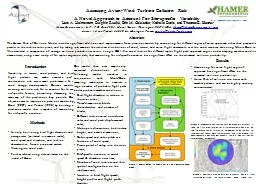
A Novel Approach to Account For Sitespecific Variability Lars A Holmstrom Delphin Ruché Erin M Colclazier Nathalie Denis and Thomas E Hamer Hamer Environmental LP PO Box 2561 Mount Vernon Washington 98273 USA ID: 503364

flight wind turbine collision wind flight collision turbine avian approach site speed risk specific model rotor angles models bird

Share:

Link:

Embed:

Download Presentation from below link

Download Presentation The PPT/PDF document "Assessing Avian-Wind Turbine Collision R..." is the property of its rightful owner. Permission is granted to download and print the materials on this web site for personal, non-commercial use only, and to display it on your personal computer provided you do not modify the materials and that you retain all copyright notices contained in the materials. By downloading content from our website, you accept the terms of this agreement.


Presentation Transcript

Slide1

Assessing Avian-Wind Turbine Collision Risk:

A Novel Approach to Account For Site-specific Variability

Lars A.

Holmstrom

, Delphin Ruché, Erin M. Colclazier, Nathalie Denis, and Thomas E. HamerHamer Environmental L.P., P.O. Box 2561, Mount Vernon, Washington, 98273, USA, Hamer@HamerEnvironmental.comAzimut, 14 rue Picard, 44620 La Montagne, France, contact@azimut-radar.com

AbstractThe Hamer Risk of Collision Model includes significant additions and improvements from previous models by accounting for different angles of avian approach other than perpendicular or parallel to the turbine rotor plane, and by taking into account the statistical distributions of wind, terrain, and avian flight characteristics at the wind resource area using Monte Carlo sampling. We calculated a comparison of average collision probabilities across a single GE 1.5se wind turbine for different raptor flight path approach angles under varying weather conditions. We demonstrate, using a case study of fall raptor migration data, that accounting for site-specific variables has a significant effect on the estimated collision probability.

Our model then uses empirically measured distributions of the following model variables in conjunction with Monte-Carlo sampling techniques to simulate a large number of probable flight paths under probable weather conditions:

Bird flight direction in relation to the rotor plane ;Three-dimensional blade characteristics and number of blades;Different turbine avian avoidance rates and wind park displacement rates; Monopole dimensions, hub/turbine height, and nacelle dimensions; Rotor speed and rotor pitch as a function of wind speed; Precise point of entry into the rotor plane; Site-specific variation in wind speed & direction over time; Number of wind turbines and their spatial configuration on the landscape and; Variation in bird flight speeds, height profiles and flight path density.

Methods

Introduction

Results

Figure 1. Workflow of the Monte Carlo simulation-based Hamer model.

Variability in terrain, wind patterns, and bird flight patterns can make accurate pre-construction risk assessment problematic for wind energy developments. Current models assessing collision risk fail to account for these site-specific factors, potentially decreasing the accuracy of the predictions they provide. Our objective was to improve on previous models by Band (2007) and Tucker (1996) by building a predictive model that is capable of accounting for site-specific variation.

Initially built using

bird flight directions and passage rates (collected via marine radar), wind speed and direction, and turbine characteristics from a proposed eastern Washington wind park.Further refined using data collected on the island of Kauai.

Figure 2.

Gaussian Kernel density of flight paths within a radar survey field illustrating the spatial variability within a single site.

Figure 3. A comparison of average collision probabilities across a single GE 1.5se wind turbine for different Sharp-shinned Hawk flight approach angles relative to downwind, using the mean recorded flight speed. Note the difference in collision probability when compared with previous models (red line) which assumed uniform angles of approach.

Accounting for avian flight angle of approach has a significant effect on the estimated collision probability. Avian Risk of collision also varies with weather patterns and can be highly spatially autocorrelated.

http://www.HamerEnvironmental.com