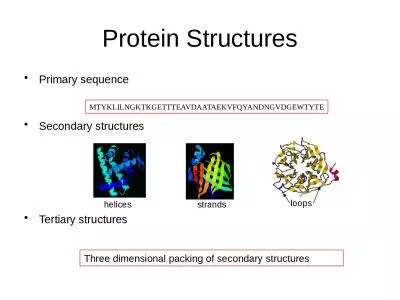
Avdesh Mishra Md Tamjidul Hoque amishra2 thoque unoedu Presented By Avdesh Mishra Department of Computer Science Protein structure in its native state gains lowest free energy ID: 580149
Download Presentation The PPT/PDF document "Improved Protein Structure Prediction us..." is the property of its rightful owner. Permission is granted to download and print the materials on this web site for personal, non-commercial use only, and to display it on your personal computer provided you do not modify the materials and that you retain all copyright notices contained in the materials. By downloading content from our website, you accept the terms of this agreement.
Slide1
Improved Protein Structure Prediction using Advanced Scoring Function and Effective Sampling
Avdesh Mishra, Md Tamjidul Hoque{amishra2, thoque}@uno.edu
Presented By: Avdesh MishraDepartment of Computer ScienceSlide2
Protein structure in its native state gains lowest free energy
The figure showsenergy landscape with energy barrierssome narrow path to native state
Energy
Native state
Unfolded state
Low
High
Decoy
Energy barriers
Background
Dill KA,
MacCallum
JL. The protein-folding problem, 50 years on. Science. 2012 Nov 23;338(6110):1042-6.Slide3
-10
-20
-100
-110
-140
Scoring Function
Scores
Scoring Function
Dill KA,
MacCallum
JL. The protein-folding problem, 50 years on. Science. 2012 Nov 23;338(6110):1042-6.Slide4
Scoring Function
Scoring Function
Knowledge-based Scoring Function
Physics-based Scoring FunctionSlide5
Physical-based Scoring Function
Approximates the energy based on empirical molecular mechanics force fields that contains terms associated with:Bond lengths and bond anglesTorsion anglesVan der waals interactions and
Electrostatic interactionsThese force fields calculations are computationally expensive
thus, physical-based scoring functions are less successful
.Slide6
Knowledge-based Scoring Function
Empirical scoring function derived from the statistics of the known structure.They have been successful because theyProvide decent approximation
Computationally less expensiveEasy to useSupposed to inherently incorporate the forces that have not been developed or used by scientists currentlySlide7
HP
ASA
uPsi
u
Phi
3DIGARS3.0 Knowledge-based Scoring Function
Sequence-specific accessible surface area
Ubiquitous phi orientation angles
Ubiquitous psi orientation angles
Hydrophobic and hydrophilic properties
3DIGARS3.0
The model is mathematically expressed as
E
3DIGARS3.0
= E
HP
+ (w
1
× E
ASA
) + (w
2
×
E
uPhi
) + (w
3
×
E
uPsi
)Slide8
3DIGARS – HP Properties
Hydrophobic and polar interaction plays vital role in tertiary structure formation.The spatial conformation of the protein can be divided into at least three different layers as shown in the figure.
Thus, we
collect the statistics of hydrophobic vs hydrophobic, hydrophilic vs hydrophilic and hydrophobic vs hydrophilic interactions among the atoms and incorporate in our function
Mishra A.
and
Hoque
M. T., Three-Dimensional
Ideal Gas Reference State Based Energy Function.
Current Bioinformatics
,
12, pp.171-180, 2017.Slide9
3DIGARS Results
Decoy
Sets
DFIRE
RWplus
dDFIRE
DFIRE2.0
3DIGARS
No. of Targets
Moulder
19
(-2.97)
19
(-2.84)
18
(-2.74)
19
(-2.71)
19
(-2.998)
20
Rosetta
20
(-1.82)
20
(-1.47)
12
(-0.83)
22
(-1.76)
31
(-2.023)
58
I-
Tasser
49
(-4.02)
56
(-5.77)
48
(-5.03)
53
(-4.548)
53
(-4.036)
56
4state-reduced
6
(-3.48)
6
(-3.51)
7
(-4.15)
6
(-3.16)
6
(-3.37)
7
Fisa_casp3
4
(-4.80)
4
(-5.17)
4
(-4.83)
4
(-5.08)
5
(-4.31)
5
Lmds
7
(-
0.88)
7
(-1.03)
6
(-2.44)
7
(-0.71)
7
(-1.96)
10
Best scores
are colored in green and
competitive scores
are colored
in yellow. Values within the parenthesis are average z-scores of the native structures.Slide10
3DIGARS2.0 – ASA Properties
Here, we incorporate the information present in amino acid sequence.Using REGAd3p and DSSP tools we obtain the predicted and real (ASA) of each amino acid
.We then compute the frequency distribution of the
difference between real and predicted
ASA.
Next, these frequency distributions are converted into energy scores.
Iqbal, S., Mishra, A. &
Hoque
, T. (2015). Improved Prediction of Accessible Surface Area Results in Efficient Energy Function Application.
Journal of Theoretical Biology
380
, 380-391
.Slide11
3DIGARS2.0 Results
Decoy Sets
DFIRE
RWplus
dDFIRE
GOAP
3DIGARS
3DIGARS2.0
No. of Targets
Moulder
19
(-2.97)
19
(-2.84)
18
(-2.74)
19
(-3.58)
19
(-2.998)
19
(-2.6728)
20
Rosetta
20
(-1.82)
20
(-1.47)
12
(-0.83)
45
(-3.70)
31
(-2.023)
49
(-2.9871)
58
I-
Tasser
49
(-4.02)
56
(-5.77)
48
(-5.03)
45
(-5.36)
53
(-4.036)
56
(-4.2964)
56
Best scores
are colored in green and
competitive scores
are colored in yellow. Values within the parenthesis are average z-scores of the native structures.Slide12
3DIGARS3.0 –
uPhi, uPsi Orientation AnglesThe main idea isto incorporate 3D shape of the protein structure
Phi and Psi angles define the backbone structure of the protein.We mine the orientation angles for all atoms to capture the 3D shape.
Calculation of Phi and Psi angle involves the backbone atoms
C(O)
n-1-Nn-C(α)
n
-C(O)
n
and
N
n
-C(α)n-C(O)n-Nn+1 respectively.
The uPhi and uPsi angles are computedIn the similar manner as dihedral anglesBut, we compute them for all the atoms
instead of only backbone atoms.
Mishra, A., Iqbal, S. &
Hoque, M. T. (2016). Discriminate protein decoys from native by using a scoring function based on ubiquitous Phi and Psi angles computed for all atom. Journal of theoretical biology
398, 112-121.Slide13
3DIGARS3.0 Results
Decoy Sets
DFIRE
RWplus
dDFIRE
GOAP
3DIGARS
3DIGARS2
3DIGARS3
Total No. Targets
Moulder
19
(-
2.97)
19
(-
2.84)
18
(-
2.74)
19
(-
3.58)
19
(-
2.998)
19
(-
2.6728)
20
(-3.851)
20
Rosetta
20 (-
1.82)
20 (-
1.47)
12 (-
0.83)
45
(-
3.70)
31
(-
2.023)
49
(-
2.9871)
46
(-2.683)
58
I-
Tasser
49 (-
4.02)
56
(-
5.77)
48 (-
5.03)
45
(-
5.36)
53
(-
4.036)
56
(-
4.2964)
56
(-5.573)
56
4state-reduced
6 (-3.48)
6 (-3.15)
7
(-4.15)
7
(-4.38)
6
(-3.371)4 (-2.642)7 (-3.456)7Fisa_casp34 (-4.80)4 (-5.17)4 (-4.83)5 (-5.27)5 (-4.319)5 (-4.682)4 (-4.076)5Hg_structa12 (-1.97)
12 (-1.74)
16
(-1.33)
22
(-2.73)
12 (-1.914)
12 (-1.589)
28
(-3.678)
29
Ig_structal
0 (0.92)
0 (1.11)
26
(-1.02)
47
(-1.62)
0 (0.645)
0 (0.268)60 (-2.526)61Ig_structal_hires0 (0.17)0 (0.32)16 (-2.05)18 (-2.35)0 (-0.002)1 (0.030)20 (-2.378)20
Best scores
are colored in green and
competitive scores
are colored in yellow. Values within the parenthesis are average z-scores of the native structures.Slide14
Protein Structure Prediction
Goal: predict the 3D structure of a protein from its amino acid sequenceSlide15
Protein Structure Prediction: Methods
PSP
Methods
Homology Modeling
Ab Initio Modeling
Can be applied regardless of the presence or absence of the pre-existing structure
Can only be applied if similar structure are presentSlide16
Ab Initio PSP Components
Ab InitioScoring Function
Conformational Search
Ab Initio modeling conducts a conformational search under the guidance of a designed scoring function
.
A successful Ab Initio method depends on two factors:
Effective search method
which can quickly identify the low-energy state through
conformational search
Accurate energy function
which can differentiate the native structure that corresponds to the most thermodynamically stable state, compared to the possible decoy structures.Slide17
3DIGARS-PSP Method
Dataset of 4332 Protein Structures
Obtain Secondary Structure (SS) and
Φ,
Ψ Angles using DSSP
Generate Frequency Distribution of
Φ
,
Ψ
Angles and SS Types
Backbone Models
Initialize GA Population using Single Point Angular Mutation
Save Best Model in Memory
Select 5% Elite Models
Fill Rest Randomly
Perform Angular Mutation
@ 60
%
Perform
Memory Assisted Crossover
@ 70
%
Obtain Full Model using SCWRL4 and Calculate Fitness using 3DIGARS3.0
Gen < 2000
End
Save Models
Best ModelsSlide18
3DIGARS-PSP Results
Figure 1 |
Cysteine Protease Inhibitor (PDB ID: 1nyc); towards top – superposition of 3DIGARS-PSP model on native (initial seeds from Rosetta); towards bottom – superposition of top Rosetta model (based on TMScore
) on native.
Figure 2 |
E. Coli protein
(PDB ID:
1pohA); towards top – superposition of 3DIGARS-PSP model on native
(initial seeds from
Rosetta); towards bottom – superposition of top Rosetta model (based on
TMScore
) on native.
Natives
are shown in cyan and pink and Models are shown in red and
yellowNative Vs 3DIGARS-PSP
Native Vs RosettaSlide19
3DIGARS-PSP Results
Mishra, A., & Hoque, M. T. (2017). Next Generation Evolutionary Sampling and Energy Function Guided ab initio Protein Structure Prediction. Biophysical Journal, 112(3), 55a.Slide20
3DIGARS-PSP ResultsSlide21
o3DIGARS (Optimized 3DIGARS)
Thus, we further improve the accuracy of the 3DIGARS3.0 scoring function by following stepsCollected three different datasetsDataset used to train 3DIGARS scoring functionDataset used to train the 3DIGARS2.0 scoring functionDataset used to train and test the SpineX
server.Computed predicted ASA and Phi-Psi angles using Spiders2 program.Computed
real ASA and Phi-Psi angles using DSSP program.
Computed energy distribution from the difference between real and predicted
ASA and Phi-Psi values respectively, for each datasets using two different reference states.
Heffernan R,
Paliwal
K, Lyons J,
Dehzangi
A, Sharma A, Wang J,
Sattar
A, Yang Y, Zhou Y. Improving prediction of secondary structure, local backbone angles, and solvent accessible surface area of proteins by iterative deep learning. Scientific reports. 2015;5.Kabsch, W. and C. Sander, Dictionary of Protein Secondary Structure: Pattern Recognition of Hydrogen-Bonded and Geometrical Features. Biopolymers, 1983. 22: p.
2577-2637Slide22
o3DIGARS Feature Set
o3DIGARS Score3DIGARS Score
ASA Score Computed using REGAd3p
uPhi
and
uPsi
Scores
Total Features = 2
Phi Angles Scores Computed from 3 Different Data and 2 Difference Reference State
Total Features = 6
ASA Score Computed from 3 Different Data and 2 Different Reference State
Total Features = 6
ASA Score Computed from 3 Different Data, 2 Different Reference State and Segregated Based on SS
Total Features = 6
Psi Angles Scores Computed from 3 Different Data and 2 Difference Reference State
Total Features = 6Slide23
o3DIGARS
Collected 24 new features.We obtained sequence-specific torsion and ASA energy components for independent training and test datasets.The training dataset comprises of the structures submitted in CASP10 and CASP11 for PSP.Similarly, the
test dataset comprises of the structures submitted in CASP8 and CASP9 for PSP.These features were multiplied with weights and linearly combined together.
Then the optimization was carried out to optimize the objective functionOBJ_Fxn
= PCC_Avg
+ (-1.0 * Tmscore_Low_Energy_Modle_Avg)Slide24
o3DIGARS Optimization
Using Genetic Algorithm we optimized the combination of o3DIGARS energy components.o3DIGARS = E3DIGARS + w1 * EASA_REGAd3p + w2 * EuPhi + w3 * E
uPsi + w4 * EASA_3DIGARS_Data_Ref1 + w5 * E
ASA_SSD_Data_Ref1 + w6
* EASA_Spiders2_Data_Ref1
+ w7 * EASA_3DIGARS_Data_Ref2
+
w
8
* E
ASA_SSD_Data_Ref2
+ w9 * EASA_SpineX_Data_Ref2 + w10 * EASA_SS_3DIGARS_Data_Ref1
+ w11 * EASA_SS_SSD_Data_Ref1 + w12
* EASA_SS_Spiders2_Data_Ref1 + w13 * EASA_SS_3DIGARS_Data_Ref2
+ w14 * EASA_SS_SSD_Data_Ref2 + w15 *
EASA_SS_SpineX_Data_Ref2 + w16 * EPhi_SS_3DIGARS_Data_Ref1 + w
17 * EPhi_SS_SSD_Data_Ref1 + w18 * EPhi_SS_Spiders2_Data_Ref1
+ w19 * EPhi_SS_3DIGARS_Data_Ref2 + w20 *
EPhi_SS_SSD_Data_Ref2 + w21 * EPhi_SS_SpineX_Data_Ref2 +w22
* EPsi_SS_3DIGARS_Data_Ref1 + w23
*
E
Psi_SS_SSD_Data_Ref1
+
w
24
*
E
Psi_SS_Spiders2_Data_Ref1
+
w
25
*
E
Psi_SS_3DIGARS_Data_Ref2
+ w26
* EPsi_SS_SSD_Data_Ref2 + w27 * EPsi_SS_SpineX_Data_Ref2
Excluded those features with zero weights and ran the optimization again.Final o3DIGARS model:o3DIGARS = E3DIGARS + w
1 * EASA_REGAd3p + w2 * EuPsi + w3
* EASA_3DIGARS_Data_Ref1 + w4 * EASA_Spiders2_Data_Ref1 + w5 * EASA_SSD_Data_Ref2
+ w6 * EASA_SpineX_Data_Ref2 +
w7 * EASA_SS_3DIGARS_Data_Ref1 + w
8 * EASA_SS_SSD_Data_Ref1 + w9 * EASA_SS_Spiders2_Data_Ref1 + w10
* EPsi_SS_3DIGARS_Data_Ref1 + w11
* E
Psi_SS_SSD_Data_Ref1
+
w
12
* E
Psi_SS_Spiders2_Data_Ref1
Slide25
o3DIGARS ResultsPlot shows the comparison of Rosetta and I-
Tasser’s TMscore (first model) with the TMscore of the model selected by o3DIGARS. The larger number of points below the y = x line shows that o3DIGARS is able to select the model with low TMscore more accurately.Slide26
o3DIGARS ResultsPlot shows the comparison of Rosetta and I-
Tasser’s Tmscore (first model) with the TMscore of the model selected by o3DIGARS. The larger number of points below the y = x line shows that o3DIGARS is able to select the model with low TMscore more accurately.Slide27
o3DIGARS ResultsPlot shows the comparison of Rosetta and I-
Tasser’s Tmscore (average of 5 models) with the TMscore of the model selected by o3DIGARS. The larger number of points below the y = x line shows that o3DIGARS is able to select the model with low TMscore more accurately.Slide28
o3DIGARS ResultsPlot shows the comparison of
Rosetta and I-Tasser’s Tmscore (average of 5 models) with the TMscore of the model selected by o3DIGARS. The larger number of points below the y = x line shows that o3DIGARS is able to select the model with low TMscore more accurately.Slide29
o3DIGARS Results
3DIGARS3.0
o3DIGARS
% Improvement
Avg. PCC
-0.56333
-0.65341
15.99%
Avg.
Tmscore
of Low Energy Model
0.645093
0.678777
5.22%
Table compares the performance
of 3DIGARS3.0 and
o3DIGARS methods based on average PCC and
TMscore
of Low Energy Models on
CASP8 independent test dataset.Slide30
o3DIGARS Results
3DIGARS3.0
o3DIGARS
% Improvement
Avg. PCC
-0.63487
-0.65553
3.25%
Avg.
Tmscore
of Low Energy Model
0.60976
0.635949
4.29%
Table compares the performance
of 3DIGARS3.0 and
o3DIGARS methods based on average PCC and
TMscore
of Low Energy Models on
CASP9 independent test dataset.Slide31
Software AvailabilitySoftware, dataset and related materials for all three versions of our energy functions (3DIGARS, 3DIGARS2.0 and 3DIGARS3.0) and the
Ab Initio (V1) are available freely onlinehttp://cs.uno.edu/~tamjid/Software/ab_initio/v1/PSP.ziphttp://cs.uno.edu/~tamjid/Software/3DIGARS/3DIGARS.ziphttp://cs.uno.edu/~tamjid/Software/3DIGARS/3DIGARS2.0.ziphttp://cs.uno.edu/~tamjid/Software/3DIGARS/3DIGARS3.0.zipSlide32
AcknowledgeI’d also like to gratefully acknowledge
the Louisiana Board of Regents through the Board of Regents Support Fund, LEQSF (2013-16)-RD-A-19.I’d like to thank my supervisor Dr. Md Tamjidul Hoque
and everyone who has helped me in this project.Slide33