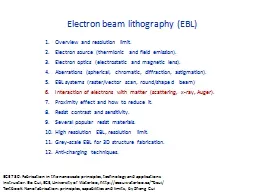
Overview and resolution limit Electron source thermionic and field emission Electron optics electrostatic and magnetic lens Aberrations spherical chromatic diffraction astigmation EBL systems rastervector scan roundshaped beam ID: 776054
Download Presentation The PPT/PDF document " Electron beam lithography (EBL)" is the property of its rightful owner. Permission is granted to download and print the materials on this web site for personal, non-commercial use only, and to display it on your personal computer provided you do not modify the materials and that you retain all copyright notices contained in the materials. By downloading content from our website, you accept the terms of this agreement.
Slide1
Electron beam lithography (EBL)
Overview and resolution limit.Electron source (thermionic and field emission).Electron optics (electrostatic and magnetic lens).Aberrations (spherical, chromatic, diffraction, astigmation).EBL systems (raster/vector scan, round/shaped beam)Interaction of electrons with matter (scattering, x-ray, Auger).Proximity effect and how to reduce it.Resist contrast and sensitivity.Several popular resist materials.High resolution EBL, resolution limit.Grey-scale EBL for 3D structure fabrication.Anti-charging techniques.
ECE 730: Fabrication in the
nanoscale
: principles, technology and applications
Instructor: Bo Cui, ECE, University of Waterloo; http://ece.uwaterloo.ca/~bcui/
Textbook: Nanofabrication: principles, capabilities and limits, by Zheng Cui
Slide2Interactions of electrons with matter
Unlike X-rays, electrons interact very strongly with matter
Elastic scattering (i.e. no loss of energy) of electrons can be treated classically as a form of Rutherford backscattering
Inelastic scattering arises from numerous interactions:Low energy secondary electrons generation.Inner shell excitations (x-ray fluorescence and Auger electrons)Electron-hole pair creation and recombinationPhonon excitation (heat)
2
Slide3Information from electron beam-specimen interactions
When electron beam strikes the sample, both photon and electron signals are emitted.
3
Slide4Interaction volume
4
Slide5Best spatial resolution for SEM
Better Z contrast for SEM
(brighter for higher Z)
Best analytical for EDX
Secondary electron (SE) region for imaging(SE is actually produced wherever primary electron goes, but only those near surface can go out to reach SE detector for imaging)
Back-scattered electron (BSE) region for imaging(Again, BSE is actually produced wherever primary electron goes. It has higher energy, so travel longer than SE)
X-ray region for EDX(x-ray is actually produced wherever primary electron goes. It travels/ penetrates even farther than BSE)
Which region is for which application
BSE has lower resolution than SE signal, and is used only when chemical (Z) contrast is wanted.
TEM (transmission EM) gives much higher resolution than SEM because of the much lower interaction volume of the high energy electrons (200keV!) passing the
thin
samples.
Slide6X-ray generation by electron bombardment
Energy levels:
1 is due to screening (=0 for ideal model).
n=1 (K-shell), 2 (L-shell), 3 (M-shell)….
Emitted x-ray energy E
x-ray
K: Ex-ray=E1-E2K: Ex-ray=E1-E3L: Ex-ray=E2-E3….
6
Slide7Energy-dispersive x-ray spectroscopy (EDS, EDX)
SEM is often equipped with EDX that detect x-ray emitted (needs only extra
$50K).Each element has its characteristic x-ray, so EDX is for elemental analysis.Since both primary electrons and emitted x-ray can penetrate certain depth (up to many m), EDX is not for top surface analysis (AES is, see next slides).The principle is the same as electron impact x-ray source, but here a focused electron beam is used to “impact or bombard” the sample.Light element (Z4) usually cannot be detected, since their characteristic energy is lower and thus cannot go through the x-ray detector window. (We know that longer wavelength shorter attenuation/penetration length).EDX is similar to x-ray fluorescence (XRF). The only difference is that, for EDX inner shell electrons are kicked off by high energy electrons; for XRF it is by high energy x-ray with energy emitted characteristic x-ray energy, or even by -ray.
7
EDX analysis of a material
The peak for W could be L
(its K
energy is much higher)
Slide8Auger electron emission
E
Core
State, EB, EC': core level (here n=1), first outer shell (n=2), second outer shell (n=2) electron energies. (ECore State − EB is the same energy as the characteristic x-ray energy)Since orbital energies are unique to an atom of a specific element, analysis of the energy of ejected electrons can yield information about the chemical composition of a surface.
http://en.wikipedia.org/wiki/Auger_electron_spectroscopy
Kinetic energy of ejected electron:Ekin = ECore State − EB − EC'
For EDX
Fluorescence and Auger electron yields as a function of atomic number for K shell vacancies.
For AES
Kick off electron
Slide9Auger Electron Spectroscopy (AES)
AES is good for light element (e.g. Li) where Auger electron dominate x-ray emission yield.It is for surface analysis, able to analyze only the top surface (2-5nm).Scanning Auger Microscope (SAM) is a type of AES, but with focused electron beam to give high resolution spatial information of element distribution.
9
from Briggs and
Seah
, Practical Surface Analysis 2nd Edition John Wiley & Sons, 1990, p. 207.
Attenuation length as a function of energy (depends on Z)
Auger electron
Electron energy (
eV
)
1-10 monolayersampling depth
Auger spectrum of a copper nitride film
(weak signal, often need derivative to show the peaks)
Slide10Electron beam lithography (EBL)
Overview and resolution limit.Electron source (thermionic and field emission).Electron optics (electrostatic and magnetic lens).Aberrations (spherical, chromatic, diffraction, astigmation).EBL systems (raster/vector scan, round/shaped beam)Interaction of electrons with matter (scattering, x-ray, Auger).Proximity effect and how to reduce it.Resist contrast and sensitivity.Several popular resist materials.High resolution EBL, resolution limit.Grey-scale EBL for 3D structure fabrication.Anti-charging techniques.
10
Slide11Forward/back scattering events
Scattering: spreading of the beam, lost of resolution
Properties:
Very often
Small angleVery inelastic (i.e. lose energy)Generation of SE (secondary electrons) with low energy.
Properties:
Occasionally (collision with nucleus)Large angles, thus mainly elasticHigh energy, same range as primary electrons.Large travel length, cause proximity effect.
Forward scattering
Back scattering (by nucleus)
Backscattering is responsible for resist exposure far from incidence (proximity effect), as BSE can generate SE along its path to expose the resist there.
Resist
Substrate
Slide12Forward/back scattering events
Energy spectrum of electrons emitted from substrate
Energy of primary electrons
There is no clear-cut distinction of SE and BSE. Typically energy <
50eV is “called” SE.
SE with several eV are responsible for most (not all) resist exposure. Such SE diffuses laterally a few nm, which is one limiting factor for ultra-high resolution EBL.
SE: secondary electron; BSE: backscattered electrons
Auger electrons
Slide13Monte-Carlo simulations of electron trajectory
Number of backscattered electrons is not so dependent on energy, but its spatial distribution is.
Proximity effects are “diluted” (spread over larger area) at high energies.
Scattering probability
varies as square of atomic number Z, and inversely as the incident kinetic energy.
Low Z
High Z
Penetration depth decrease with Z.
13
Slide14Effect of voltage on dose
At small kV, penetration depth is low, so cannot expose thick resist. (e.g. at 0.8kV, penetration depth only
40nm in PMMA).At >2kV, resist sensitivity is higher for lower kV, so faster writing.But lower kV has larger beam spot size due to aberrations, and more serious forward scattering, both of which reduces resolution.In addition, lower kV has lower attainable beam current that reduces writing speed.Therefore, typical EBL is done at >3kV.
(p
enetration depth)
(Sensitivity)
14
Slide15Double Gaussian model
Bad fit here
: range of forward scattering (in m)
: range of backscattering (in m)
: ratio of backscattering to forward scattering
Forward scattering
Back- scattering
15
The curve are in
log
scale(!!)
Slide16Proximity effect is negligible for isolated/sparse fine features.
It is
good
for
areal exposure (e.g. a big square >>1m), since pixel can be much larger than beam spot size (right figure). E.g., beam step size (pixel) of 50nm is usually enough to give uniform areal exposure, even with a beam spot size only 5nm.Proximity effect is worst for dense and fine patterns, such as grating with sub-50nm pitch.
Proximity effect(similar to that in OPC – optical proximity correction)
Real dose D=E(1+b)
E is as-exposed doseb is due to proximity effectb2 (not small) for large area exposure
16
Area in-between exposed by proximity effect
Slide17Due to forward scattering and (to a less degree) proximity effect, positive resist has always an undercut profile, good for liftoff.Negative resist always has a tapered profile, bad for liftoff.For patterning dense fine features, an undercut profile often causes resist structure to collapse due to capillary force when developer is dried.That is, proximity effect makes patterning dense fine features difficult.
Resist profile
Resist
Substrate
Positive resist
Negative resist
Original thickness
Developed profile
A thin layer may be developed due to exposure by proximity effect
17
substrate
Resist (positive) profile, not mechanically stable
Dense AND fine structures
Slide18How to reduce proximity effects
18
(extremely high resolution, 1.5nm, see later slide for resist)
Slide19Eliminate proximity effect using resist on membrane
TEM image of nano-gaps with gaps
0.7-6
nm
Standard
PMMA-SiO2-Si+ substrate. An incident electron beam "forward-scatters" slightly in the PMMA and SiO2 layers. Strong scattering in the Si+ results in broadly distributed "back-scattered" electrons which expose a wide region of the PMMA. PMMA-Si3N4 substrate used to make nanogaps with EBL. Two nearby areas are shown being sequentially exposed to an electron beam while the small "nanogap" region between them is left unexposed.
Fischbein
, “
Nanogaps
by direct lithography for
high-resolution imaging and electronic characterization of nanostructures”, APL 88, 063116 (2006)
Slide20Proximity effect correction
Similar idea to OPC (optical proximity correction), but here proximity extends many
m, depending on beam energy and substrate material (atomic number Z).
20
Slide21Electron beam lithography (EBL)
Overview and resolution limit.Electron source (thermionic and field emission).Electron optics (electrostatic and magnetic lens).Aberrations (spherical, chromatic, diffraction, astigmation).EBL systems (raster/vector scan, round/shaped beam)Interaction of electrons with matter (scattering, x-ray, Auger).Proximity effect and how to reduce it.Resist contrast and sensitivity.Several popular resist materials.High resolution EBL, resolution limit.Grey-scale EBL for 3D structure fabrication.Anti-charging techniques.
21
Slide22Here D
1
and D0 is defined for B
EBL resist: sensitivity and contrast
Resist development curves:
Resist A is of higher sensitivity than B.
A is of higher contrast than B; C is negative resist.
substrate
thickness
Sensitivity:
For positive resist: D
1
value; or dose required to fully develop the resist to bottom, which is usually close to D
1
value.
For negative resist: dose that results in half resist thickness remaining after development.Contrast : defined as slope of the development curve.
For “perfect” resist, D
1=D0, so .Usually >2.0 is goodFor PMMA, =5-10.
22
negative
positive
Slide23Positive vs. negative resist
Positive resist (trench)
Negative resist (line)
Slide24Which resist to choose depends on which will give the minimum exposure area/time.For isolated sparse features, positive resist is suitable for liftoff process, while negative for direct etch process.To pattern Si (or SiO2…), either Cr liftoff then RIE using Cr as mask, or direct etch of Si using resist as mask will work, though Si can be etched deeper with more vertical sidewall using Cr as mask.
Which (positive or negative) resist to choose
1.
Spin on positive resist
Resist
2.
EBL
3.
Cr deposition
4.
Liftoff Cr
5. RIE substrate using Cr as mask (not shown)
Liftoff
process using positive resist
1.
Spin on negative resist
2.
EBL
3.
RIE substrate
Direct etch process using negative resist
24
Slide25Resist tone reversal process
Very useful if one has only one cheap positive resist: PMMA
substrate
Resist
Under-layer (polymer such as PMGI)
substrate
substrate
substrate
For positive resist, trench (or hole) formed after EBL.
Liftoff a hard material (Cr, SiO
2
)
RIE under-layer.
The resulted polymer structure is a line (or pillar), as if negative resist were used.
Profile in resist
Profile in under-layer
substrate
After metal liftoff
Hole array in 100nm-thick Au with pitch 600nm.
25
Slide26Sensitivity
Sensitivity depends on:
Electron energy keV (or acceleration voltage kV). Higher energy requires higher exposure dose, so lower sensitivity.For example, sensitivity for PMMA is 250C/cm2 with 30kV, but 600 C/cm2 with 100kV (high energy electrons pass fast through the resist, generating fewer low energy secondary electron (SE) to expose the resist, or they are just not efficient to generate SE due to the large energy difference. Substrate material: high density substrate (high Z) material results in more back scattering of electrons into resist layers, leading to higher sensitivity (e.g. PMMA on Au sensitivity is 2 that on Si). But of course more severe proximity effect.Process conditions: post exposure baking conditions for chemically amplified resist; strength of developer, development temperature and time. (sensitivity 0C/cm2 (!!) if developed infinitely long time)Developer used. For example, PMGI sensitivity 50C/cm2 when using base developer, 1000C/cm2 when using solvent developer. (PMGI: Poly(dimethyl glutarimide))
Note: higher sensitivity means one needs lower dose to fully expose the resist.
26
Bo Cui, Teodor Veres, “High resolution electron beam lithography of PMGI using solvent developers”, Microelectronic Engineering, 2008.
Slide27Contrast
Contrast curve of SU-8
Contrast only 0.92
Low contrast resist profile
High contrast resist profile
High contrast:
Steeper sidewalls
Greater process latitude
Better resolution
Higher aspect ratio structureLess sensitive to proximity effect, higher density pattern.Low contrast: good only for 3D gray scale lithography
27
Slide28L: resolution
D: dose (sensitivity)
Sensitivity vs. contrast: a dilemma
No resist has both high sensitivity and high contrast/resolution.
This is not always that bad, because, anyway, even though such resist exist, it cannot be exposed using an inexpensive EBL system – too short dwell time (since high sensitivity) for exposing each tiny pixel (since high resolution), that beam blanker cannot follow.
This dilemma is similar to that for EUV resist, where due to shot/statistically noise, higher sensitivity has higher LER (line-edge roughness).In fact, shot noise is also important for EBL when using very sensitive resists.
Ocola LE and Stein A, JVST B, 24(6), 3061-3065 (2006).
(sensitivity)
28
Slide29Electron beam lithography (EBL)
Overview and resolution limit.Electron source (thermionic and field emission).Electron optics (electrostatic and magnetic lens).Aberrations (spherical, chromatic, diffraction, astigmation).EBL systems (raster/vector scan, round/shaped beam)Interaction of electrons with matter (scattering, x-ray, Auger).Proximity effect and how to reduce it.Resist contrast and sensitivity.Several popular resist materials.High resolution EBL, resolution limit.Grey-scale EBL for 3D structure fabrication.Anti-charging techniques.
29
Slide30Conventional and chemically amplified resists
They are more popular
30
Slide31The standard EBL resist: PMMA (positive)
The most popular e-beam resist, very cheap and last forever, easy handling.
Very high-resolution and contrast.Typical molecular weight is 950kg/mol. Lower Mw (e.g. 15kg/mol) leads to higher sensitivity but lower contrast.Usually dissolved in a solvent: chlorobenzene, or anisole (less toxic, 2-4%).Developer mixtures can be adjusted to control contrast and sensitivity.The downside: low sensitivity, poor dry etch resistance (good for liftoff, not for direct etch pattern transfer).
31
Slide32PMMA developer
MIBK : IPA (isopropanol)=1:3 for typically 60sec, most popular developer.
Cellosolve
(2-ethoxyethanol): methanol=3:7 for 7-10sec, claimed by some to have slightly higher contrast than MIBK.MEK (methyl ethyl ketone) : ethanol=26.5:73.5 for 2-5 second also works well.IPA : H2O=7:3, co-solvent system, i.e. neither IPA nor water alone dissolves exposed PMMA. Claimed by some to have better performance than MIBK.
[1] “Enhanced sensitivity in the electron beam resist PMMA using improved solvent developer”, Mohsin and Cowie, Polymer, 1988, page 2130.[2] “New high-contrast developers for PMMA”, Bernstein and Hill and Liu, J Appl. Phys., 71(8), 1992, page 4066.[3] “Comparison of MIBK/IPA and water/IPA as PMMA developers…”, Microelectronic Engineering, 61-62, 745-753 (2002).
(MIBK: methyl isobutyl ketone)
32
The dilemma again: higher sensitivity comes with lower contrast
Slide33PMMA dose table
10kV
20kV30kVArea dose (C/cm2)100180250Line dose (nC/cm)0.50.91.3Dot dose (fC)1.5
Doses for MIBK:IPA=1:3 developer 60second. All values are good starting points, need dose test before each writing.Use the above area dose only for large features (>proximity effect range).Otherwise, e.g. when writing 1m stripes, 250C/cm2 is not enough.
Proximity effect factor b can be estimated (very roughly) from the above table:
Real dose D=E(1+b)E is as-exposed doseb is due to proximity effect
For line dose 1.3nC/cm, written line-width is 15nm.So area dose 1.3nC/(15nm1cm)=867C/cm2.Therefore, 1+b=867/250, so b=2.5 (not small)b=1.7 if estimated from the dot dose ((15nm)2 dot).
33
Slide34The most popular
commercial resist: Zep-520 (positive)
Developed by ZEON in Japan to replace PMMA.Higher sensitivity (3-5x faster), and higher etch resistance (3x)For ultrahigh resolution (sub-10nm), PMMA might still be better.Expensive: $1000/100ml.One-year shelf time, making it more expensive compared to PMMA.Composition: methyl styrene/chloromethyl acrylate copolymer.
Line in ZEP-520 written at 75keV.
Resist thickness 1.5
m, line-width 50nm
Developer:ZED-N50 (100% n-Amyl Acetate)Xylene (o-,m-,p- mixed)Solvent:Anisole, for liftoff or diluting the resist for thinner film.
34
Slide35HSQ: hydrogen silsesquioxane (negative)
Silicon dioxide based inorganic material (not polymer).
Sensitivity and contrast similar to that of PMMA (depends on developer strength).
Very high resolution and very dense pattern when using <25nm-thick film.Exposed HSQ is in the form of amorphous oxide, good etching mask.It is an unusual resist: development by chemical reaction (un-exposed HSQ reacts with diluted NH4OH or NaOH developer to produce H2), not by dissolution; and development “saturates” (i.e. no more reaction) after a certain time.Salty developer (add NaCl to NaOH solution) increases contrast.
35
HSQ structure,
Product of Dow Corning under product code Fox12™
Slide36Contrast curves of HSQ
Contrast curves of HSQ at different exposure energies
Contrast curves of HSQ at different development temperatures
Sub-10nm lines in HSQ
HSQ is not stable.
So spin-coating, baking, writing and development must be done quickly.
E.g. 1 hour delay for development can increase feature size by 60%.
It is worse for delay between sample preparation and e-beam writing.
Clark, “Time-dependent exposure dose of hydrogen silsesquioxane…”, JVST B, 24(6), 3073-3076 (2006).
36
High T
higher contrast
Slide37SU-8 (
very high sensitivity
, but low contrast)
Chemically amplified negative tone resistExtremely high sensitivity – over 100x that of PMMALow contrast (0.9), unsuitable for dense patterningHigh resolution possible for sparse patterns at high kVRough edges and “residues” due to random exposure from back scattering electrons and random photo-acid diffusion. (this is like shot noise for EUV resist that is also chemically amplified)Ideal for low resolution writing over large area (since it is fast).
10keV
Rough edge
50keV
100keV
24nm line at pitch 300nm in 100nm thick SU-8
Kristensen A, “High resolution 100 kV electron beam lithography in SU-8”, Microelectronic Engineering, 83, 1609-1612(2006)
37
High resolution
sparse
pattern
“residues”
Slide38Like all chemically amplified resist, post exposure baking temperature and time is very critical. Typically 90oC for 2-3min on hotplate.Spin-coating, bake, exposure, post-bake and development need to be done quickly without much delay.As it is so sensitive, don’t let it exposed to room light for long (will be exposed by UV light, even though room light has very little UV component in it).
38
SU-8 resist formulation and process
Glass transition temperature of SU-8
Un-cross-linked: 50
oC.Fully cross-linked: 230oC
Epoxy-based, mostly used as photo-resist
Slide39Undercut profile for liftoff
Metal liftoff process
Process of double layer stack for easy liftoff
39
PMMA
LOR
Microelectronic Engineering, 73-74, 278-281 (2004).
LOR contains PMGI plus additives
Slide4040
Extremely high resolution, since only primary (not secondary) high energy beam is responsible for exposure.
However, probably HSQ is the only useful inorganic resist.
Inorganic resists listed here: very thin film, making liftoff difficult; very low sensitivity, need long writing time.