/
Kim M. Cooke, Ed. Kim M. Cooke, Ed.

Kim M. Cooke, Ed. - PowerPoint Presentation

natalia-silvester
natalia-silvester . @natalia-silvester
Follow
403 views
Uploaded On 2016-08-03

Kim M. Cooke, Ed. - PPT Presentation

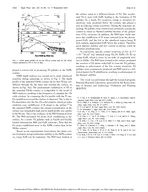
D Health and PE Specialist KimmCookecmsk12ncus An analysis of 20142015 BMI percentile scores for Charlotte Mecklenburg Schools in grades 38 PE teachers conduct pre and post fitness tests ID: 431135

students obese growth overweight obese students overweight growth bmi cms weight percentages average district rades healthy scores underweight teachers

Share:

Link:

Embed:

Download Presentation from below link

Download Presentation The PPT/PDF document "Kim M. Cooke, Ed." is the property of its rightful owner. Permission is granted to download and print the materials on this web site for personal, non-commercial use only, and to display it on your personal computer provided you do not modify the materials and that you retain all copyright notices contained in the materials. By downloading content from our website, you accept the terms of this agreement.


Presentation Transcript

Slide1

Kim M. Cooke, Ed.D.Health and PE SpecialistKimm.Cooke@cms.k12.nc.us

An analysis of 2014-2015 BMI percentile scores for Charlotte Mecklenburg Schools in grades 3-8Slide2

PE teachers conduct pre and post fitness tests

each year

PE teachers collect height and weight

of their students

PE teachers upload scores to Welnet

(online platform)

Health and PE Specialist conducts data analysis

Data Analysis Process:Slide3

Grades 3-8 Sample Sizes:

23,322

BMI Growth % Scores

62,198

Student Fitness Scores

119,473

Student Growth ScoresSlide4

2014-2015 BMI Growth Percentages: Grades 3-8 (23,322 student scores)

Healthy Weight: 60%

Obese Weight: 19%

Overweight: 17%

Underweight: 4%Slide5

36% of CMS students in grades 3-8 are overweight or obese. This is ABOVE the state average of 31%.Slide6

BMI Growth Percentages: Black8,363 students

Underweight: 2%

Healthy Weight: 58%

Overweight:

18%

Obese:

22%Slide7

40% of CMS Black students in grades 3-8 are overweight or obese. This is ABOVE the district average of 36%Slide8

BMI Growth Percentages: Hispanic4,988 students

Overweight:

19%

Obese:

31%

Healthy Weight:

48%

Underweight: 2%Slide9

50% of CMS Hispanic students in grades 3-8 are overweight or obese. This is ABOVE the district average of 36%Slide10

BMI Growth Percentages: White8,001 students

Healthy Weight:

72%

Obese:

10%

Overweight:

14%

Underweight: 4%Slide11

24% of CMS White students in grades 3-8 are overweight or obese. This is BELOW the district average of 36%Slide12

BMI Growth Percentages: Asian1,469 students

Healthy Weight:

63%

Obese:

15%

Overweight

16%

Underweight: 4%Slide13

31% of CMS Asian students in grades 3-8 are overweight or obese. This is BELOW the district average of 36%Slide14

BMI Growth Percentages: Multi-Racial499 students

Healthy Weight:

61%

Obese:

17%

Overweight

19%

Underweight: 4%Slide15

36% of CMS Multiracial students in grades 3-8 are overweight or obese. This is EQUAL to the district average of 36%Slide16

Overweight/Obese BMI Growth Percentages by Grade Level in CMS: (all above the state average of 31%)

3

rd

4

th

5

th

6

th

7

th

8th

35%37%

37%

37%

42%

36%Slide17
Slide18

District Recommendations:Create School Health TeamsIncrease Physical Education TimeEnsure 30 minutes of Daily recess

Increase Classroom Physical Activity

Promote Physical Activity OpportunitiesSlide19