PPT-Example: The arrival rate to a GAP store is 6 customers pe
Author : pamella-moone | Published Date : 2016-07-26
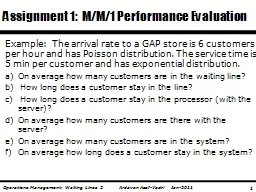
On average how many customers are in the waiting line How long does a customer stay in the line How long does a customer stay in the processor with the server On
Presentation Embed Code
Download Presentation
Download Presentation The PPT/PDF document "Example: The arrival rate to a GAP stor..." is the property of its rightful owner. Permission is granted to download and print the materials on this website for personal, non-commercial use only, and to display it on your personal computer provided you do not modify the materials and that you retain all copyright notices contained in the materials. By downloading content from our website, you accept the terms of this agreement.
Example: The arrival rate to a GAP store is 6 customers pe: Transcript
Download Rules Of Document
"Example: The arrival rate to a GAP store is 6 customers pe"The content belongs to its owner. You may download and print it for personal use, without modification, and keep all copyright notices. By downloading, you agree to these terms.
Related Documents