/
Figure 5: Figure 5:

Figure 5: - PowerPoint Presentation

pamella-moone
pamella-moone . @pamella-moone
Follow
365 views
Uploaded On 2016-07-17

Figure 5: - PPT Presentation

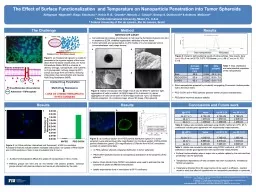
a Confocal section of mPEG particle distribution green in a tumor spheroid nuclei stained blue 40x magnification b Confocal section of PEGCOOH particle distribution green 20x magnification c Results from MCMC simulations overlaid on experimental data ID: 408736

peg tumor cells uptake tumor peg uptake cells results particles spheroid spheroids distribution drug mcmc cooh rate nanoparticles silica

Share:

Link:

Embed:

Download Presentation from below link

Download Presentation The PPT/PDF document "Figure 5:" is the property of its rightful owner. Permission is granted to download and print the materials on this web site for personal, non-commercial use only, and to display it on your personal computer provided you do not modify the materials and that you retain all copyright notices contained in the materials. By downloading content from our website, you accept the terms of this agreement.


Presentation Transcript