Explore
Featured
Recent
Articles
Topics
Login
Upload
Featured
Recent
Articles
Topics
Login
Upload
Search Results for 'figure plots'
figure plots published presentations and documents on DocSlides.
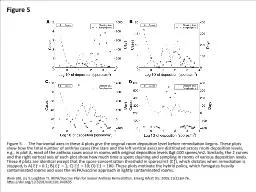
Figure 5 Figure 5. . . The horizontal axes in these 4 plots give the original room deposition level
by udeline
Wein LM, Liu Y, Leighton TJ. HEPA/Vaccine Plan for...
Chapter 5 Two-Dimensional Plots
by pasty-toler
5.0. This chapter will cover 2D (two-dimensional)...
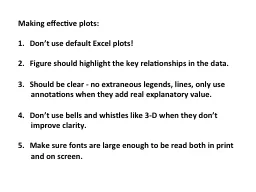
Making effective plots:
by alida-meadow
Don’t use default Excel plots!. Figure . should...
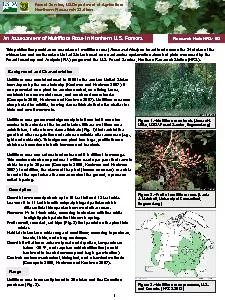
An Assessment of Multiflora Rose in Northern U.S. Forests
by valerie
1 Research Note NRSThis publication provides an o...
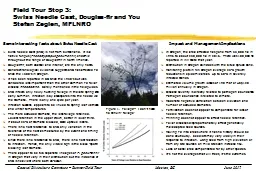
Field Tour Stop 3: Swiss Needle Cast, Douglas-fir and You
by debby-jeon
Stefan Zeglen, MFLNRO. Some interesting facts abo...
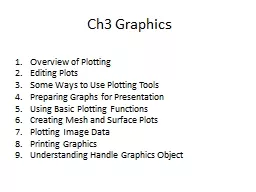
Ch3 Graphics Overview of
by briana-ranney
Plotting. Editing . Plots. Some Ways to Use Plott...
Getting Started with Plot.ly
by marina-yarberry
What IS Plot.ly?. Plot.ly. is an . open-source. ...
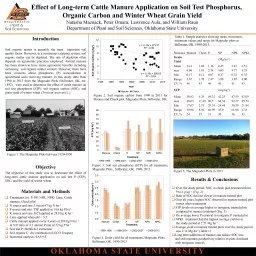
Effect
by ellena-manuel
of Long-term Cattle Manure Application on Soil Te...
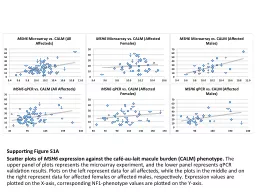
Supporting Figure S1A
by conchita-marotz
. Scatter plots of . MSH6. expression against t...
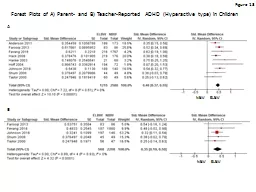
Figure 13
by celsa-spraggs
Forest Plots of A) Parent- and B) Teacher-Reporte...
GRAPHICS AND VISUALISATION WITH MATLAB
by cheryl-pisano
Part 1. UNIVERSITY OF SHEFFIELD. CiCS. DEPARTM...
Characterisation
by celsa-spraggs
of the BRDF (HDRF) of snow surfaces at Dome C, An...
clc ; clear all; close
by lindy-dunigan
all. Vr. = . linspace. (0.5,3,100);. figure(1);....
clc ; clear all; close
by min-jolicoeur
all. Vr. = . linspace. (0.5,3,100);. figure(1);....
Pensive – An application for Visualizing Continuous Spect
by sherrill-nordquist
Tom Parker. University of Alaska Anchorage. Tom P...
Illustrator lecture 2: how to use Adobe Illustrator with vector plots?
by sterialo
WAT-E2090 . Water and people. Matlab. Open demo2.m...
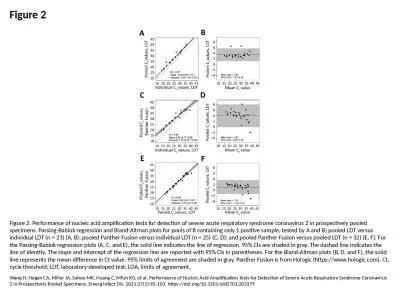
Figure 2 Figure 2. Performance of nucleic acid amplification tests for detection of severe acute re
by bitsy
Wang H, Hogan CA, Miller JA, Sahoo MK, Huang C, Mf...
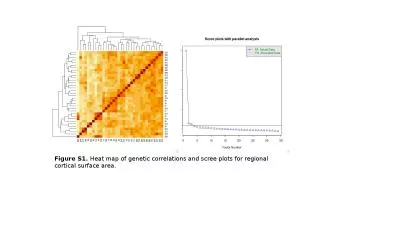
Figure S1. Heat map of genetic correlations and scree plots for regional cortical surface area.
by wang
Figure S2. . Heat map of genetic correlations and ...
cides Effective Products Protect Lettuce Macrophomina Disease in Tail
by callie
US Department of Agri-DOWNY MILDEW FUNGICIDESEFFEC...
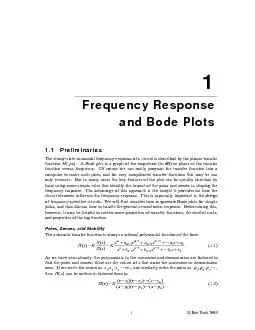
Frequency Response
by helene
1
Suppl. Figure 1.
by jane-oiler
Gene expression changes in cationic channels, fre...
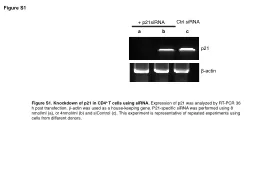
Ctrl
by phoebe-click
siRNA. + p21siRNA. a. b. c. p21. β-actin. Figure...
GLASS
by debby-jeon
. Plotting . Tips,Tricks. and Advice. Brett Sal...
Transitions from Oak to Maple Dominated Forests
by alexa-scheidler
in the eastern U.S. Abstract. Fire suppression, d...
Normal Probability Plots and Tests for tistics Department, The Pennsyl
by celsa-spraggs
Figure 1: Normal Probability PlotA normal probabil...
Load More...