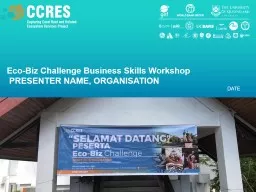
PRESENTER NAME ORGANISATION DATE Solutions Enhance amp diversify livelihoods Business Development Goal To increase the local capacity for knowledge and skills around business development and decision making in order to support the local economy and protect coastal ecosystems ID: 697077
Download Presentation The PPT/PDF document "Eco-Biz Challenge Business Skills Works..." is the property of its rightful owner. Permission is granted to download and print the materials on this web site for personal, non-commercial use only, and to display it on your personal computer provided you do not modify the materials and that you retain all copyright notices contained in the materials. By downloading content from our website, you accept the terms of this agreement.
Slide1
Eco-Biz Challenge Business Skills Workshop
PRESENTER NAME, ORGANISATION
DATESlide2
Solutions
Enhance & diversify livelihoodsSlide3
Business Development Goal
To increase the local capacity for knowledge and skills around business development and decision making in order to support the local economy and protect coastal ecosystemsSlide4
The EcoBiz ChallengeSlide5
The ‘inside in’ approach: Local solutions for local problems
3. Run the semi-finalist workshop around a framework
5. Local support network to
diffuse the innovations
2. Assess and select the
semi-finalists
4. Select the winners from proposals
1. Identify the new entrepreneursSlide6
Why?
Intended to attract local entrepreneurs aiming to start a new business
Encouraging
innovation
and
business development
that supports the local economy as well as
ecosystem services
Identify nascent entrepreneurs: those who have potential to create new ideas and opportunitiesSlide7
Desired Benefits
Boost sustainable enterprise development Help identify local entrepreneurs and outliersProvide business trainingSupport and encourage eco-friendly businesses
Advance the local economyGenerate new jobsRaise environmental awarenessSlide8
EcoBiz tool can be used by:
Local governments, NGOs, social enterprises, chambers of commerce, collectives and cooperatives, Universities, and other institutions Slide9
Entrepreneurship competition aimed at environmentally friendly enterprise development and sustainable livelihoods
Developing the tools and knowledge to support decision-making and new opportunities for business development through small scale entrepreneurship
EcoBiz
ChallengeSlide10
Eligibility
Residents (18+ years) are invited to submit applications with a proposed business idea that:Will operate on ‘name of community/region’Employ local residents
Is environmentally sustainable (benefits or supports coastal ecosystems) Slide11
Process
Top 25% of the applications selected as semi-finalists and invited to participate in a 3 day Business Camp (business skills training workshop)
Semi-finalists submit a business plan proposal. The final winners receive a one-time equity grant of
approx US$1000 to start or expand their business ideaSlide12
Examples of Eco-Biz Challenge ideas to date
Plate to garden to plate compost and fertiliser
Coconut eco-charcoal to replace mangrove charcoal
Native nursery to reduce take from forest
One Student,
One Mangrove
Plastic recycling and upcycling women’s cooperative
Marine sanctuary ecotourism
Giant bamboo plantation to replace illegally logged timber
Sustainable handicrafts
Eco-fuel switching for inboard engines
Mangrove ecotourism
Mangrove seedling nursery
Homestay/tour operator
Ecofriendly diving toursSlide13
Selayar (Indonesia)
El Nido (The Philippines)
Promotion and socialisation to 30+ villages across Selayar Creativity workshops – covered all barangay in El Nido, 85 participants
EcoBiz Challenge: 142 applications; Semi-finals - 43 participants in the 3 day workshop
EcoBiz Challenge – 56 applications; Semi-finals - 28 participants in the 3 day workshop
Participation to date Slide14
EcoBiz Challenge
Business Skills Workshop:Applying a framework for innovationSlide15
The EcoBiz Challenge Workbook
Distribute copies of Workbook Workbook follows 12 step format of workshopUse Workbook throughout workshopCompleted steps in Workbook form the basis of your final proposals Slide16
Public and Private Goods
Step 1Slide17
The TourbillonSlide18
We use a matrix to work out where a product or service sitsSlide19
Rarity
If one person's consumption of a good necessarily reduces another person's ability to consume it
Excludable If people (ordinarily, people who have not paid for it) can be prevented from using it
Low
High
Two parts of the matrix
A beach?Slide20
Four types of goods
Where should these go:
Air?Water?Fish?Slide21
Cheap and easy access for fishermen small scale fishing.
Large, expensive pelagic fishing – who can afford this?
Larger, more expensive but still small scale fishing.
Fishing vesselsSlide22
Example – innovative fishing net
Rival?
Excludable?
High
Low
High
Low
Private Goods
Public Goods
Common Goods
Collective Good
Source: https://ensia.com/features/nets-save-fish-bycatch/Slide23
Example – innovative fishing net
3
1
2
Make it cheap and very easy to access for fishermen in El Nido – but how do you fund it?
Make it expensive and only available to a few fishermen – but how will it help and who will buy it?
Make it reasonably priced and accessible – high sales and high benefit to environmentSlide24
Step 1 Task: Participants should plot their product or service on the public-private good matrix, then discuss how their idea could be developed so it covers each quadrant. Slide25
Viability:Assessing it and achieving it
Step 2Slide26
The TourbillonSlide27
Private Good
Societal/ Environmental
Value
Commercial Value
Low excludability
High excludability
Low rivalry
High rivalry
What type of value dominates?
Public GoodSlide28
Example –
innovative fishing net
3
1
2
Make it cheap and very easy to access for fishermen in El Nido – but how do you fund it?
Make it expensive and only available to a few fishermen – but how will it help and who will buy it?
Make it reasonably priced and accessible – high sales and high benefit to environment. Slide29
Fishing net example
1
23Slide30
Value
Risk
$$
Initial idea
Idea mapped out
Evidence the idea works
Getting ready to sell to customers
Final prototype
Managing risk
Market launchSlide31
Reducing your riskSlide32
Value
Risk
$$
Initial idea
Idea mapped out
Evidence the idea works
Getting ready to sell to customers
Final prototype
Market launch
How to get there?
How do you propose to get there?
How long will it take?
Who else is on the same path?
Are they ahead of you or behind you?
What will kill your value?
Your idea
Competitor
2
Competitor
4
Competitor
3
Competitor
1Slide33
9 Market launch
8 Final prototype
7 Getting ready to sell to customers
6 Showing potential customers it works
5 Testing your
product/service in the field
4 Testing your
product/service at home
3 Evidence the idea works
2 Idea mapped out
1 Initial idea
Technology Readiness Levels
Method for estimating the progression of your business ideaSlide34
Not commercially viable – so what?
Where do you sit?
?
??Slide35
Step 2 Task
: Participants discuss with their workgroup the commercial and societal value of their IP within each quadrant of the public/private goods matrix. Indicate where their product is on each scale. Slide36
Owning and protecting your ideas… and acknowledging who contributed to the ideas
Steps 3, 4 and 5
2017Slide37
The TourbillonSlide38
What is Intellectual Property?
“Intellectual property refers to creations of the mind: inventions, literary and artistic works, and symbols, names, images, and designs used in commerce.”
It is a productive new idea you create. This can be an invention, trade mark, design, brand or even the application of your ideaSlide39
Ideas?
These are all patentedSlide40
Coffee ideas
40Slide41
41
Fly Swatters
Any market you enter will be crowded.Slide42
Types of intellectual property
Patents
Method of manufacture
Trade Mark ®
The name
Designs
The shape
Plant Variety Rights
The hemp plant for the fibre
Copyright ©
Art on explanation and packaging
Trade Mark ™
The logo
Circuit Layouts
The electronics in the manufacturing equipment control
Trade Secret
The information used to design the net
Example:
Our fishing net Slide43
Copyright v Trade Mark
CopyrightThe moment an idea or creative concept is documented on paper or electronically it is automatically protected by
copyright in most countries.Copyright protects the original expression of ideas, but not the ideas themselves. Trade Mark
A trade mark is a way of identifying a unique product or service. Sometimes referred to as a brand, it can help customers discern the quality of your product or service over that of your competitors.
A trademark is not just ‘a logo’. It can be a letter, number, word, phrase, sound, smell, shape, logo, picture, movement, aspect of packaging, or a combination of these
(Source: IP Australia)Slide44
Well known
international brands
Trade Marks – Filipino BrandsSlide45
Ownership – some questions to ask yourself
Who actually owns the idea that is at the core of your product/service?
Where did it come from?How did you develop it?Do you need to give someone else the credit for the idea?
Should they be included in the protection?What will happen if they are not included?Slide46
Acknowledging others’ contribution
This can be done formally by sharing ownership, or simply giving credit to the person with the idea
It can be done informally by talking to the person(s) who had the idea and making sure it is alright to proceed
NEVER proceed with an idea when you know someone else has contributed without getting clearance from them first Slide47
Steps 3, 4 & 5 Task: Participants identify who has contributed to their business idea. Slide48
Development cycle
Step 6Slide49
The TourbillonSlide50
Ideas are great, but you need to do something with them to realise their value.Development cycles are all of the activities that need to occur to get your idea from your head to the market.
Development cyclesSlide51
Key activities at each stage of the development cycle
Creative idea generation
Tourbillon
Testing the idea – at home, with friends
Building the production process
Build final working version ready for production
Packaging, marketing, distribution, sales, negotiations, licensees, shop front, etc. Slide52
You want to be here
Questions to ask yourself:
Where are you now (viability)?
How far do you want to take it yourself (exit strategy)?
By when (development cycle)? With whom (collaborators)?
With whose help (advice and support)?
What will it cost (financials)?
Moving up through the
Technology Readiness Levels
9 Market launch
8 Final prototype
7 Getting ready to sell to customers
6 Showing potential customers it works
5 Testing your
product/service in the field
4 Testing your
product/service at home
3 Evidence the idea works
2 Idea mapped out
1 Initial idea
You are here
How long will it take?Slide53
Value
Risk
$$
Initial idea
Idea mapped out
Evidence the idea works
Getting ready to sell to customers
Final prototype
Managing risk
Market launch
Risk
You are here
You want to be here
TRL9
TRL1Slide54
Realistic timelines
Development cycle – how long, how much, how hard, how complex?Slide55
How long will each stage take?
How much will each stage cost??
?
?
?
?
?
?
?
?
?
?
?Slide56
Step 6 Task: Participants identify key activities at each stage of the development cycle. Participants should also indicate where they are on the Technology Readiness Level thermometer. Slide57
Advice and Support
Step 7Slide58
The TourbillonSlide59
What is your skill set?
Are you an entrepreneur or an inventor? These are very different people.
Inventors
Private
Funding source
Innovation driver
Public/
Taxpayers
Solving a problem
Meeting a market need
Entrepreneurs
Researchers
InnovatorsSlide60
Why collaborate?
Different skills for different tasks
Make better commercial viability judgements
Access to more resources.
Increase development speed
Effective search for competitor technologies
Better knowledge of the market
Access to industry partners
Understand hurdles before you encounter them
Increase your chances of commercial success
Get me there
System Test, Launch & Mission Operations
System/Subsystem Development
Technology Demonstration
Technology Development
Research to Prove Feasibility
Basic/Applied ResearchSlide61
How much knowledge do you have?
Who has the knowledge you need?What are your strengths and weaknesses?
Who can you afford?How good is your network?Who do you trust?
Who will you need, when?
Questions to ask yourself (before someone else does):Slide62
Advice and support along the development cycle
Banks and investors
Government Agency
Family, Friends and Fools
Non-government
organizations
Local
Economic
Development
Community
Local
Government
Accountant
Business advisors
Legal
Management and Financial ConsultancySlide63
Advice and support along the development cycleSlide64
Funding options
Government Grants
Micro credit/ micro finance
Sales?
Bank loan?
Own Money: Friends & Family
This will only be available when you are already selling your product/service on the marketSlide65
Step 7 Task: Participants consider what skills and experience they have; what skills and experience are needed to bring their idea to its market/audience; where will that come from; what will it cost? Slide66
Markets and Customers
Step 8Slide67
The TourbillonSlide68
Having a great idea isn’t often enough:
You need customers to buy your productOthers will also be vying for those customers
You need to understand what’s going on ‘out there’ not just ‘in here’The market is very important
Markets and CompetitorsSlide69
The Valley of Death
Cash Flow
Successful
Moderately successful
Unsuccessful
Unsuccessful
Valley of Death
Negative
PositiveSlide70
Source:
http://www.thomascrampton.com/wp-content/uploads/china-social-media-equivalents.png
Find your competition in their market segments – social media exampleSlide71
Defining your market size
Middle Market –
e.g. Palawan market
Micro Market –
e.g. El Nido market
Macro Market –
e.g. National market in your fieldSlide72
Markets and segments
Try to keep similar market segments together on the map. Slide73
Step 8 Task: Estimate the size of the market at each market level (micro, middle, macro). Identify the market segments and competitors in each. Slide74
Competitors and Collaborators
Step 9Slide75
The TourbillonSlide76
Research data that clearly proves the value of your technology compared to existing products or methods
Create the “million dollar slide”
Source: Joe McLean
The Killer ExperimentSlide77
Source: Joe McLean
Our fishing net example
Percentage of small fish saved
Percentage of small fish savedSlide78
Is there a competitor with complimentary ideas/products/processes?
Is there a company in the middle market but not the micro market? They might want to work with you to compete more effectively?
Is there a competitor with a large product range but not one in your area?
Use the Killer Experiment to identify
potential collaboratorsSlide79
Source: Joe McLean
The tool: The Killer ExperimentSlide80
Step 9 Task 1: Participants identify key features of their idea – For each, consider what is better, how much better, and how will competitors react? Slide81
S
tep
9 Task 2: Identify possible competitors and collaborators. Slide82
S
tep
9 Task 3: Plot on the graph the performance of your product compared with your competitors’ products. Slide83
Pathways to Market
Step 10Slide84
The TourbillonSlide85
How important is keeping control of your idea
Pathways
How much risk are you prepared to take on
None
Some
A lot
Not
Somewhat
VerySlide86
PathwaysSlide87
Two core considerations: the pathway that best suits the characteristics of the product, process or service, and the appetite of the controlling organization for risk and its desire to retain control.
Vertical axis: Commercialisation risk.
Low end = Options such as outright sale or licensing of IP shift the risk to a third party, meaning minimal risk. High end = Options such as forming a start-up company.
Heavy management load and potential for heavy losses.
Horizontal axis: Level of control retained.
Low end = Outright sale and licensing. Licensee gains high level of control over IP and
commercialisation
, creating institution is a relatively passive partner.
High end = In-house production, start-ups. High level of control retained.
Where does your institution sit on the axis? Is retaining a high level of control important to you?
Do your decisions reflect your appetite for risk and desire for control? If not, why?Slide88
Fisherman
FishermanFishermanFisherman
CollectorTraderLocal Wholesaler
Retailer
Local ConsumerRegional
International
Collector
Trader
Local Wholesaler
Retailer
International Consumer
International trader
Cooperative - International
International Consumer
Fisherman
Without Middle Man
Local Consumer
Cooperative - Domestic
Consumer
Cooperative
Wholesaler
Other cities
Fisherman
Collector
Local Wholesaler
Retailer
Local Consumer
Local
Cooperative
Sustainable International Wholesaler
Where do you fit in your supply chain?Slide89
Step 10 Task: Participants identify which pathway to market is suitable for their business idea. Slide90
The three horizons
Step 11Slide91
The TourbillonSlide92
The Three Horizons Model –
planning your technology trajectorySlide93
Slide94
For a business
For a product/serviceSlide95
Match the horizons to your timelineSlide96
Step 11 Task: Participants brainstorm their three horizons and discuss in their workgroup. Slide97
Step 12
Financials and Exit StrategiesSlide98
The TourbillonSlide99
Why do financials come last?
Understanding and being able to compile and confidently present the financials for a new idea/product/service is absolutely critical to its success.
However financials should be a reflection of everything else in the feasibility assessment. That means every statement and decision in every step should be discernible in the financial statements.So it is the glue that binds all the other steps, and essential for validating and cross-referencing everything across the feasibility assessment. Slide100
Managing riskSlide101
Profit and Loss for XYZ business
1 July 2018 - 30 June 2019
2018-2019
Total Revenue/Sales
100,000
Cost of Goods Sold
Direct materials
10,000
Direct labour
15,000
Manufacturing overhead
3,000
Indirect labour
2,000
Other manufacturing overheads
0
Net Cost of Goods Sold
30,000
Gross Profit
70,000
Operating Expenses
Research and Development
20,000
Selling, general and administrative
30,000
Total Operating Expenses
50,000
Operating Income or Loss
20,000
Income from Continuing Operations
Interest expense
30,000
Income tax expense
2,000
Net Income from Continuing Operations
(12,000)
Non-recurring events
1,000
Discontinued operations
1,000
Extraordinary items
Net Income
(14,000)Slide102
Parts of the Balance Sheet
Source:
http://onlineaccountreading.blogspot.com.au/2014/06/balance-sheet.html#.WK-pnPl94UE Slide103
$
$
ASSETS
Non-current assets
2,150,000
Land and buildings
2,000,000
Furniture
12,000
Machinery
18,000
Investments
120,000
Current assets
10,000
Inventory
1,000
Debtors/receivables
3,200
Cash at bank
5,800
2,160,000
TOTAL ASSETS
OWNER’S EQUITY AND LIABILITIES
Owner’s equity
1,700,000
Capital
1,700,000
Non-current liabilities
440,000
10% Loan
440,000
Current Liabilities
20,000
Creditors/payables
20,000
TOTAL EQUITY AND LIABILITIES
2,160,000
Balance Sheet for XYZ business
30 June 2019Slide104
Matching horizons to sales and product life cycles. An example:
2018-2019
2019-2020
2020-2021
2021-2022
Product One
Price
10,000
10,000
8,000
7,000
Unit sales
20
40
50
40
Market share
1%
1.5%
1.5%
1.5%
Product Two
Price
12,000
12,000
10,000
Unit sales
40
80
100
Market share
2%
3.5%
5%
Product Three
Price
5,000
Unit sales
200
Market share
2%
Total Sales
200,000
880,000
1,360,000
2,280,000
Product 1 (P1) comes on stream, with sales building and then falling away as it gains some traction in the market and funds the Horizon 2 product. P2 leverages the success of P1 by building sca
l
e and revenues faster. P3 may utilise new technology for lower cost, higher scale production and generate rapid revenues to offset the decline from P1. So the business builds across products and generations. Slide105
Matching horizons to sales and product life cycles
An example:
2018-2019
2019-2020
2020-2021
2021-2022
Product One
Price
10,000
10,000
8,000
7,000
Unit sales
20
40
50
40
Market share
1%
1.5%
1.5%
1.5%
Product Two
Price
12,000
12,000
10,000
Unit sales
40
80
100
Market share
2%
3.5%
5%
Product Three
Price
5,000
Unit sales
200
Market share
2%
Total Sales
200,000
880,000
1,360,000
2,280,000Slide106
Product 1: comes on stream with sales building, falls away as it gains traction in market and funds horizon 2 product.
Product 2: leverages success of P1 by building scale and revenues faster.
Product 3:
utilises
new technology for lower cost, higher scale production and generate rapid revenues to offset the decline from P1.
Business builds across products and generations
Looks like short development cycle, cash flow-based business.
Optimistic, but not unheard of!
Matching horizons to sales and product life cycles
An example:Slide107
Exercise: Icons from all stepsSlide108Slide109
Exit strategies can be established through growth, through trade sale, through dilution of equity, succession, management buy-out/management buy-in, receivership/voluntary administration, liquidation, or just walking away.
Exit StrategiesSlide110
Step 12 Task 1: Create a profit and loss sheet, taking into account costs at each stage of the development cycle.
Step 12 Task 2: Choose the exit strategy that will give you the return you want when you need it. Explain your choice.Slide111
Preparing for your 3 minute pitchSlide112
The proposal
Copies of the proposal have been provided Follows the 12 step format of the workshopForms the first plan for the business Slide113
CONNECT WITH US
CAPTURING CORAL REEF AND RELATED
ECOSYSTEM SERVICES
Join our community
@
CCRESnet
ccresnet