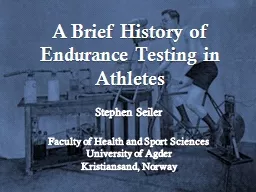
Stephen Seiler Faculty of Health and Sport Sciences University of Agder Kristiansand Norway Two historical roads to modern endurance testing 1 Using exercising athletes to better understand human physiology ID: 274713
Download Presentation The PPT/PDF document "A Brief History of Endurance Testing in ..." is the property of its rightful owner. Permission is granted to download and print the materials on this web site for personal, non-commercial use only, and to display it on your personal computer provided you do not modify the materials and that you retain all copyright notices contained in the materials. By downloading content from our website, you accept the terms of this agreement.
Slide1
A Brief History of Endurance Testing in Athletes
Stephen Seiler
Faculty of Health and Sport Sciences University of
Agder
Kristiansand, NorwaySlide2
Two historical roads to modern endurance testing
1. Using exercising athletes to better understand human physiology2. Using human physiology to better understand how to train athletesSlide3
Endurance Capacity ModelSlide4
The very, very beginning?
Cornelius
Drebbel
1572-1633
Dutchman who built a submarine that rowed up the Thames in 1621 and stayed
underwater for up to 3 hours. Probably used oxygen generated by burning potassium
nitrate to keep rowers from becoming hypoxic during exercise.Slide5
First “laboratory exercise test”?
Antoine Lavoisier (1743-1794)
Measured increased consumption of “vital air” during sustained exercise
Foot pedal
Breathing
mask
Oxygen recovery
system
Photos and labels courtesy of Prof. Frank KatchSlide6
Key elements of the endurance testing evolution
Physiological limitations and connections revealed
Devices developed to apply measurable workloads-
ergometry
Instruments developed for practical, valid physiological measurementsSlide7
SwedenUSAEngland
Denmark
Role
mouse
pointer over
dots
for links to
other
interesting
articles
about
labs and
people
highlighted
in
this
presentationSlide8
Maximal oxygen consumptionSlide9
Stroke volume comes into focus
“The stroke volume of the heart is….the most important quantitative function of the whole body…. ….for the amplitude of the heart’s volume change multiplied by the pulse rate gives the total volume of arterial blood supplied to the entire body”. Yandell Henderson, 1923 Yale University physiologist
Q = HR
x
SVSlide10
Connecting cardio-pulmonary function to muscular work
”….the lungs, heart and circulation should be thought of as a single apparatus for the transfer of oxygen and carbon dioxide between the atmosphere and the working tissues.”Lawrence J. Henderson, 1929
founder of the Harvard Fatigue LaboratorySlide11
The Harvard Fatigue Lab 1927-1947
Established by the Harvard Business School at a time when human factors in industrial factories was a major interest.Performed wartime research on nutrition and environmental factors.Exercise was one of several stresses such as heat and high altitude that were studied.
Over 350 publications, but greatest contribution was a generation of “exercise physiologists” who built up research programs all over the United States and Europe.
David Bruce DillSlide12
“
Fatigometer”Harvard Fatigue LabSlide13
”The VO2max” is born (1923-25)
Demonstrated that oxygen uptake increased linearly with running speed, but eventually….”reaches a maximum beyond which no effort can drive it.”
Archibald
Vivian (AV) Hill
1886-1977Slide14
VO2max testing becomes standardized- 1955
Taylor, HL, Buskirk, E. and Henschel, A. Maximal oxygen intake as an objective measure of the
cardiorespiratory
performance.
J. Applied Physiology
8:73-80, 1955.
Laboratory of Physiological Hygiene, University
of Minnesota. USA
“
During the Second World War, this laboratory studied the relationships between performance in its broadest
sense and biological stress.”Slide15
Taylor et al. findings:
Mouthpiece diameter- limitations on
ventilation
Speed
vs
grade
changes
for
eliciting
VO
2
plateau
on
treadmill
Importance
of warm-up
Temperature conditions- Not too
hot Test-retest reliability- Standard error
of ~2.5% Criteria
for identification of a plateau
in VO2 Slide16
Legs only or arms+legs?
Taylor, HL,
Buskirk
, E. and
Henschel
, A. Maximal oxygen intake as an objective measure of the
cardiorespiratory
performance.
J. Applied Physiology
8:73-80, 1955.Slide17
The Swedish InfluenceGIH-
Gymnastik och idrettshögskolan (founded 1813)
Karolinska
Institute (founded 1810)
Integrated physiological and performance focus; dozens of classic studies published
Photo courtesy of Prof. Frank KatchSlide18
Per Åstrand & Bengt Saltin
Scientific
Citations
as
of
Nov 2011*
Åstrand
: 140+
publications
>6,000
citations
H
factor
35
Saltin: 340+
publications
>21,000
citations
H
factor
76
Photos provided courtesy of Prof. Frank KatchSlide19
The Åstrand laboratory
The
treadmill
used in
early
studies
The
very
first Monark
cycle
ergometer
Scholander
apparatus
for
measuring
oxygen
concentration
in gas samples
A
picture
of
the
front cover
of
Bengt
Saltin’s
doctoral
dissertation
. He
was
Åstrand’s
first
PhD
student.Slide20
PO
Åstrand & Bengt Saltin
Maximal oxygen uptake and heart rate
In various types of muscular activity
J. Appl. Physiol. 16(6):977-981, 1961
Demonstrated that running was sufficient to elicit the maximal oxygen consumption
Arms + legs did not further increase VO
2
Swimming or arms-only activity was insufficient to elicit VO2max
VO
2
peak
concept born?Slide21
Saltin
B & Åstrand PO. Maximal
oxygen
uptake
in
athletes
. J.
Appl
.
Physiol
.
23(3), 1967.Slide22
Most important Norwegian contribution to endurance testing?
PF Scholander.
Analyzer
for
accurate
estimating
of
respiratory
gasses in
one-half
cubic
centimeter
samples
. J. Biol.
Chem
.
167:235-2359, 1947.
Figure
above
from McArdle,
Katch, & Katch, Exercise Physiology. 7th ed.Slide23
THEN
NOW
Photo provided by Prof. Frank Katch
Photo provided by Dr. AG
ZapicoSlide24
Fractional O2 utilizationSlide25
August Krogh (1879-1949) Denmark
Krogh established one of first exercise physiology laboratories
Built accurate bicycle ergometer already by 1910
Measured gas exchange (RER) during exercise of different
intensities with great accuracy. Early forerunner to
LT testing
testingSlide26
Early connections between exercise and lactic acid
Swedish chemist Berzelius detected blood lactate in ”exercised” deer (1808).
Englishman AV Hill connected lactic acid production to muscle contraction (1922).
German Otto
Meyerhoff
associated increase in lactate concentration with muscle fatigue in frog muscle (1922).
Margaria
and Dill – Formulated oxygen debt hypothesis (1933).
O. Bang- Showed that lactate production and removal were continuous (1936).
Norwegian Lars
Hermansen
(1972). Explained lactate appearance and removal responses. Slide27
R.
Margaria
Lactate seen as a
metabolic dead end
produced only under
tissue hypoxia. This
view would live on into
the 80s.
David Dill and Harry Edwards
in Panama
1933Slide28
Who invented the ”anaerobic”/lactate threshold test?
Karlmann Wasserman, 1964?
Wildor
Hollmann
, 1959
(
unpublished
congress
presentation
)Slide29
Threshold yes, but anaerobic
?
Wasserman
, K,
Whipp
BJ,
Koyal
, SN,
Beaver
WL.
Anaerobic
threshold
and
respiratory
Gas
exchange
during
exercise
. J.
Applied
Physiol. 35(2):1973.Slide30
”The anaerobic threshold
is a useful concept.”in
Wasserman
et al, 1973.
~ 5,500 studies
involving
terms
anaerobic
threshold
-
or
lactate
threshold
published
since
!Slide31
A dear child has many names
Point
of
Optimal
Respiratory
Efficiency
(
Hollman
, 1959)
Anaerobic
Threshold
(
Wasserman
, 1964)
Aerobic-Anaerobic
threshold
(
Mader
, 1976)
Aerobic
Threshold (
Kindermann, 1979)Individual
Anaerobic
Threshold (IAT, Stegmann and Kindermann, 1981)Respiratory
Compensation Point (Beaver, Whipp, &
Wasserman, 1986)Onset of
Blood
Lactate
Accumulation
(OBLA,
Sjodin
& Jakobs, 1981)
Maximal
Lactate
Steady State (MLSS,
Mader
and
Heck
, 1974-86)Slide32
Heck
, H, Mader, G., Hess, S., Muller, R., and Hollmann W. Justification
of
the
4
mmol/l
Lactate
Threshold
. Int. J. Sports Med. 6:117-130, 1985.Slide33
The
Maximal Lactate Steady State A. Mader
& H.
Heck
, 1974-1986
Later studies have
shown
that
MLSS
bLa
conc
.
can
vary
between
3
and 10
mmol/L
due to
Individual differencesActive muscle
massdifferences (run vs
cycle)Slide34
3- Intensity Zone Model
Exercise Intensity
[La
-
]
LT
2
(MLSS)
VT
2
LT
1
VT
1Slide35
Work efficiency/economySlide36
Derek Clayton, 2:08:34 in 1969
VO2max 70 ml.min.kg
-1
, LT 86% of VO2max
His
barrier
breaking
performances
could
only
be
explained
by a
high
running
economy
to
compensate
for his good but not
great maximal oxygen consumption
.Slide37
Efficiency/Economy testing
David L. Costill, H. Thomason, & E. Roberts. Fractional utilization of the aerobic capacity during distance running. Med. Sci. Sports.
Exerc
. 5(4):248-252, 1973.Slide38
Costill
DL et al. Fractional utilization of the aerobic capacity during distance running. Med Sci Sports 5(4), 248-252, 1973.
Two athletes
with same
performance
time but 14%
difference in
estimated
oxygen costSlide39
David Costill- leads a new generation of applied sport scientists in 70’s-80’sSlide40
No change
in VO2max
1992
2003
25% increase in velocity at 2mM blood lactate
15% improvement
in running
economy
2:15:25 WR Marathon
Jones, AM. Int. J. Sports Science &
Coaching
1(2), 2006.Slide41
Anaerobic CapacitySlide42
Evolving measurement toolsSlide43
Sport specific ergometrySlide44
New technology moves testing out of labSlide45
Do all athletes and their coaches NEED laboratory testing to train best and WIN? Slide46
Conclusions
Laboratory testing of endurance athletes has a ~100 year history.Most of what we now know was established between 1950 and 1980; best practice has not changed meaningfully.Modern testing is faster, more convenient and potentially more sport specific, but not more accurate.
We are indebted to many extremely smart and innovative ”forefathers” who paved the way for modern physiological testing of athletes.