PPT-Spatial Analysis Using Grids
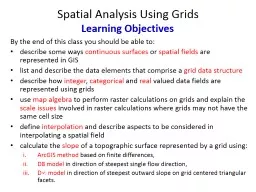
By the end of this class you should be able to describe some ways continuous surfaces or spatial fields are represented in GIS list and describe the data elements
Download Presentation
"Spatial Analysis Using Grids" is the property of its rightful owner. Permission is granted to download and print materials on this website for personal, non-commercial use only, provided you retain all copyright notices. By downloading content from our website, you accept the terms of this agreement.
Presentation Transcript
Transcript not available.