
Chapter 1: Introduction to Business Analytics
PM
Published · 28 slides · 0 views
1 / 1
Description
Chapter 1: Introduction to Business Analytics Business Analytics: Methods, Models, and Decisions, 1st edition James R. Evans Copyright 2013 Pearson Education, Inc. publishing as Prentice Hall 1-1 Copyright 2013 Pearson Education, Inc.
Related Topics
Share
Embed code
Download this presentation From Below
"Chapter 1: Introduction to Business Analytics" is the property of its rightful owner. Permission is granted to download and print the materials on this website for personal, non-commercial use only, and to display it on your personal computer provided you do not modify the materials and that you retain all copyright notices contained in the materials. By downloading content from our website, you accept the terms of this agreement.
Presentation Transcript
01
Chapter 1:
Introduction to Business Analytics Business Analytics: Methods, Models,
and Decisions, 1st edition
James R. Evans Copyright © 2013 Pearson Education, Inc. publishing as Prentice Hall 1-1<br>
and Decisions, 1st edition
James R. Evans Copyright © 2013 Pearson Education, Inc. publishing as Prentice Hall 1-1<br>
02
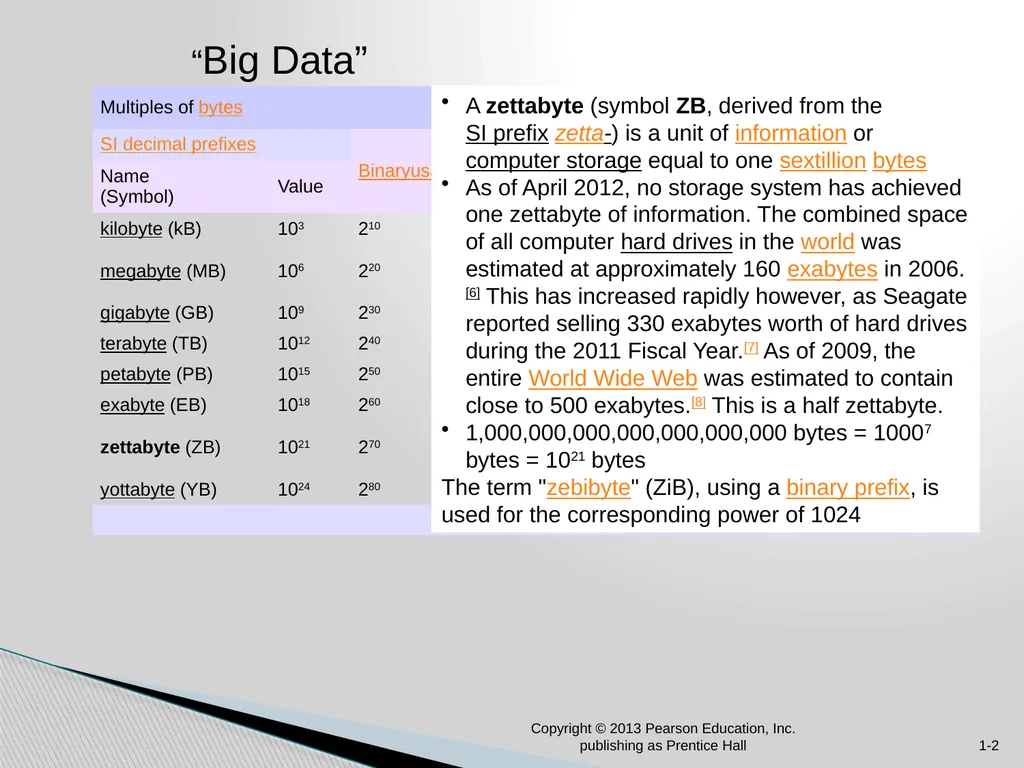
Copyright © 2013 Pearson Education, Inc. publishing as Prentice Hall 1-2 A zettabyte (symbol ZB, derived from the SI prefix zetta-) is a unit of information or computer storage equal to one sextillion bytes
As of April 2012, no storage system has achieved one zettabyte of information. The combined space of all computer hard drives in the world was estimated at approximately 160 exabytes in 2006.[6] This has increased rapidly however, as Seagate reported selling 330 exabytes worth of hard drives during the 2011 Fiscal Year.[7] As of 2009, the entire World Wide Web was estimated to contain close to 500 exabytes.[8] This is a half zettabyte.
1,000,000,000,000,000,000,000 bytes = 10007 bytes = 1021 bytes
The term "zebibyte" (ZiB), using a binary prefix, is used for the corresponding power of 1024 “Big Data”<br>
As of April 2012, no storage system has achieved one zettabyte of information. The combined space of all computer hard drives in the world was estimated at approximately 160 exabytes in 2006.[6] This has increased rapidly however, as Seagate reported selling 330 exabytes worth of hard drives during the 2011 Fiscal Year.[7] As of 2009, the entire World Wide Web was estimated to contain close to 500 exabytes.[8] This is a half zettabyte.
1,000,000,000,000,000,000,000 bytes = 10007 bytes = 1021 bytes
The term "zebibyte" (ZiB), using a binary prefix, is used for the corresponding power of 1024 “Big Data”<br>
03
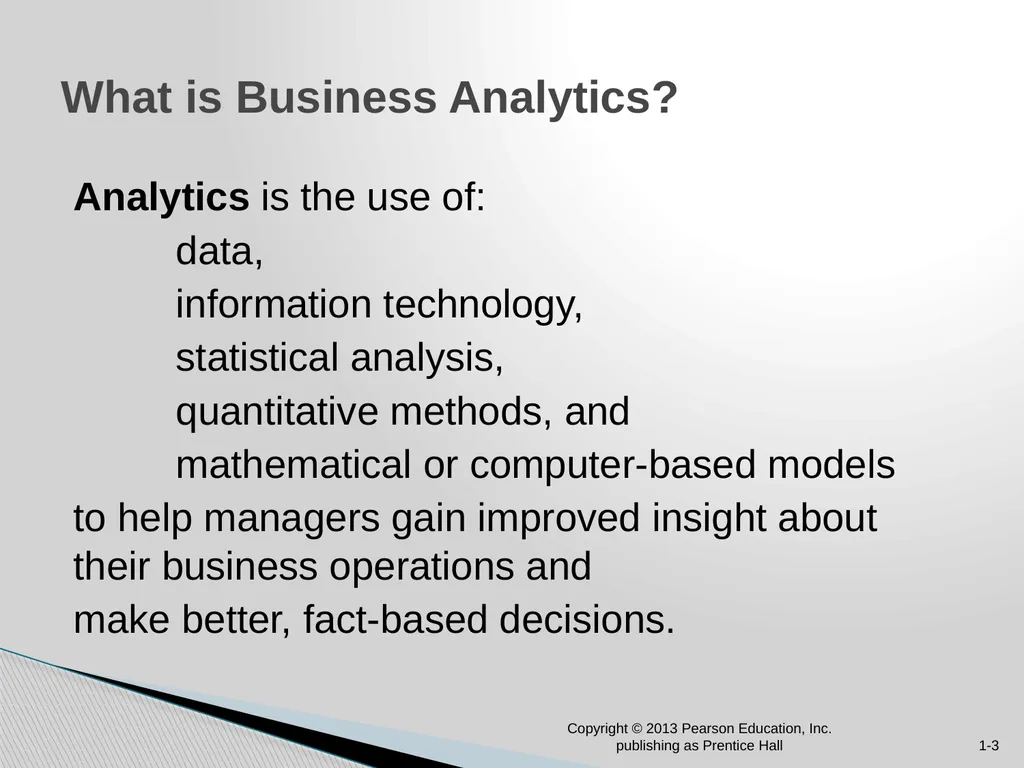
Analytics is the use of:
data,
information technology,
statistical analysis,
quantitative methods, and
mathematical or computer-based models
to help managers gain improved insight about their business operations and
make better, fact-based decisions. What is Business Analytics? Copyright © 2013 Pearson Education, Inc. publishing as Prentice Hall 1-3<br>
data,
information technology,
statistical analysis,
quantitative methods, and
mathematical or computer-based models
to help managers gain improved insight about their business operations and
make better, fact-based decisions. What is Business Analytics? Copyright © 2013 Pearson Education, Inc. publishing as Prentice Hall 1-3<br>
04
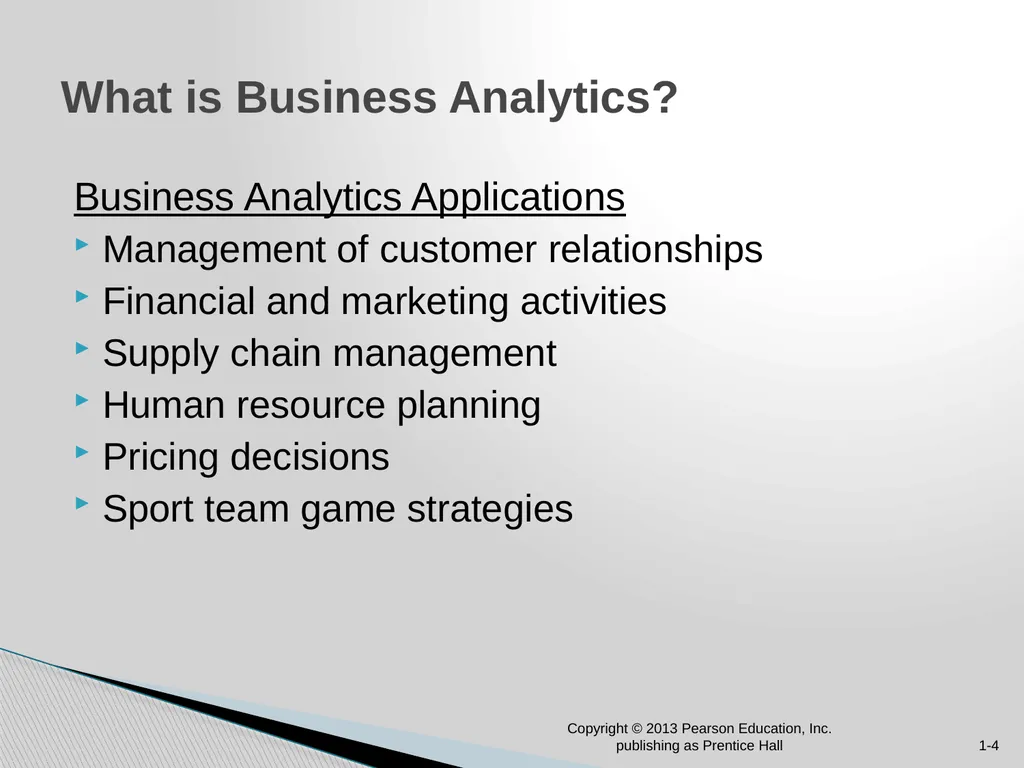
Business Analytics Applications
Management of customer relationships
Financial and marketing activities
Supply chain management
Human resource planning
Pricing decisions
Sport team game strategies What is Business Analytics? Copyright © 2013 Pearson Education, Inc. publishing as Prentice Hall 1-4<br>
Management of customer relationships
Financial and marketing activities
Supply chain management
Human resource planning
Pricing decisions
Sport team game strategies What is Business Analytics? Copyright © 2013 Pearson Education, Inc. publishing as Prentice Hall 1-4<br>
05
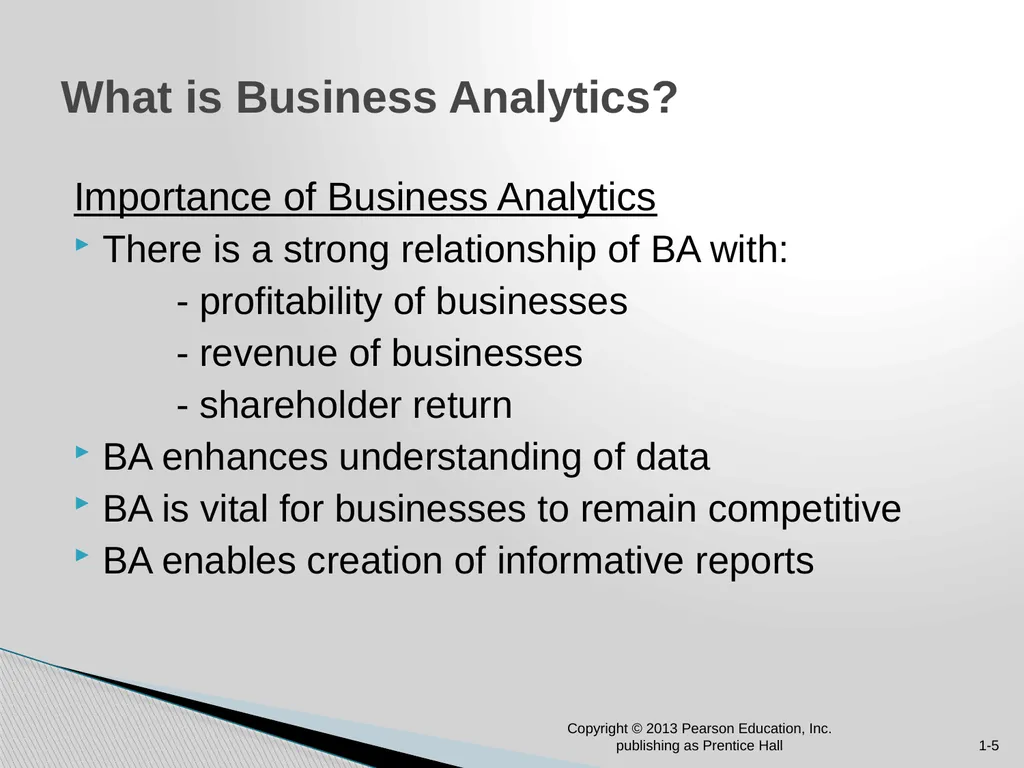
Importance of Business Analytics
There is a strong relationship of BA with:
- profitability of businesses
- revenue of businesses
- shareholder return
BA enhances understanding of data
BA is vital for businesses to remain competitive
BA enables creation of informative reports What is Business Analytics? Copyright © 2013 Pearson Education, Inc. publishing as Prentice Hall 1-5<br>
There is a strong relationship of BA with:
- profitability of businesses
- revenue of businesses
- shareholder return
BA enhances understanding of data
BA is vital for businesses to remain competitive
BA enables creation of informative reports What is Business Analytics? Copyright © 2013 Pearson Education, Inc. publishing as Prentice Hall 1-5<br>
06
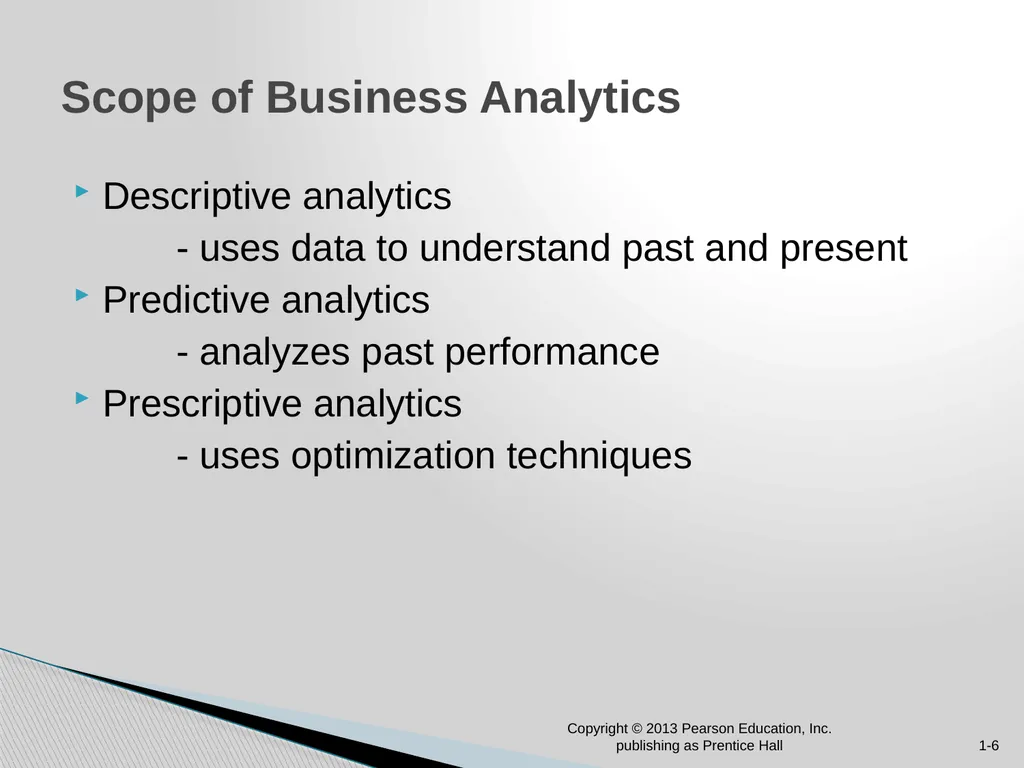
Descriptive analytics
- uses data to understand past and present
Predictive analytics
- analyzes past performance
Prescriptive analytics
- uses optimization techniques Scope of Business Analytics Copyright © 2013 Pearson Education, Inc. publishing as Prentice Hall 1-6<br>
- uses data to understand past and present
Predictive analytics
- analyzes past performance
Prescriptive analytics
- uses optimization techniques Scope of Business Analytics Copyright © 2013 Pearson Education, Inc. publishing as Prentice Hall 1-6<br>
07
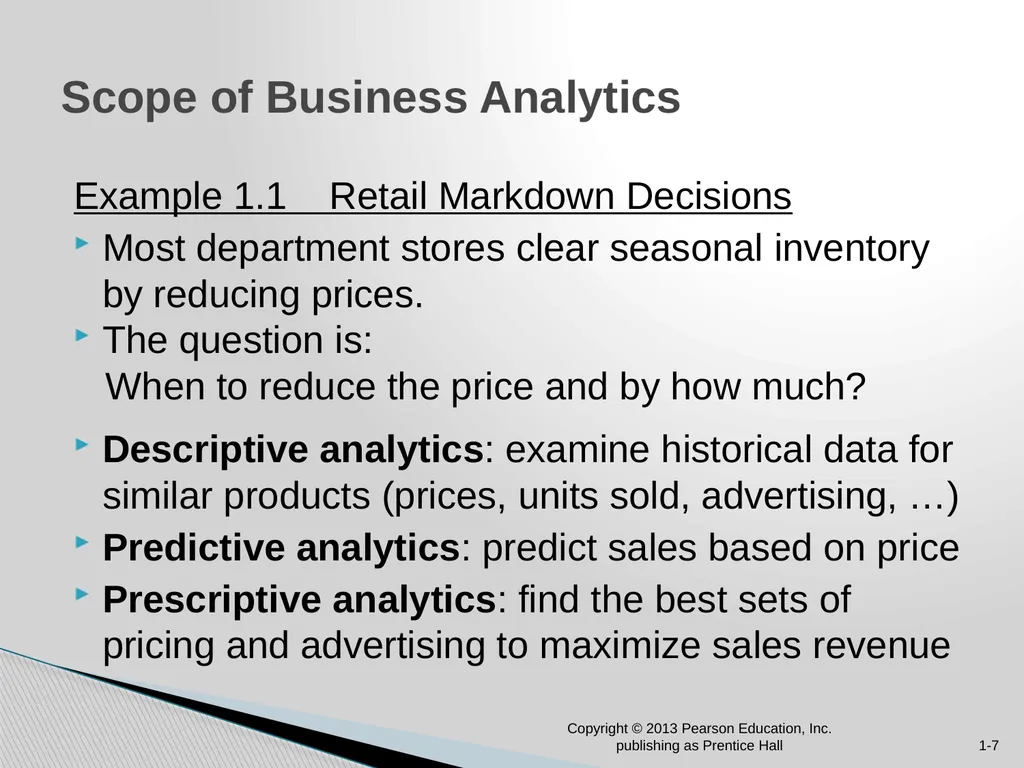
Example 1.1 Retail Markdown Decisions
Most department stores clear seasonal inventory by reducing prices.
The question is:
When to reduce the price and by how much?
Descriptive analytics: examine historical data for similar products (prices, units sold, advertising, …)
Predictive analytics: predict sales based on price
Prescriptive analytics: find the best sets of pricing and advertising to maximize sales revenue Scope of Business Analytics Copyright © 2013 Pearson Education, Inc. publishing as Prentice Hall 1-7<br>
Most department stores clear seasonal inventory by reducing prices.
The question is:
When to reduce the price and by how much?
Descriptive analytics: examine historical data for similar products (prices, units sold, advertising, …)
Predictive analytics: predict sales based on price
Prescriptive analytics: find the best sets of pricing and advertising to maximize sales revenue Scope of Business Analytics Copyright © 2013 Pearson Education, Inc. publishing as Prentice Hall 1-7<br>
08
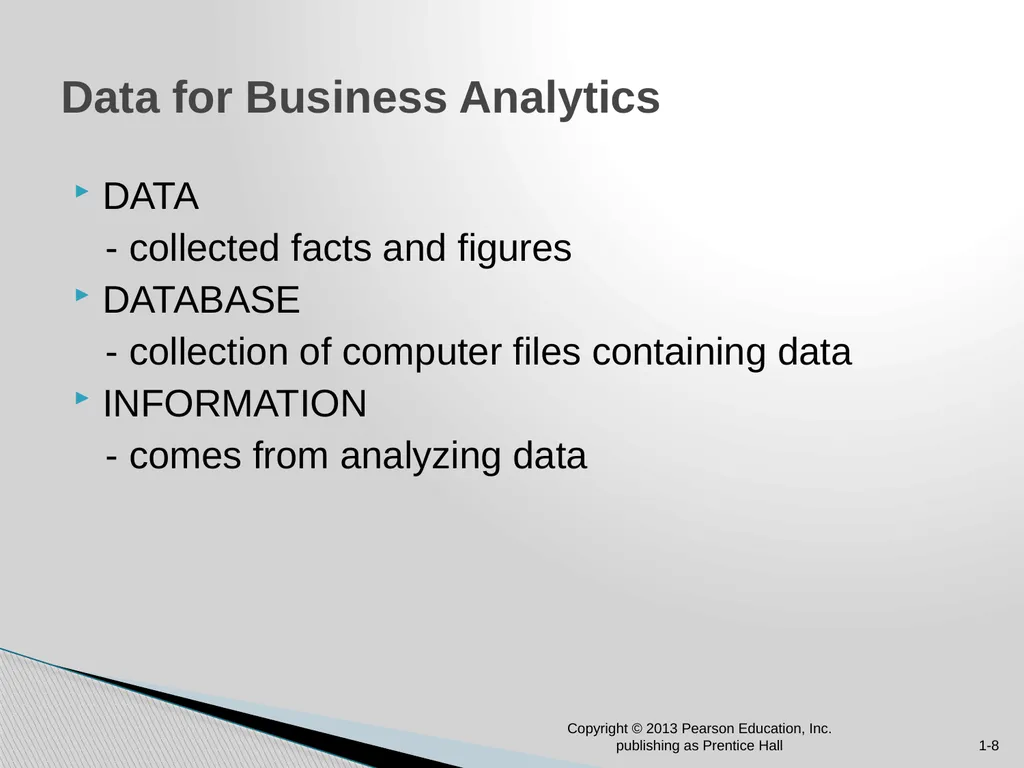
DATA
- collected facts and figures
DATABASE
- collection of computer files containing data
INFORMATION
- comes from analyzing data Data for Business Analytics Copyright © 2013 Pearson Education, Inc. publishing as Prentice Hall 1-8<br>
- collected facts and figures
DATABASE
- collection of computer files containing data
INFORMATION
- comes from analyzing data Data for Business Analytics Copyright © 2013 Pearson Education, Inc. publishing as Prentice Hall 1-8<br>
09
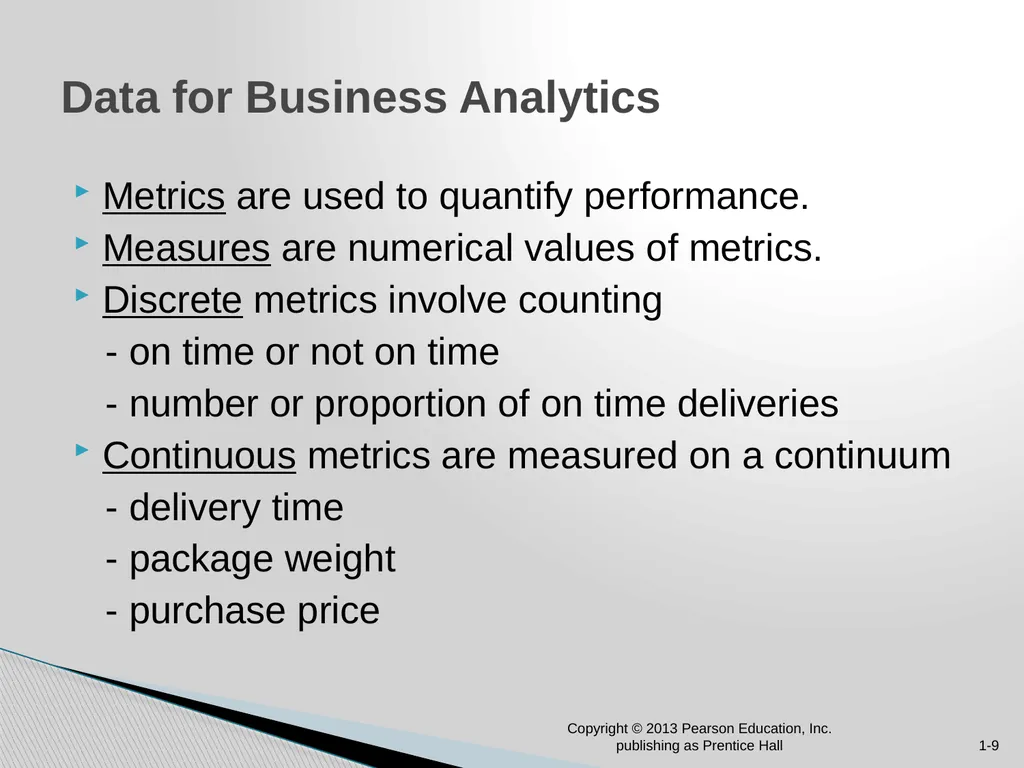
Metrics are used to quantify performance.
Measures are numerical values of metrics.
Discrete metrics involve counting
- on time or not on time
- number or proportion of on time deliveries
Continuous metrics are measured on a continuum
- delivery time
- package weight
- purchase price Data for Business Analytics Copyright © 2013 Pearson Education, Inc. publishing as Prentice Hall 1-9<br>
Measures are numerical values of metrics.
Discrete metrics involve counting
- on time or not on time
- number or proportion of on time deliveries
Continuous metrics are measured on a continuum
- delivery time
- package weight
- purchase price Data for Business Analytics Copyright © 2013 Pearson Education, Inc. publishing as Prentice Hall 1-9<br>
10
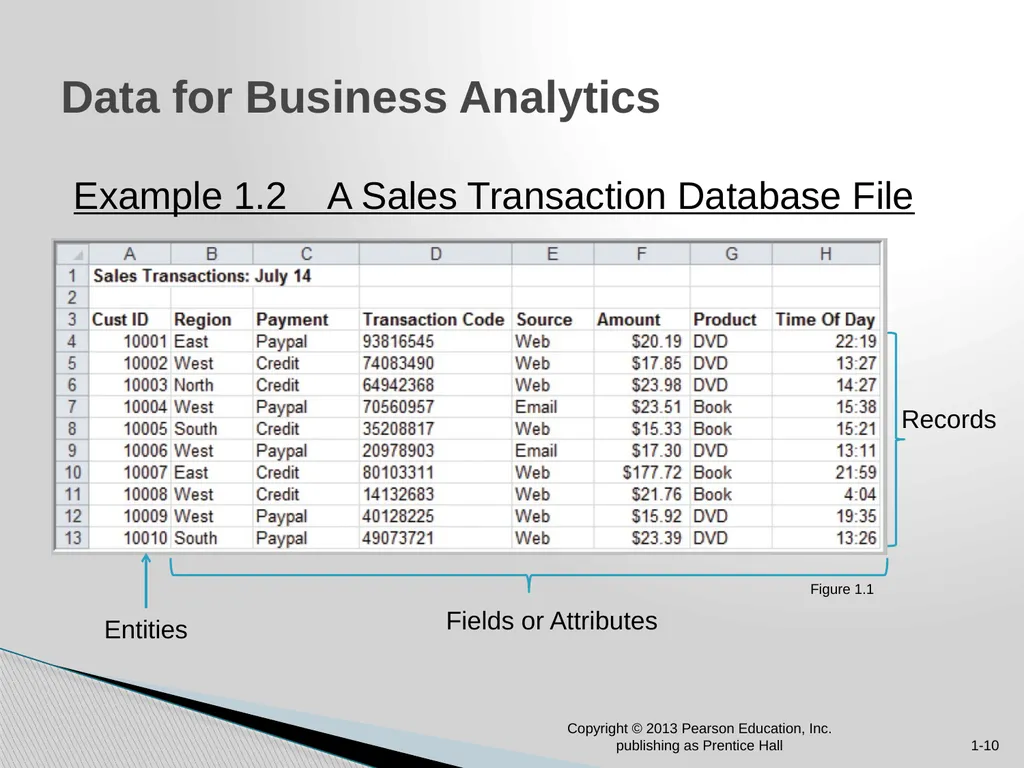
Example 1.2 A Sales Transaction Database File Data for Business Analytics Copyright © 2013 Pearson Education, Inc. publishing as Prentice Hall 1-10 Figure 1.1 Entities Records Fields or Attributes<br>
11
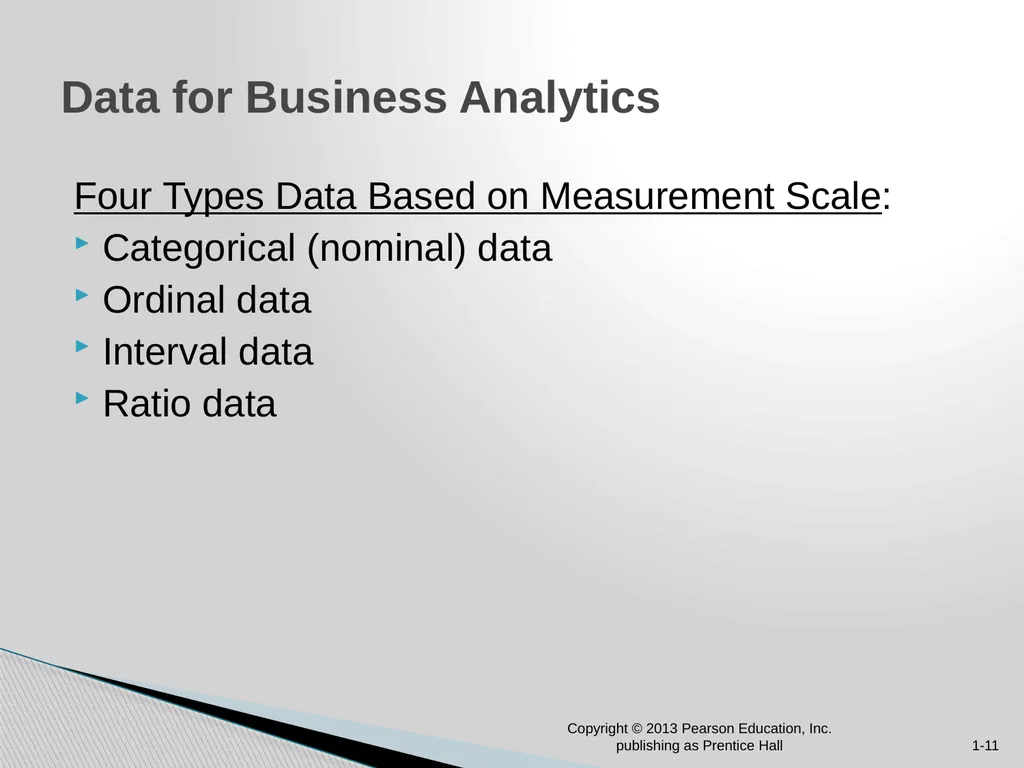
Four Types Data Based on Measurement Scale:
Categorical (nominal) data
Ordinal data
Interval data
Ratio data Data for Business Analytics Copyright © 2013 Pearson Education, Inc. publishing as Prentice Hall 1-11<br>
Categorical (nominal) data
Ordinal data
Interval data
Ratio data Data for Business Analytics Copyright © 2013 Pearson Education, Inc. publishing as Prentice Hall 1-11<br>
12
Example 1.3
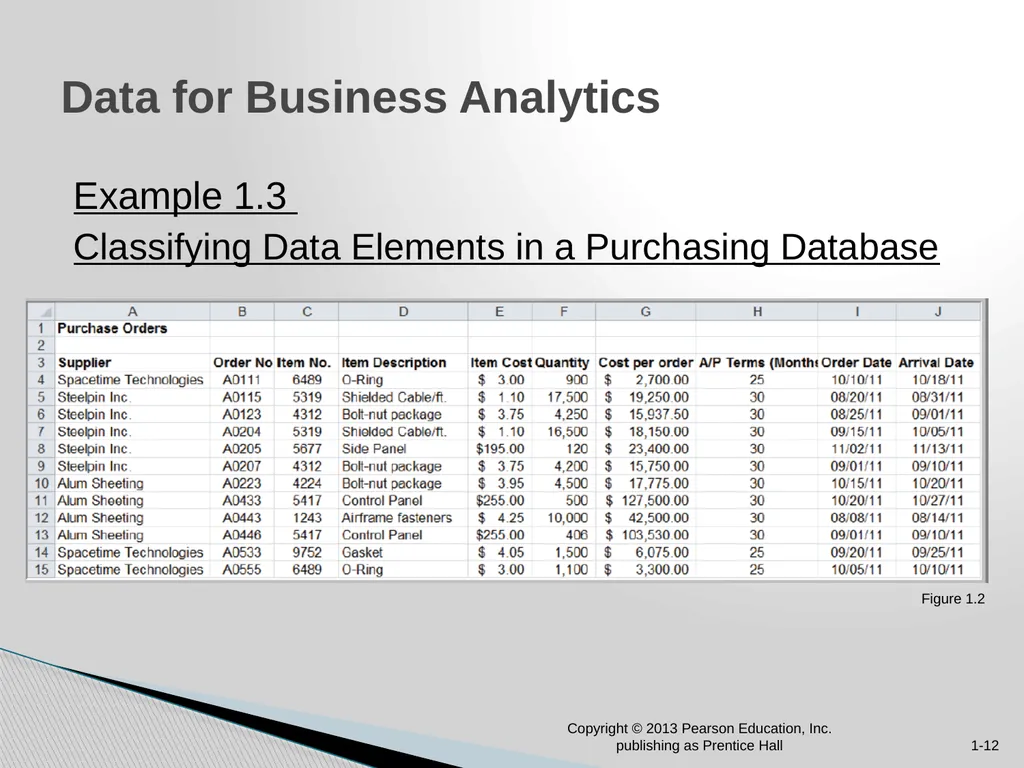
Classifying Data Elements in a Purchasing Database Data for Business Analytics Copyright © 2013 Pearson Education, Inc. publishing as Prentice Hall 1-12 Figure 1.2<br>
Classifying Data Elements in a Purchasing Database Data for Business Analytics Copyright © 2013 Pearson Education, Inc. publishing as Prentice Hall 1-12 Figure 1.2<br>
13
Example 1.3 (continued)
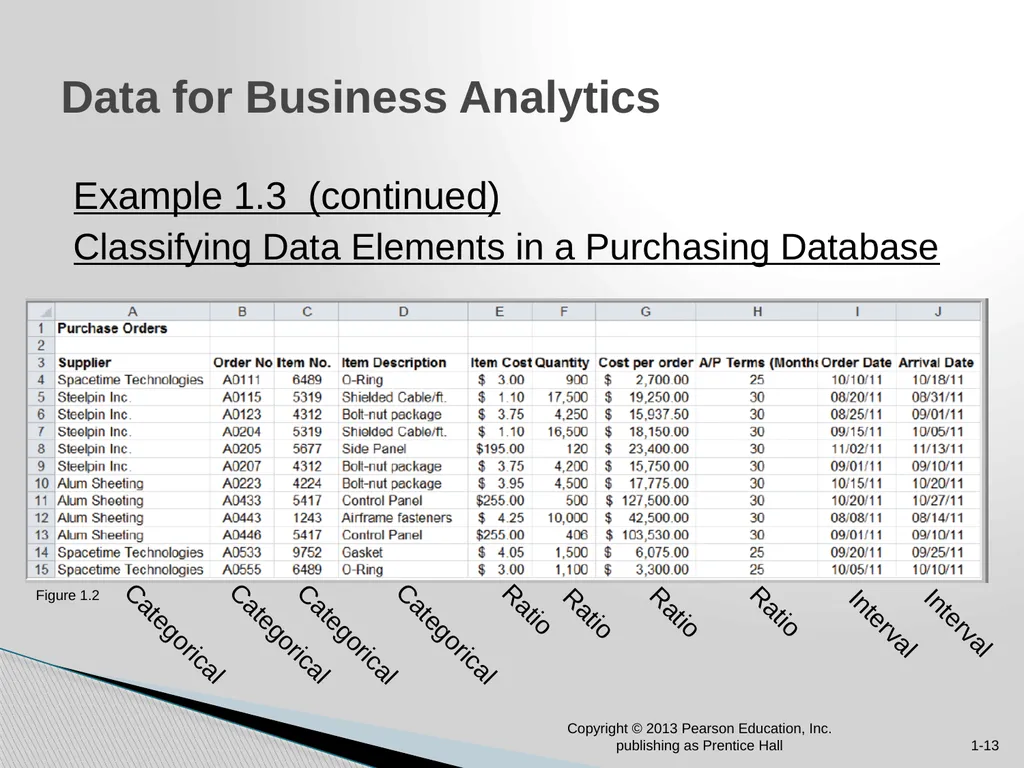
Classifying Data Elements in a Purchasing Database Data for Business Analytics Copyright © 2013 Pearson Education, Inc. publishing as Prentice Hall 1-13 Categorical Categorical Categorical Ratio Categorical Ratio Ratio Ratio Interval Interval Figure 1.2<br>
Classifying Data Elements in a Purchasing Database Data for Business Analytics Copyright © 2013 Pearson Education, Inc. publishing as Prentice Hall 1-13 Categorical Categorical Categorical Ratio Categorical Ratio Ratio Ratio Interval Interval Figure 1.2<br>
14
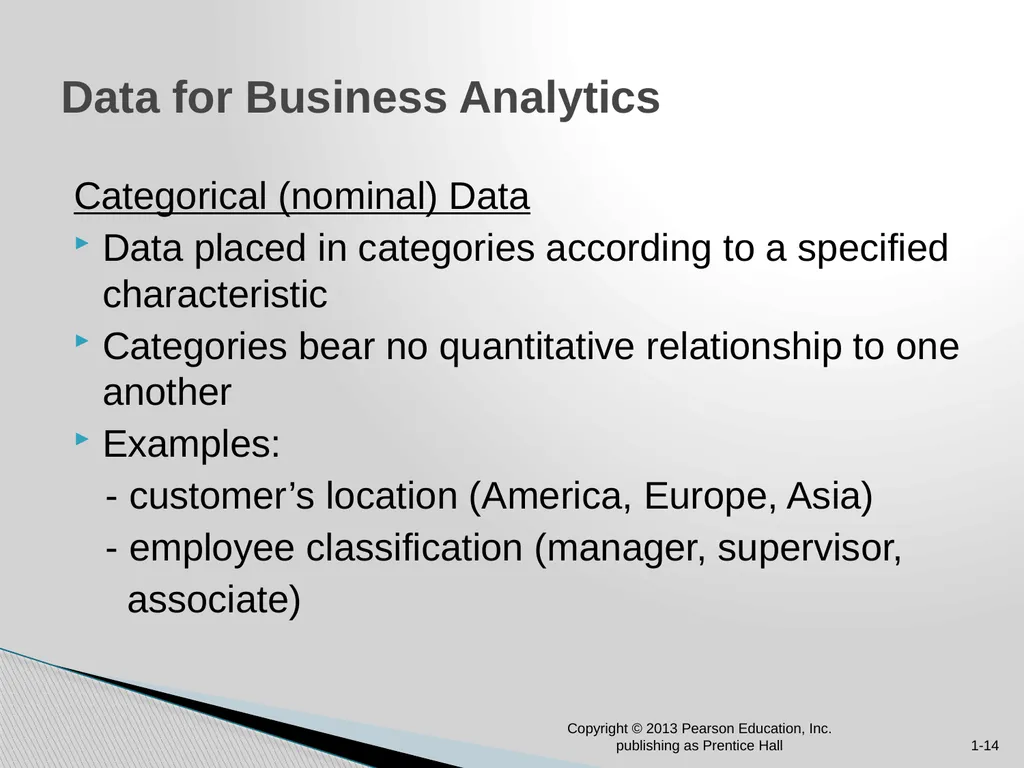
Categorical (nominal) Data
Data placed in categories according to a specified characteristic
Categories bear no quantitative relationship to one another
Examples:
- customer’s location (America, Europe, Asia)
- employee classification (manager, supervisor,
associate) Data for Business Analytics Copyright © 2013 Pearson Education, Inc. publishing as Prentice Hall 1-14<br>
Data placed in categories according to a specified characteristic
Categories bear no quantitative relationship to one another
Examples:
- customer’s location (America, Europe, Asia)
- employee classification (manager, supervisor,
associate) Data for Business Analytics Copyright © 2013 Pearson Education, Inc. publishing as Prentice Hall 1-14<br>
15
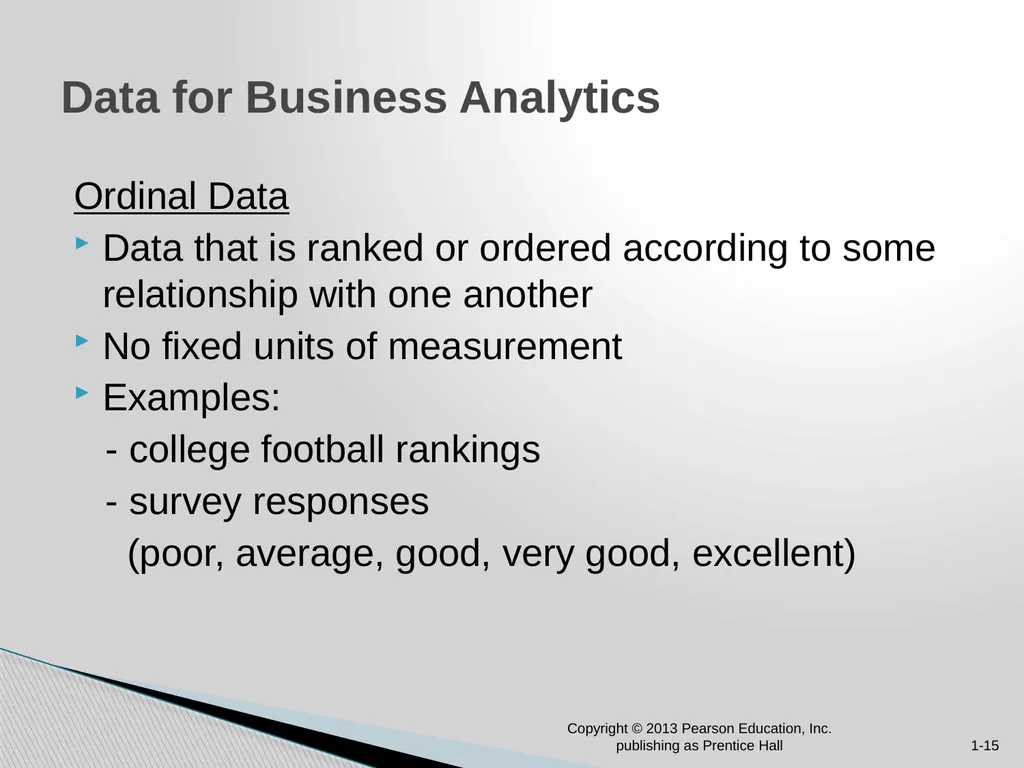
Ordinal Data
Data that is ranked or ordered according to some relationship with one another
No fixed units of measurement
Examples:
- college football rankings
- survey responses
(poor, average, good, very good, excellent) Data for Business Analytics Copyright © 2013 Pearson Education, Inc. publishing as Prentice Hall 1-15<br>
Data that is ranked or ordered according to some relationship with one another
No fixed units of measurement
Examples:
- college football rankings
- survey responses
(poor, average, good, very good, excellent) Data for Business Analytics Copyright © 2013 Pearson Education, Inc. publishing as Prentice Hall 1-15<br>
16
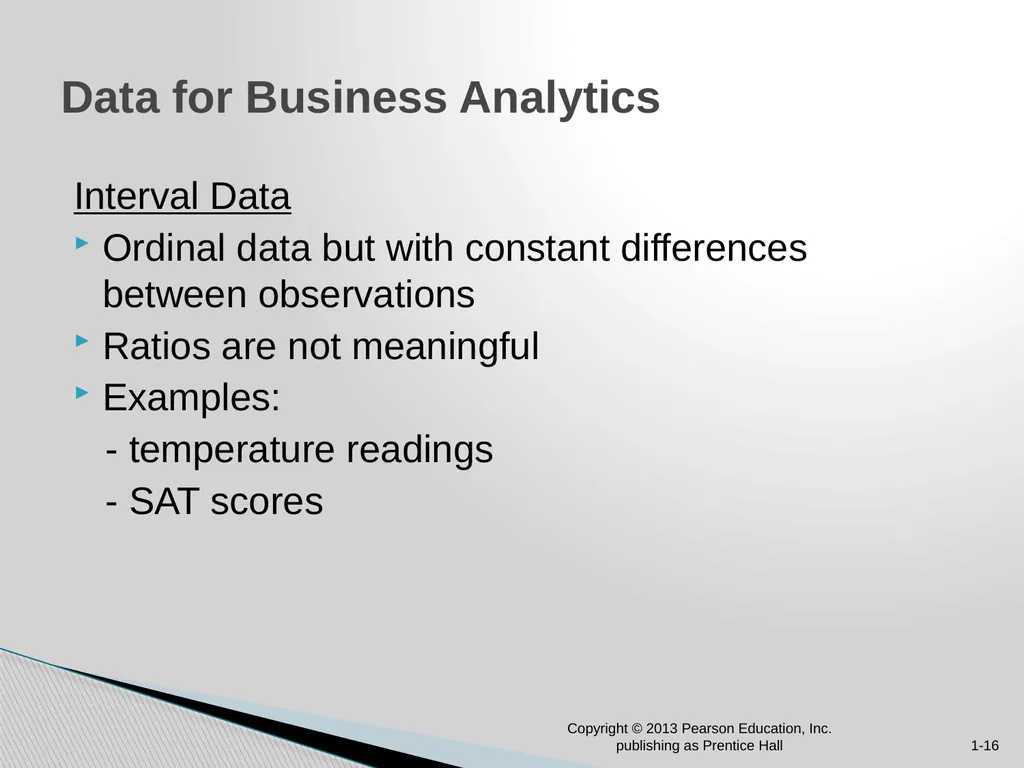
Interval Data
Ordinal data but with constant differences between observations
Ratios are not meaningful
Examples:
- temperature readings
- SAT scores Data for Business Analytics Copyright © 2013 Pearson Education, Inc. publishing as Prentice Hall 1-16<br>
Ordinal data but with constant differences between observations
Ratios are not meaningful
Examples:
- temperature readings
- SAT scores Data for Business Analytics Copyright © 2013 Pearson Education, Inc. publishing as Prentice Hall 1-16<br>
17
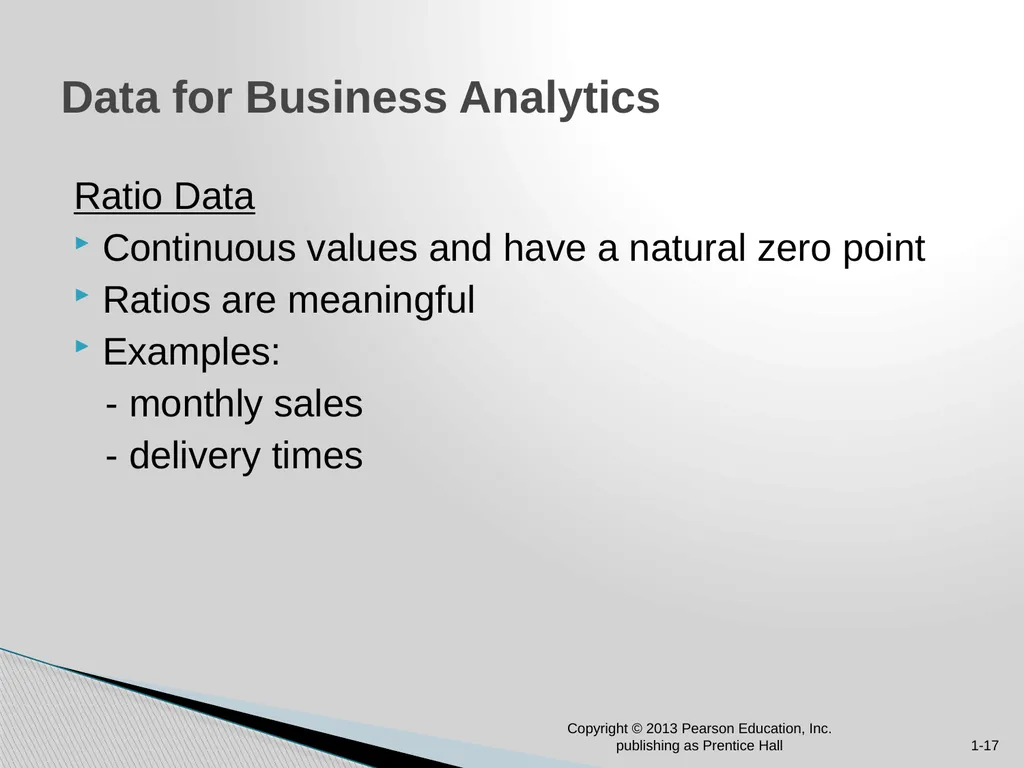
Ratio Data
Continuous values and have a natural zero point
Ratios are meaningful
Examples:
- monthly sales
- delivery times Data for Business Analytics Copyright © 2013 Pearson Education, Inc. publishing as Prentice Hall 1-17<br>
Continuous values and have a natural zero point
Ratios are meaningful
Examples:
- monthly sales
- delivery times Data for Business Analytics Copyright © 2013 Pearson Education, Inc. publishing as Prentice Hall 1-17<br>
18
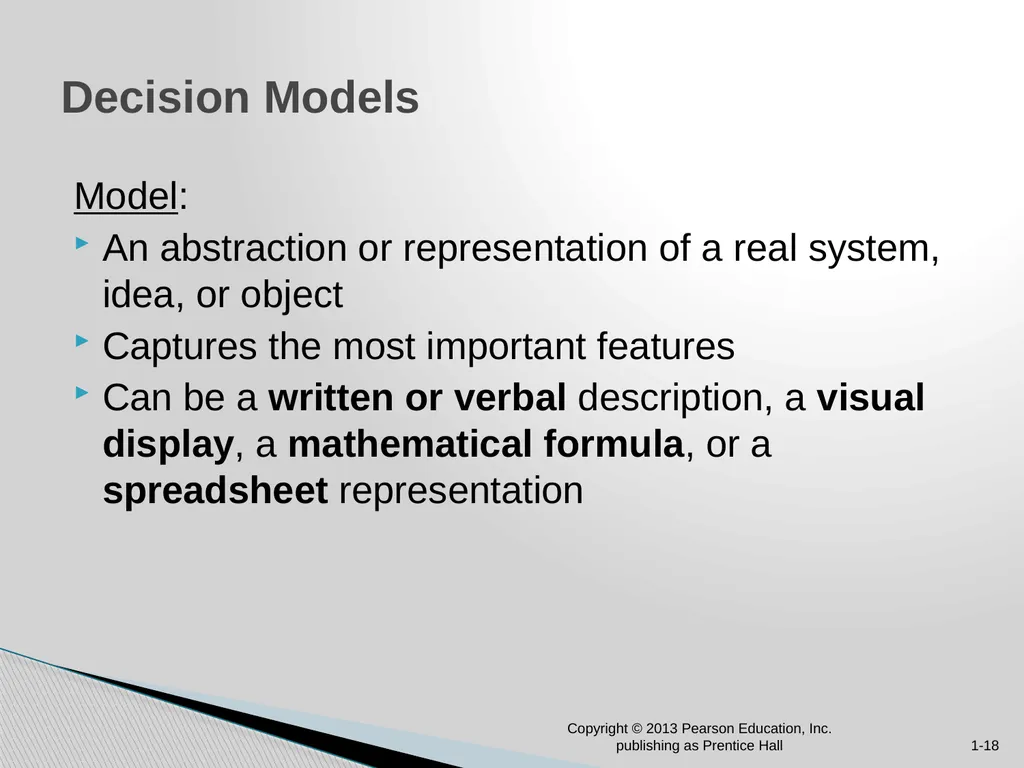
Model:
An abstraction or representation of a real system, idea, or object
Captures the most important features
Can be a written or verbal description, a visual display, a mathematical formula, or a spreadsheet representation Decision Models Copyright © 2013 Pearson Education, Inc. publishing as Prentice Hall 1-18<br>
An abstraction or representation of a real system, idea, or object
Captures the most important features
Can be a written or verbal description, a visual display, a mathematical formula, or a spreadsheet representation Decision Models Copyright © 2013 Pearson Education, Inc. publishing as Prentice Hall 1-18<br>
19
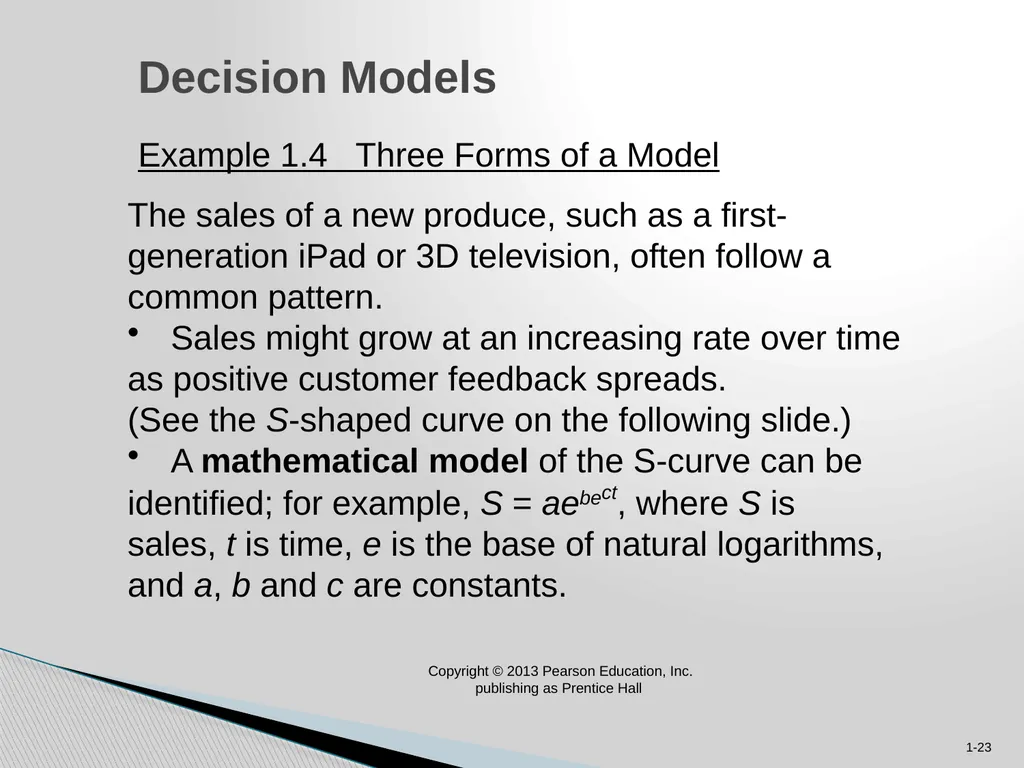
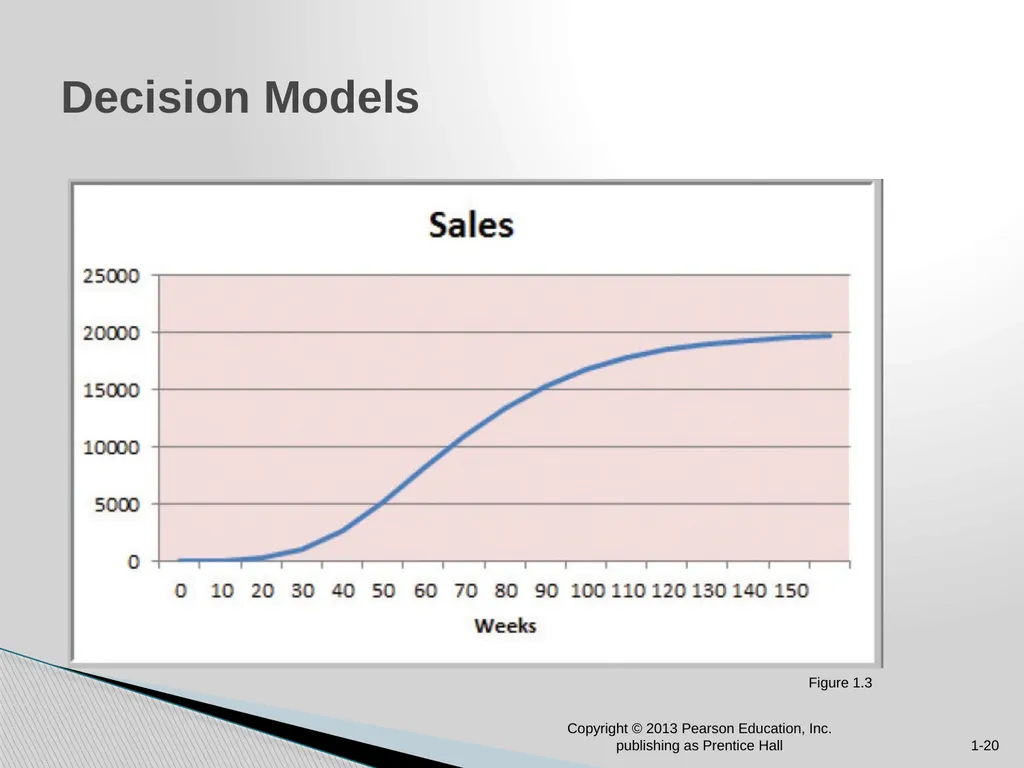
Decision Models Example 1.4 Three Forms of a Model The sales of a new produce, such as a first-
generation iPad or 3D television, often follow a
common pattern.
Sales might grow at an increasing rate over time
as positive customer feedback spreads.
(See the S-shaped curve on the following slide.)
A mathematical model of the S-curve can be
identified; for example, S = aebect, where S is
sales, t is time, e is the base of natural logarithms,
and a, b and c are constants. 1-23 Copyright © 2013 Pearson Education, Inc.
publishing as Prentice Hall<br>
generation iPad or 3D television, often follow a
common pattern.
Sales might grow at an increasing rate over time
as positive customer feedback spreads.
(See the S-shaped curve on the following slide.)
A mathematical model of the S-curve can be
identified; for example, S = aebect, where S is
sales, t is time, e is the base of natural logarithms,
and a, b and c are constants. 1-23 Copyright © 2013 Pearson Education, Inc.
publishing as Prentice Hall<br>
20
Decision Models Copyright © 2013 Pearson Education, Inc. publishing as Prentice Hall 1-20 Figure 1.3<br>
21
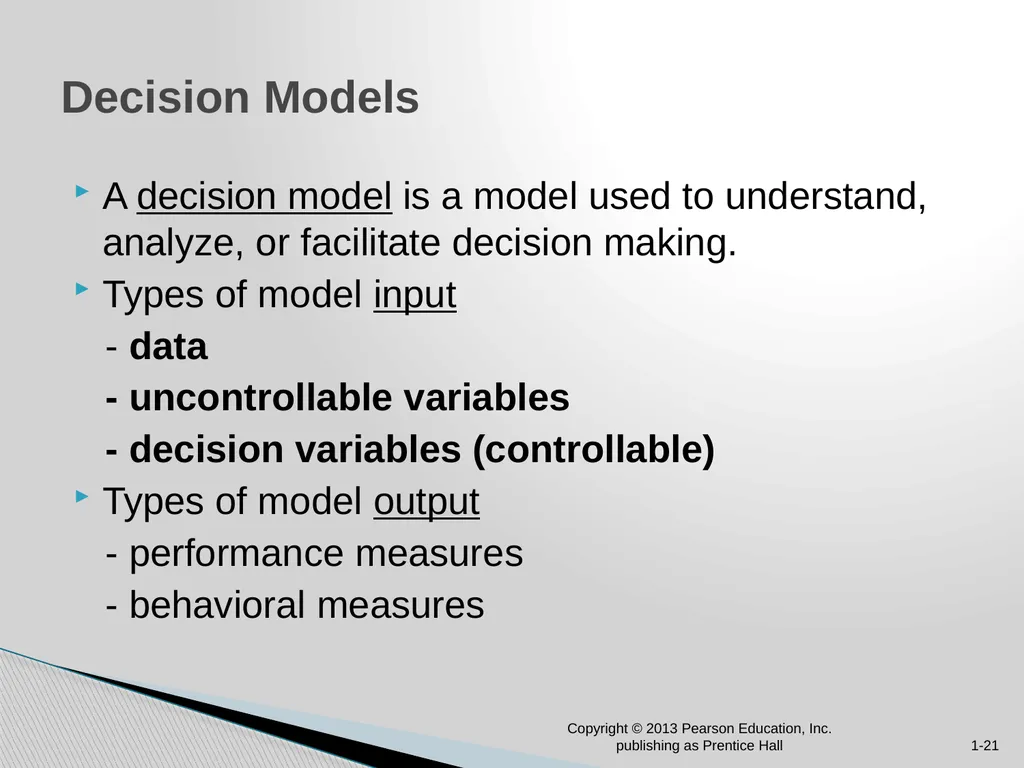
A decision model is a model used to understand, analyze, or facilitate decision making.
Types of model input
- data
- uncontrollable variables
- decision variables (controllable)
Types of model output
- performance measures
- behavioral measures Decision Models Copyright © 2013 Pearson Education, Inc. publishing as Prentice Hall 1-21<br>
Types of model input
- data
- uncontrollable variables
- decision variables (controllable)
Types of model output
- performance measures
- behavioral measures Decision Models Copyright © 2013 Pearson Education, Inc. publishing as Prentice Hall 1-21<br>
22
Descriptive Decision Models
Simply tell “what is” and describe relationships
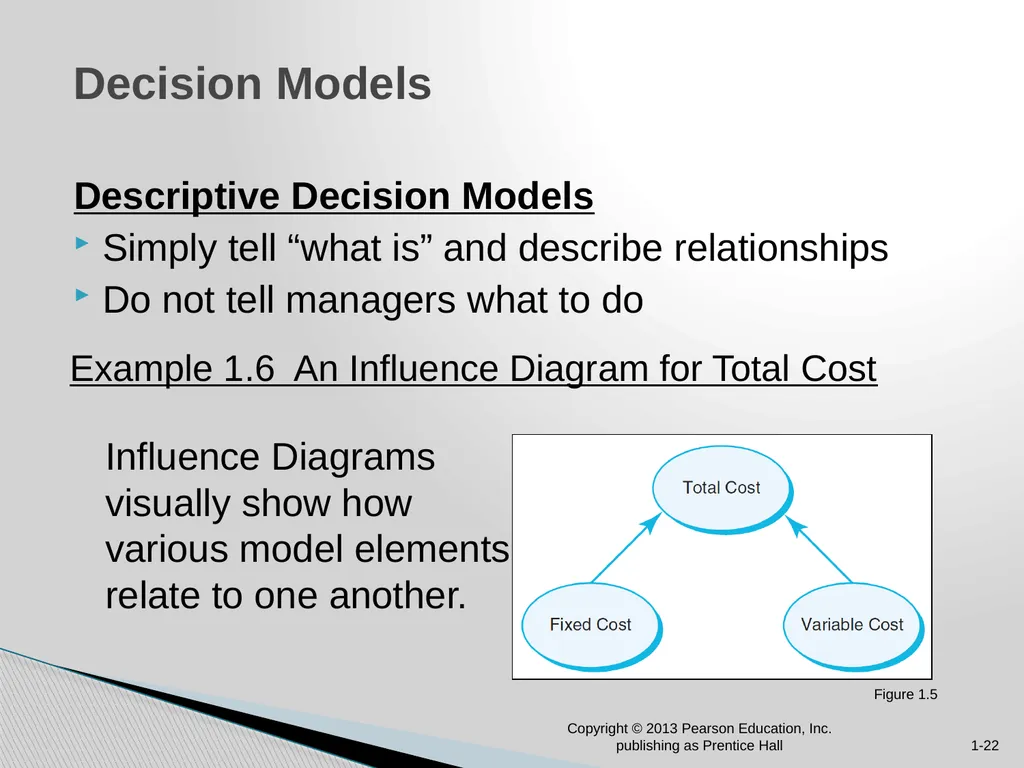
Do not tell managers what to do Decision Models Influence Diagrams visually show how various model elements relate to one another. Example 1.6 An Influence Diagram for Total Cost Copyright © 2013 Pearson Education, Inc. publishing as Prentice Hall 1-22 Figure 1.5<br>
Simply tell “what is” and describe relationships
Do not tell managers what to do Decision Models Influence Diagrams visually show how various model elements relate to one another. Example 1.6 An Influence Diagram for Total Cost Copyright © 2013 Pearson Education, Inc. publishing as Prentice Hall 1-22 Figure 1.5<br>
23
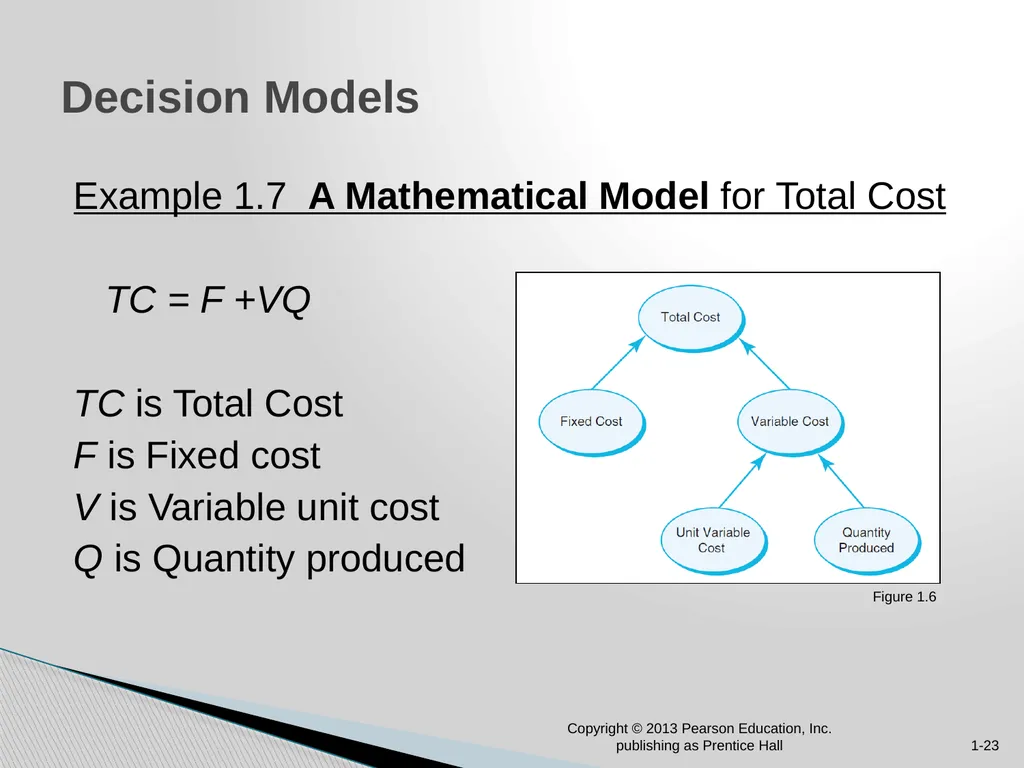
Example 1.7 A Mathematical Model for Total Cost
TC = F +VQ
TC is Total Cost
F is Fixed cost
V is Variable unit cost
Q is Quantity produced Decision Models Copyright © 2013 Pearson Education, Inc. publishing as Prentice Hall 1-23 Figure 1.6<br>
TC = F +VQ
TC is Total Cost
F is Fixed cost
V is Variable unit cost
Q is Quantity produced Decision Models Copyright © 2013 Pearson Education, Inc. publishing as Prentice Hall 1-23 Figure 1.6<br>
24
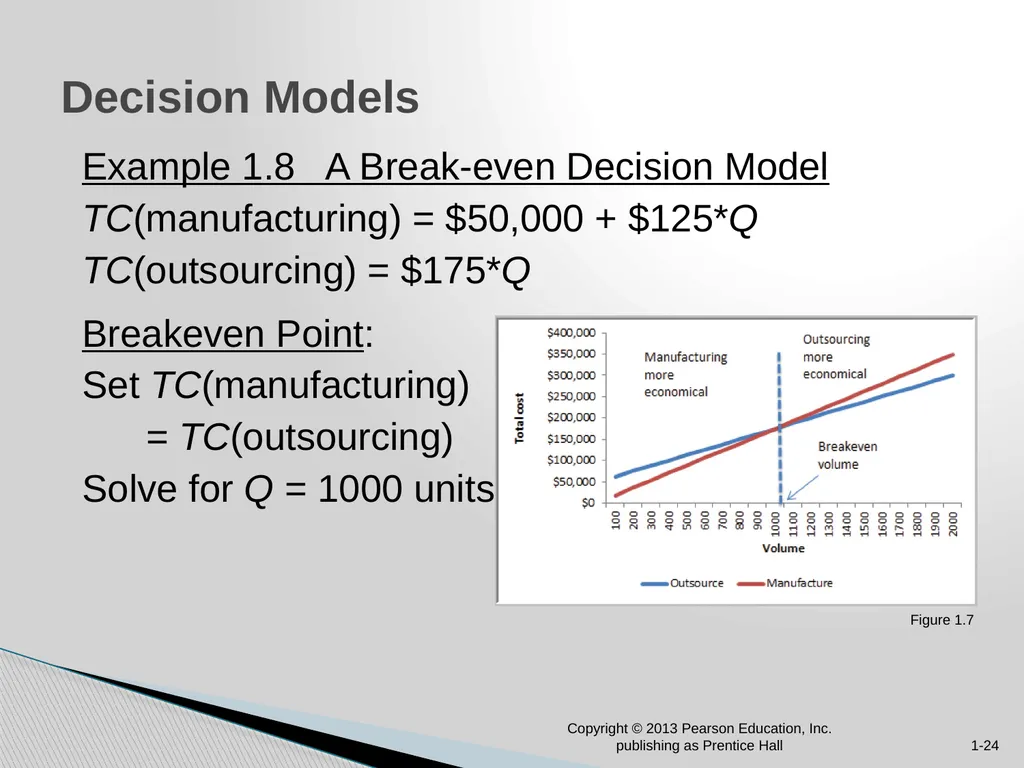
Example 1.8 A Break-even Decision Model
TC(manufacturing) = $50,000 + $125*Q
TC(outsourcing) = $175*Q
Breakeven Point:
Set TC(manufacturing)
= TC(outsourcing)
Solve for Q = 1000 units Decision Models Copyright © 2013 Pearson Education, Inc. publishing as Prentice Hall 1-24 Figure 1.7<br>
TC(manufacturing) = $50,000 + $125*Q
TC(outsourcing) = $175*Q
Breakeven Point:
Set TC(manufacturing)
= TC(outsourcing)
Solve for Q = 1000 units Decision Models Copyright © 2013 Pearson Education, Inc. publishing as Prentice Hall 1-24 Figure 1.7<br>
25
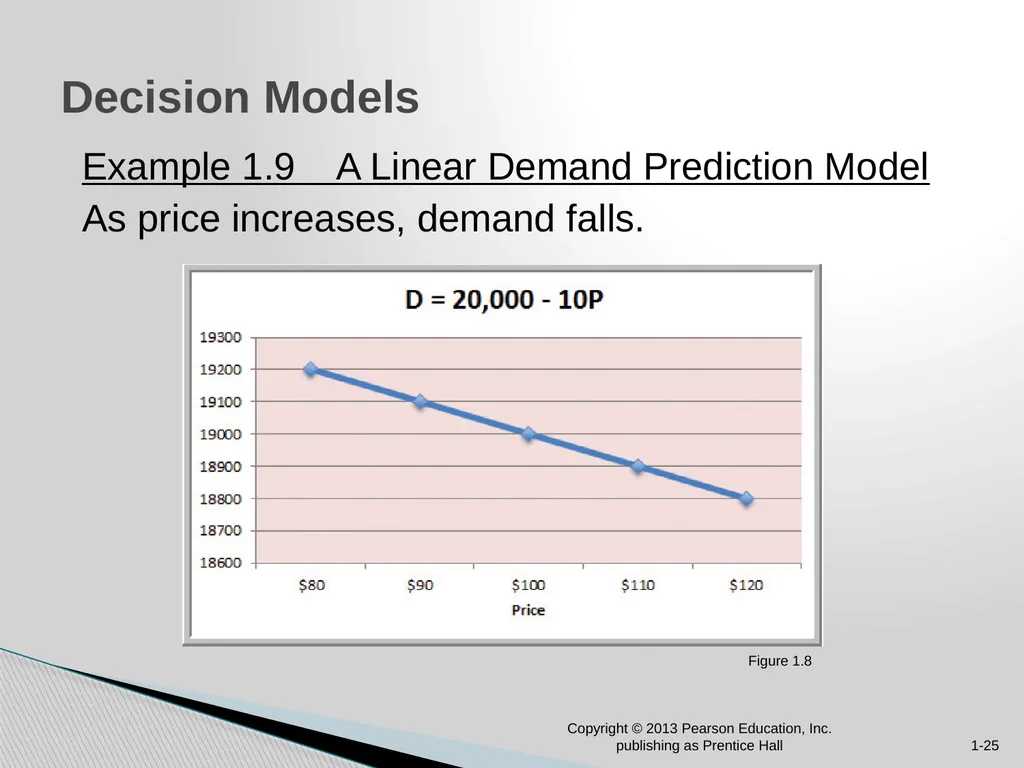
Example 1.9 A Linear Demand Prediction Model
As price increases, demand falls. Decision Models Copyright © 2013 Pearson Education, Inc. publishing as Prentice Hall 1-25 Figure 1.8<br>
As price increases, demand falls. Decision Models Copyright © 2013 Pearson Education, Inc. publishing as Prentice Hall 1-25 Figure 1.8<br>
26
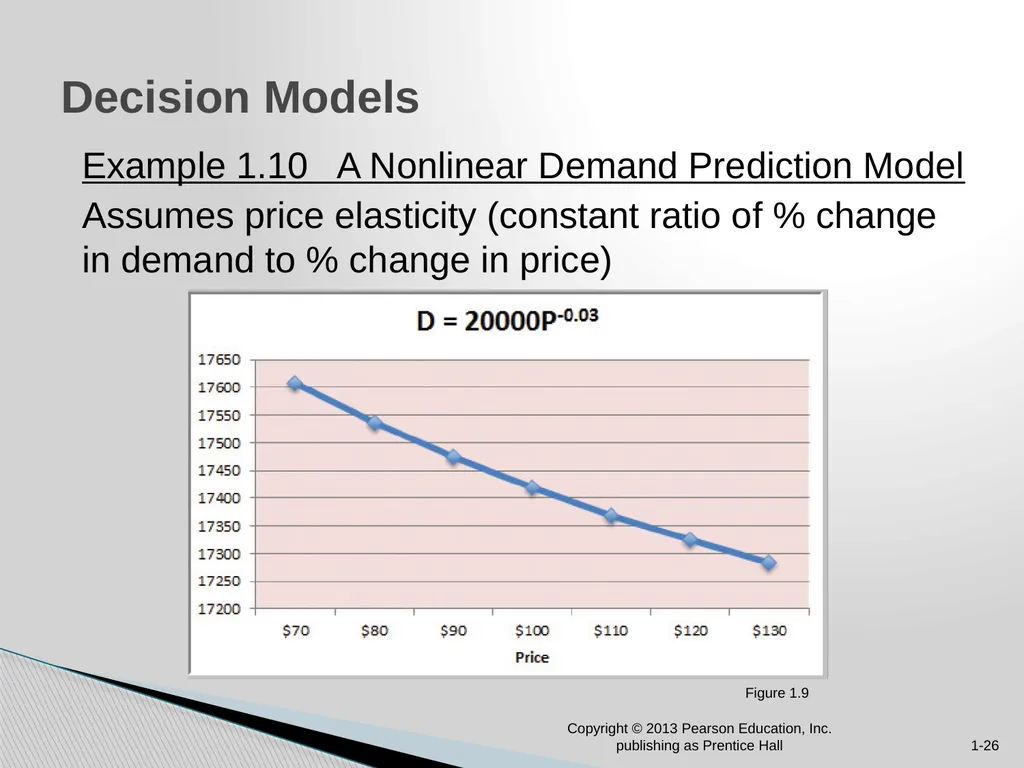
Example 1.10 A Nonlinear Demand Prediction Model
Assumes price elasticity (constant ratio of % change in demand to % change in price) Decision Models Copyright © 2013 Pearson Education, Inc. publishing as Prentice Hall 1-26 Figure 1.9<br>
Assumes price elasticity (constant ratio of % change in demand to % change in price) Decision Models Copyright © 2013 Pearson Education, Inc. publishing as Prentice Hall 1-26 Figure 1.9<br>
27
Predictive Decision Models often incorporate uncertainty to help managers analyze risk.
Aim to predict what will happen in the future.
Uncertainty is imperfect knowledge of what will happen in the future.
Risk is associated with the consequences of what actually happens. Decision Models Copyright © 2013 Pearson Education, Inc. publishing as Prentice Hall 1-27<br>
Aim to predict what will happen in the future.
Uncertainty is imperfect knowledge of what will happen in the future.
Risk is associated with the consequences of what actually happens. Decision Models Copyright © 2013 Pearson Education, Inc. publishing as Prentice Hall 1-27<br>
28
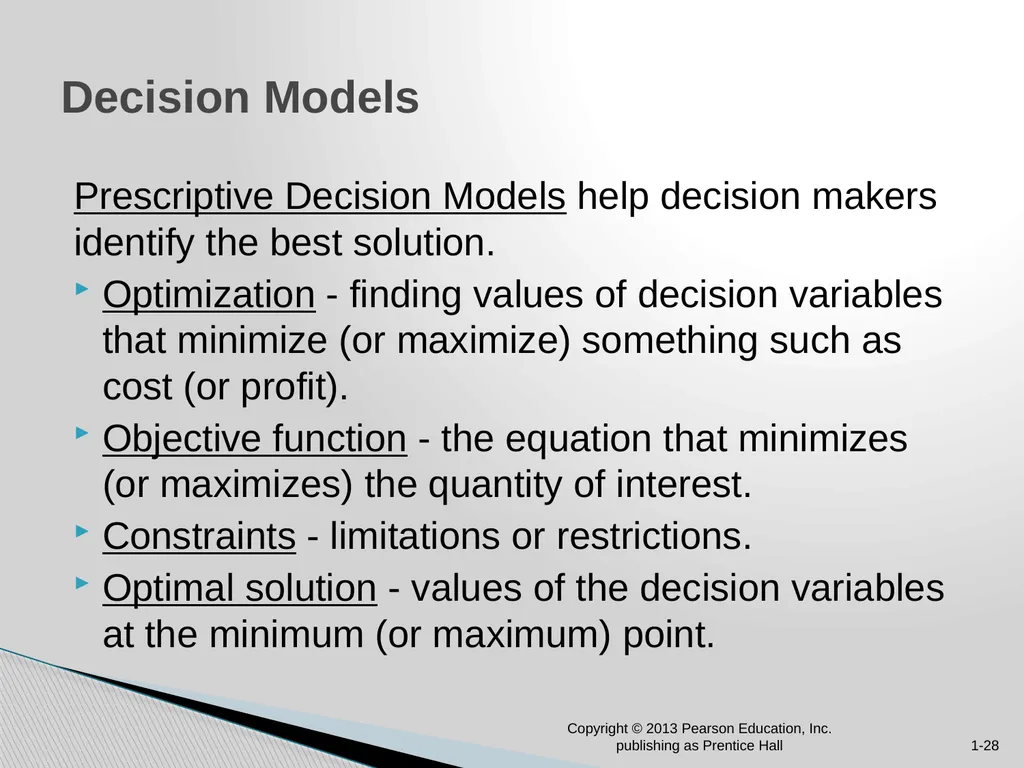
Prescriptive Decision Models help decision makers identify the best solution.
Optimization - finding values of decision variables that minimize (or maximize) something such as cost (or profit).
Objective function - the equation that minimizes (or maximizes) the quantity of interest.
Constraints - limitations or restrictions.
Optimal solution - values of the decision variables at the minimum (or maximum) point. Decision Models Copyright © 2013 Pearson Education, Inc. publishing as Prentice Hall 1-28<br>
Optimization - finding values of decision variables that minimize (or maximize) something such as cost (or profit).
Objective function - the equation that minimizes (or maximizes) the quantity of interest.
Constraints - limitations or restrictions.
Optimal solution - values of the decision variables at the minimum (or maximum) point. Decision Models Copyright © 2013 Pearson Education, Inc. publishing as Prentice Hall 1-28<br>