04
Outline Research paper: “Human Evaluation of Models Built for Interpretability” by Lage et al.
Research paper: “Manipulating and Measuring Model Interpretability” by Poursabzi-Sangdeh et al.
Discussion<br>
06
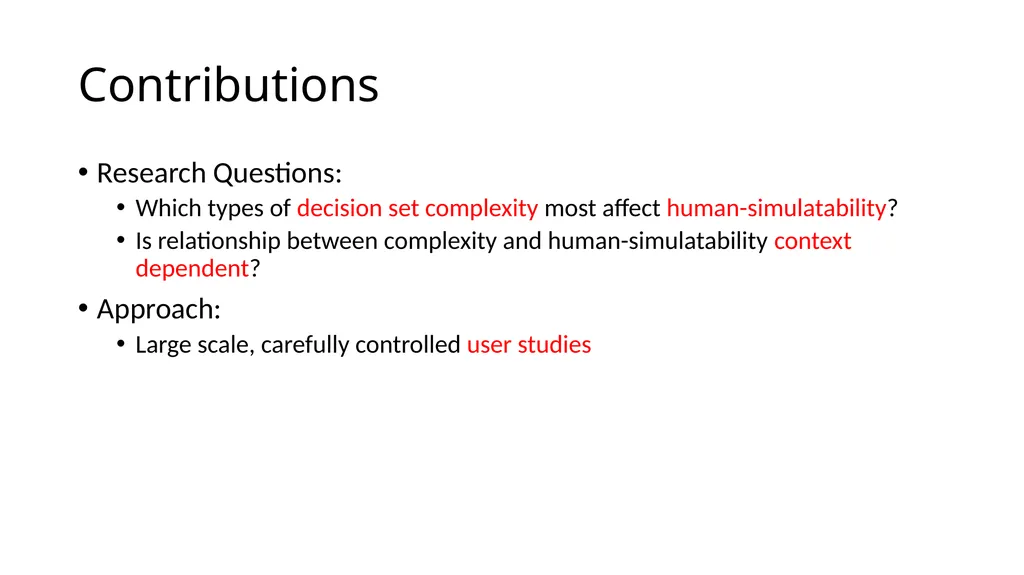
Contributions Research Questions:
Which types of decision set complexity most affect human-simulatability?
Is relationship between complexity and human-simulatability context dependent?
Approach:
Large scale, carefully controlled user studies<br>
07
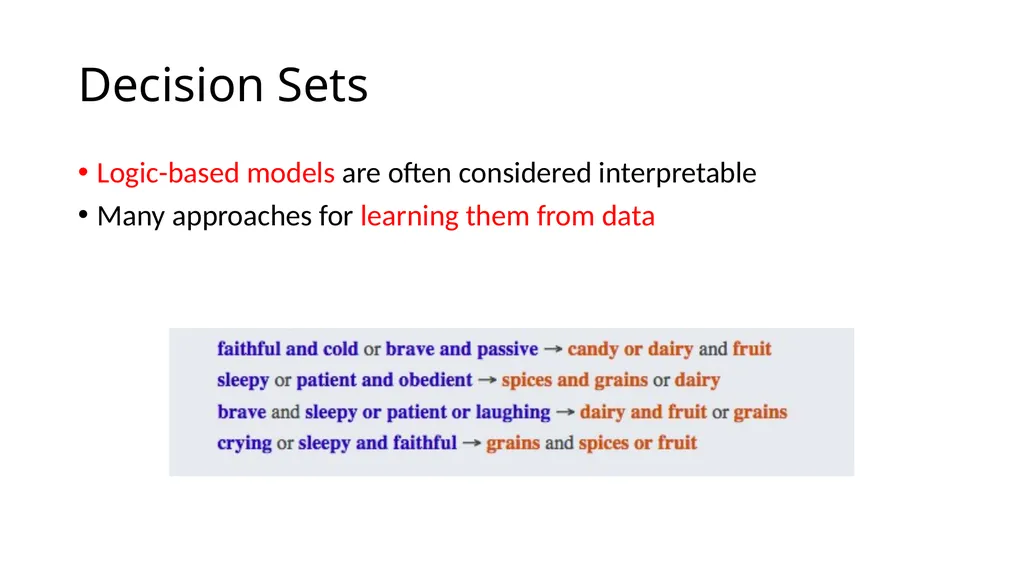
Decision Sets Logic-based models are often considered interpretable
Many approaches for learning them from data<br>
08
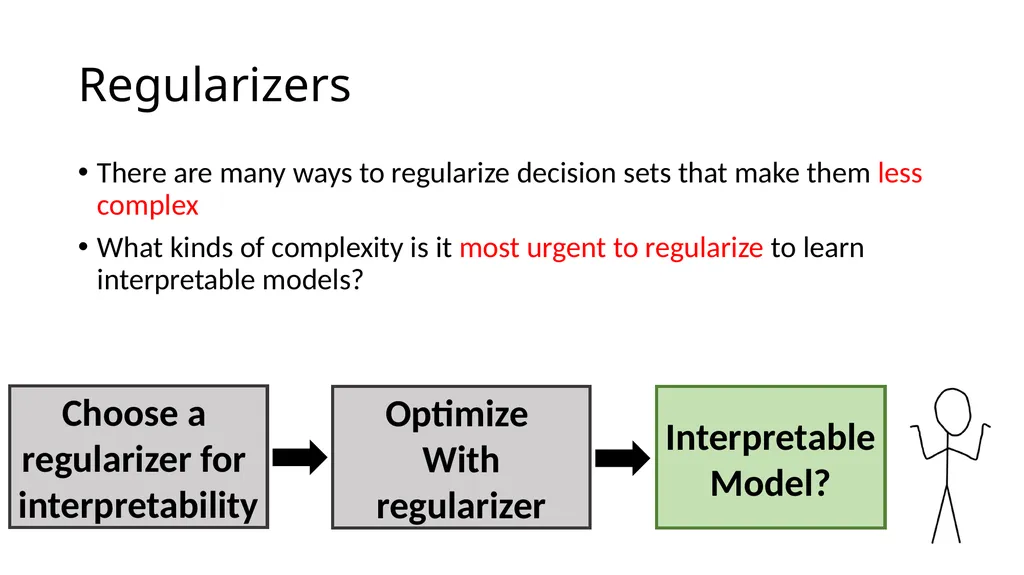
Regularizers There are many ways to regularize decision sets that make them less complex
What kinds of complexity is it most urgent to regularize to learn interpretable models? Choose a
regularizer for
interpretability Interpretable Model? Optimize
With regularizer<br>
09
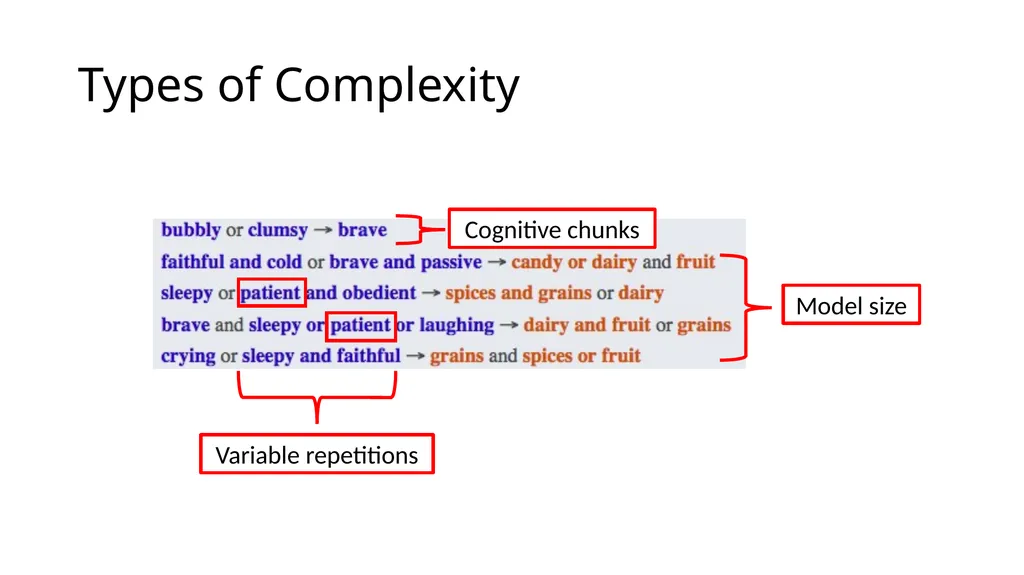
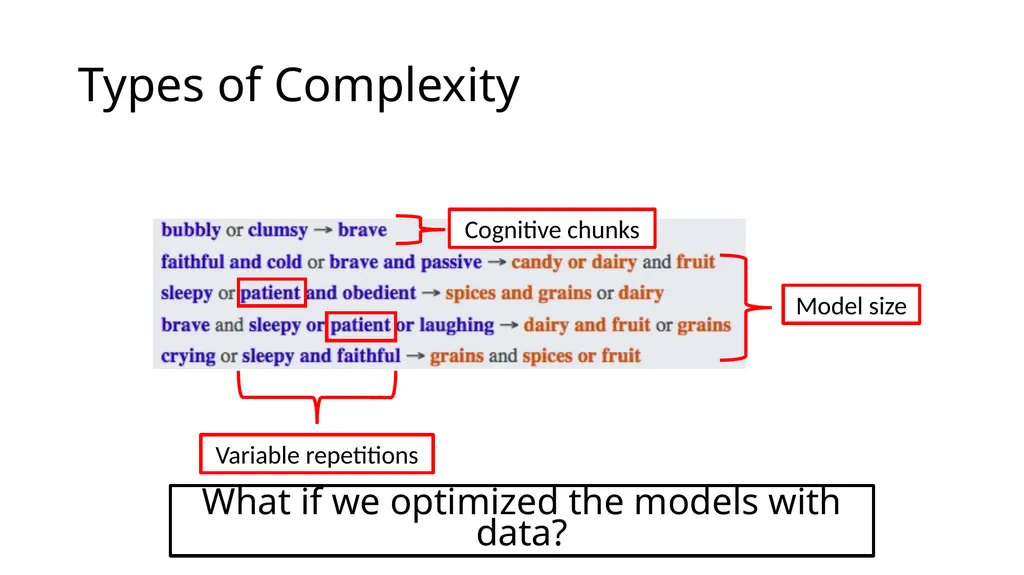
Types of Complexity Model size Variable repetitions Cognitive chunks<br>
10
Types of Complexity Model size Variable repetitions Cognitive chunks What if we optimized the models with data?<br>
11
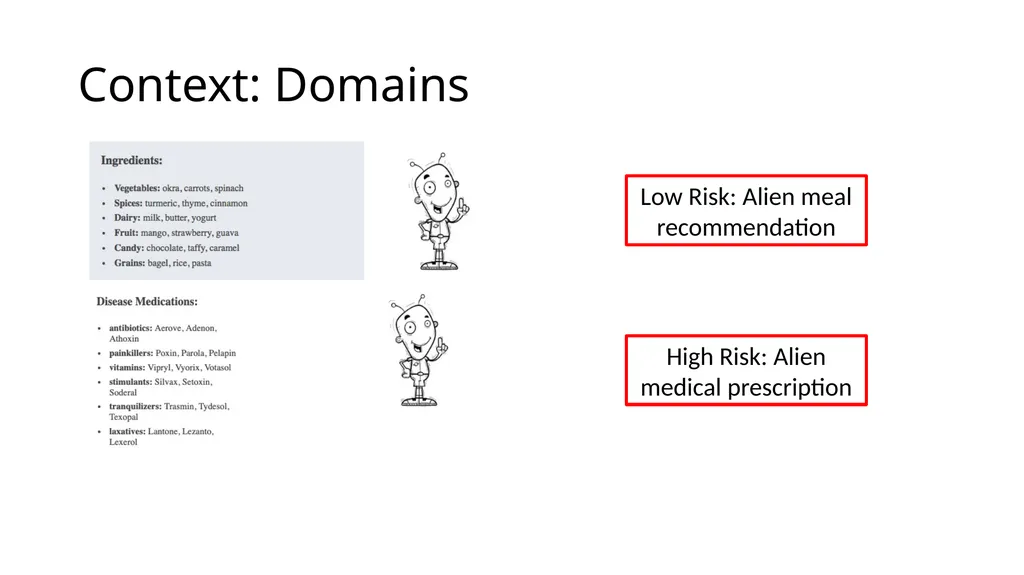
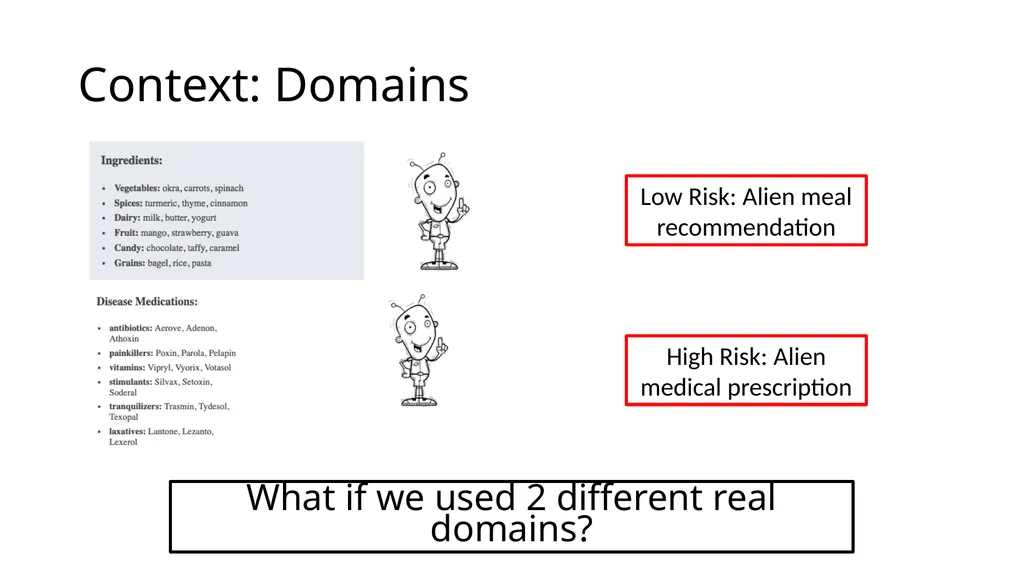
Context: Domains Low Risk: Alien meal recommendation High Risk: Alien medical prescription<br>
12
Context: Domains Low Risk: Alien meal recommendation High Risk: Alien medical prescription What if we used 2 different real domains?<br>
13
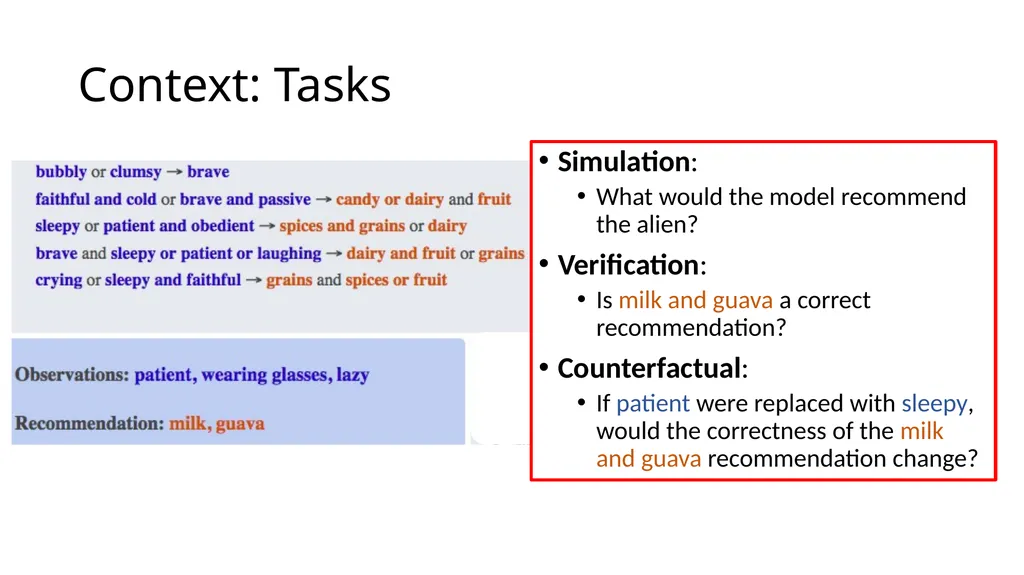
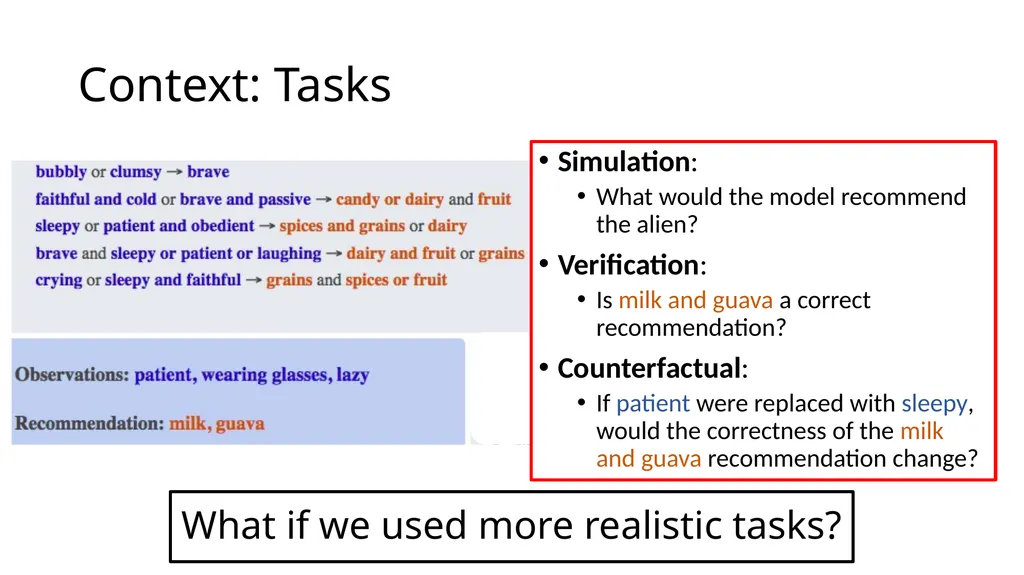
Context: Tasks Simulation:
What would the model recommend the alien?
Verification:
Is milk and guava a correct recommendation?
Counterfactual:
If patient were replaced with sleepy, would the correctness of the milk and guava recommendation change?<br>
14
Context: Tasks Simulation:
What would the model recommend the alien?
Verification:
Is milk and guava a correct recommendation?
Counterfactual:
If patient were replaced with sleepy, would the correctness of the milk and guava recommendation change? What if we used more realistic tasks?<br>
15
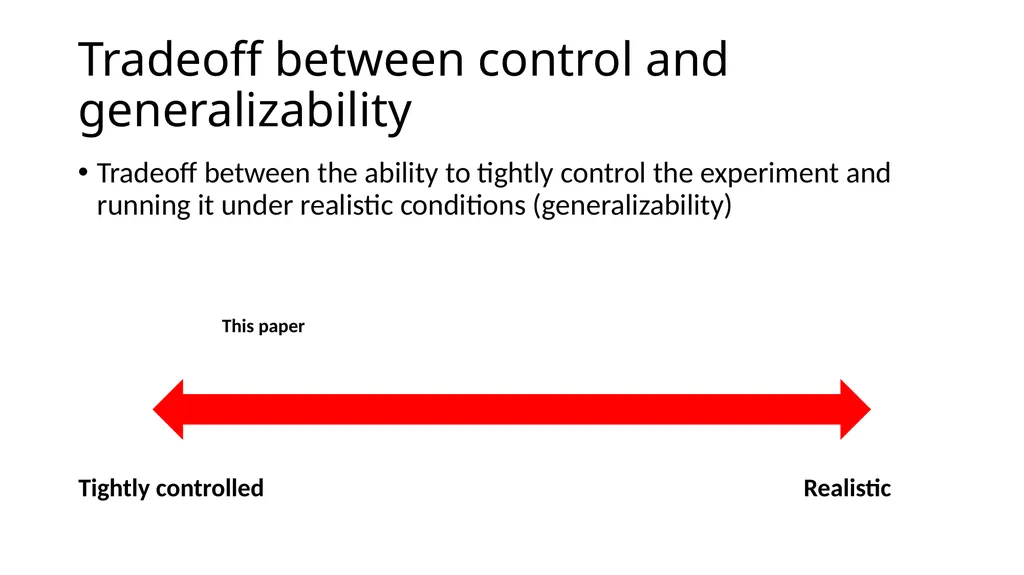
Tradeoff between control and generalizability Tradeoff between the ability to tightly control the experiment and running it under realistic conditions (generalizability) Tightly controlled Realistic This paper<br>
16
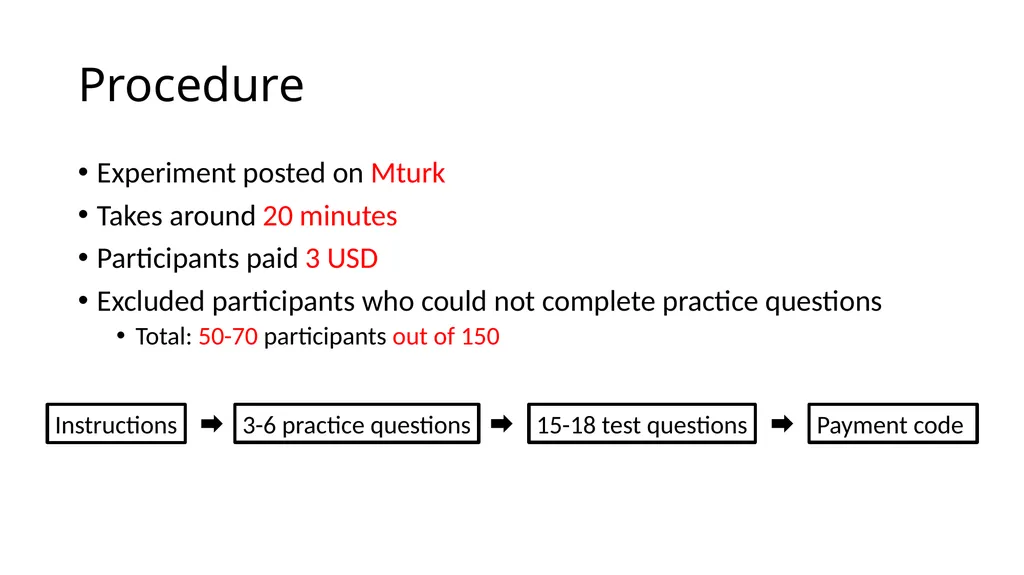
Procedure Experiment posted on Mturk
Takes around 20 minutes
Participants paid 3 USD
Excluded participants who could not complete practice questions
Total: 50-70 participants out of 150 Instructions 3-6 practice questions 15-18 test questions Payment code<br>
17
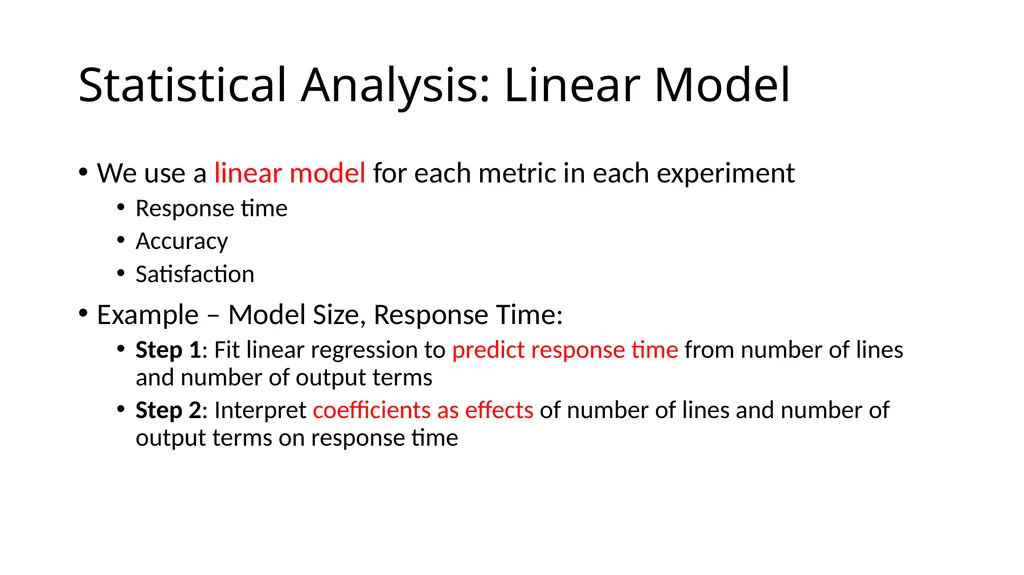
Statistical Analysis: Linear Model We use a linear model for each metric in each experiment
Response time
Accuracy
Satisfaction<br>
18
Statistical Analysis: Linear Model We use a linear model for each metric in each experiment
Response time
Accuracy
Satisfaction
Example – Model Size, Response Time:
Step 1: Fit linear regression to predict response time from number of lines and number of output terms
Step 2: Interpret coefficients as effects of number of lines and number of output terms on response time<br>
19
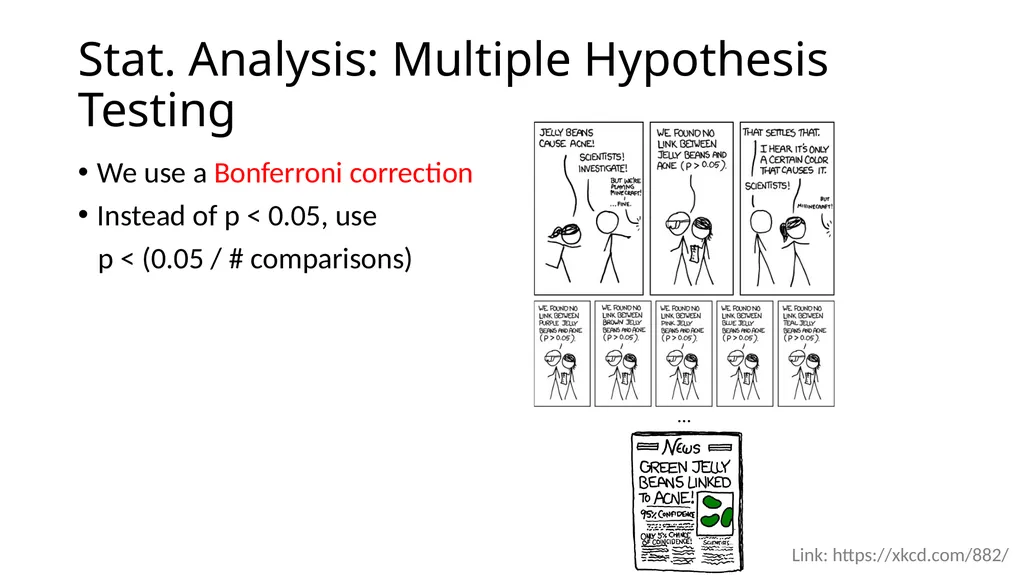
Stat. Analysis: Multiple Hypothesis Testing … Link: https://xkcd.com/882/ We use a Bonferroni correction
Instead of p < 0.05, use
p < (0.05 / # comparisons)<br>
20
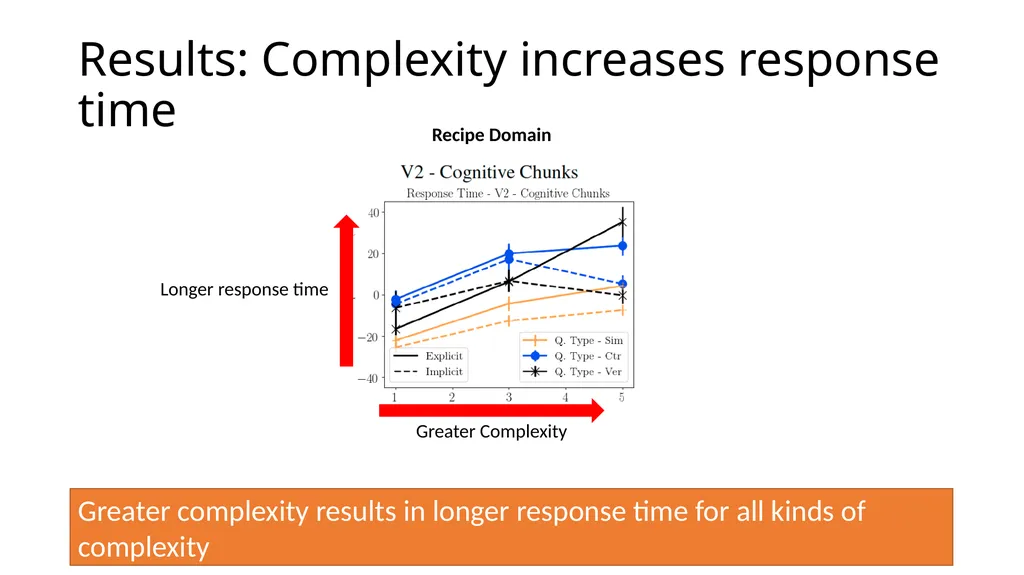
Results: Complexity increases response time Recipe Domain Greater Complexity Longer response time Greater complexity results in longer response time for all kinds of
complexity<br>
21
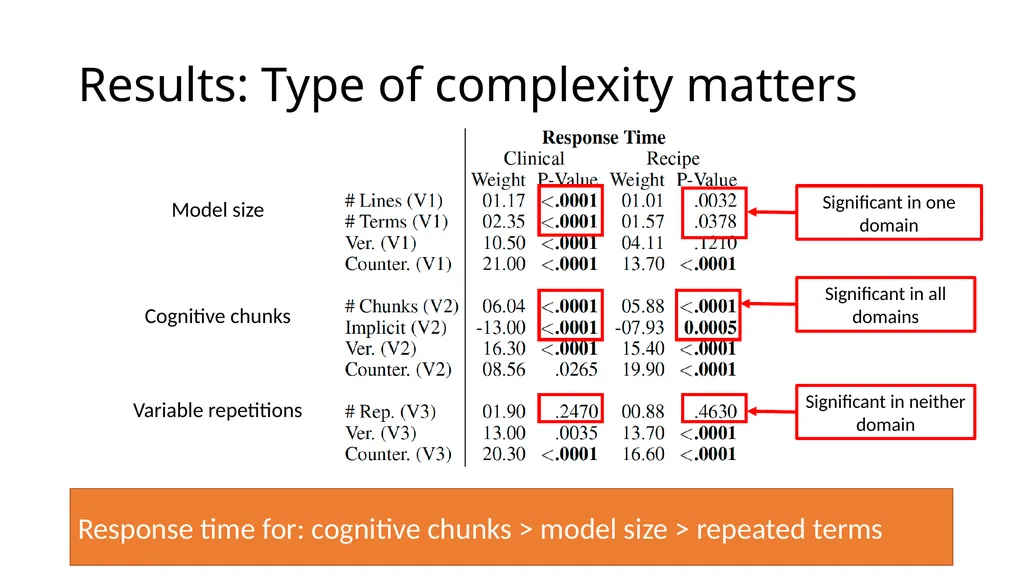
Results: Type of complexity matters Model size Variable repetitions Cognitive chunks Response time for: cognitive chunks > model size > repeated terms Significant in all domains Significant in neither domain Significant in one domain<br>
22
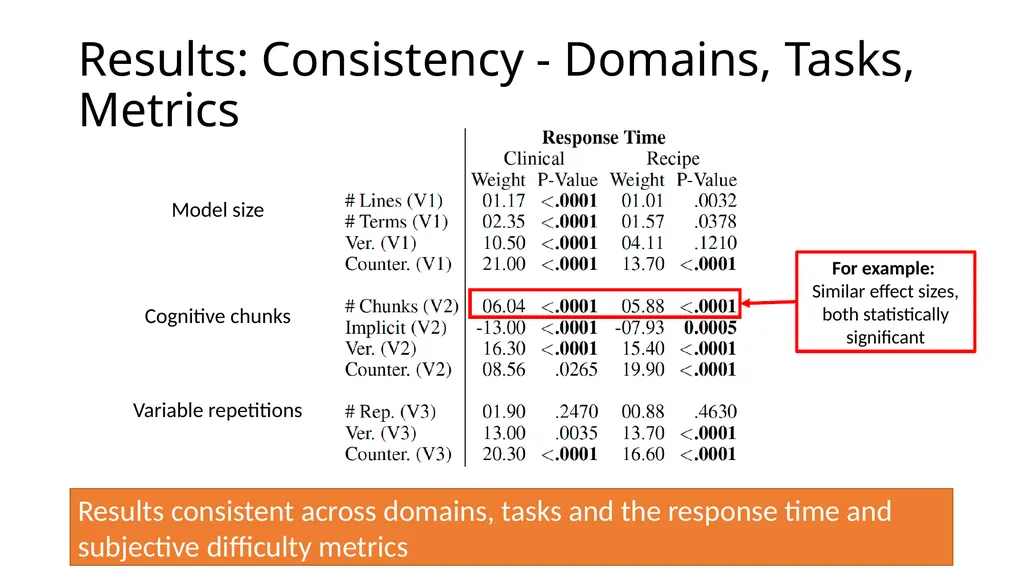
Results: Consistency - Domains, Tasks, Metrics Results consistent across domains, tasks and the response time and subjective difficulty metrics Model size Variable repetitions Cognitive chunks For example:
Similar effect sizes, both statistically significant<br>
23
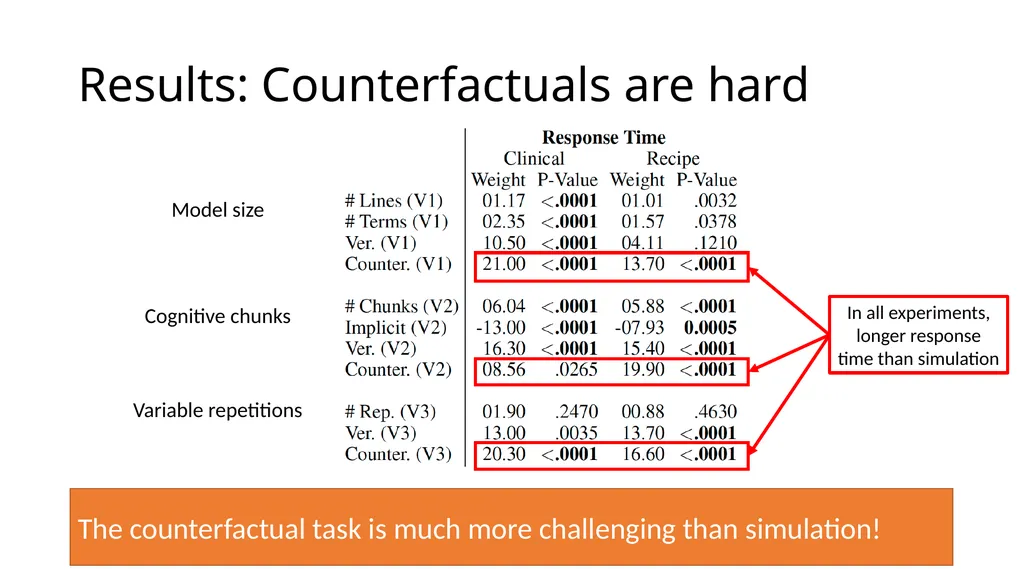
Results: Counterfactuals are hard The counterfactual task is much more challenging than simulation! Model size Variable repetitions Cognitive chunks In all experiments, longer response time than simulation<br>
24
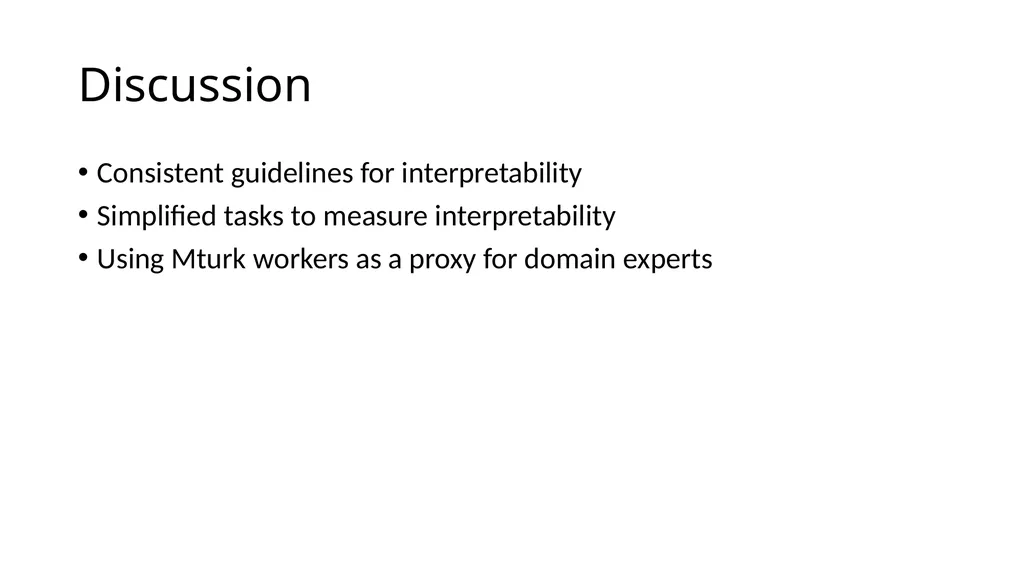
Discussion Consistent guidelines for interpretability
Simplified tasks to measure interpretability
Using Mturk workers as a proxy for domain experts<br>
26
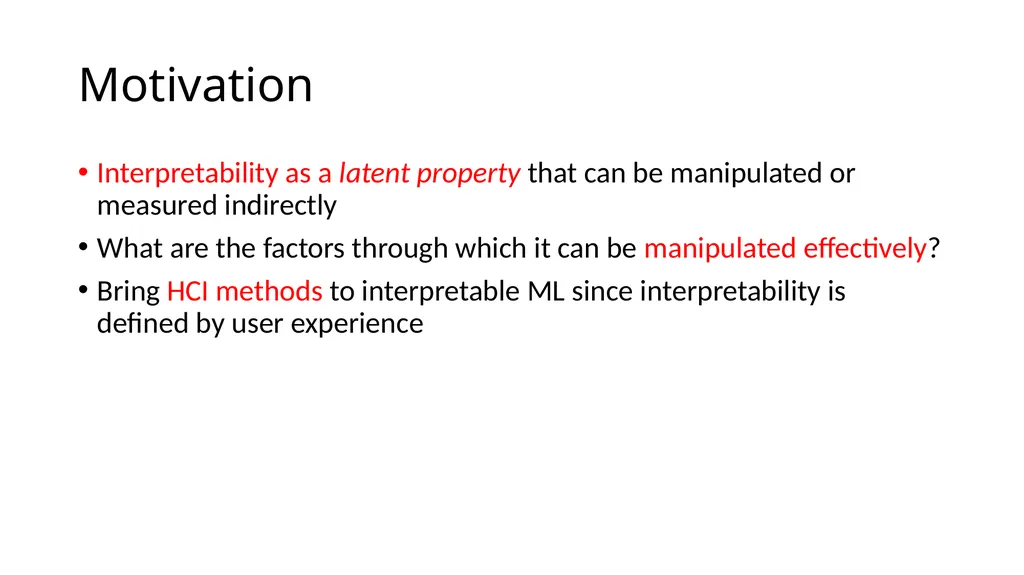
Motivation Interpretability as a latent property that can be manipulated or measured indirectly
What are the factors through which it can be manipulated effectively?
Bring HCI methods to interpretable ML since interpretability is defined by user experience<br>
27
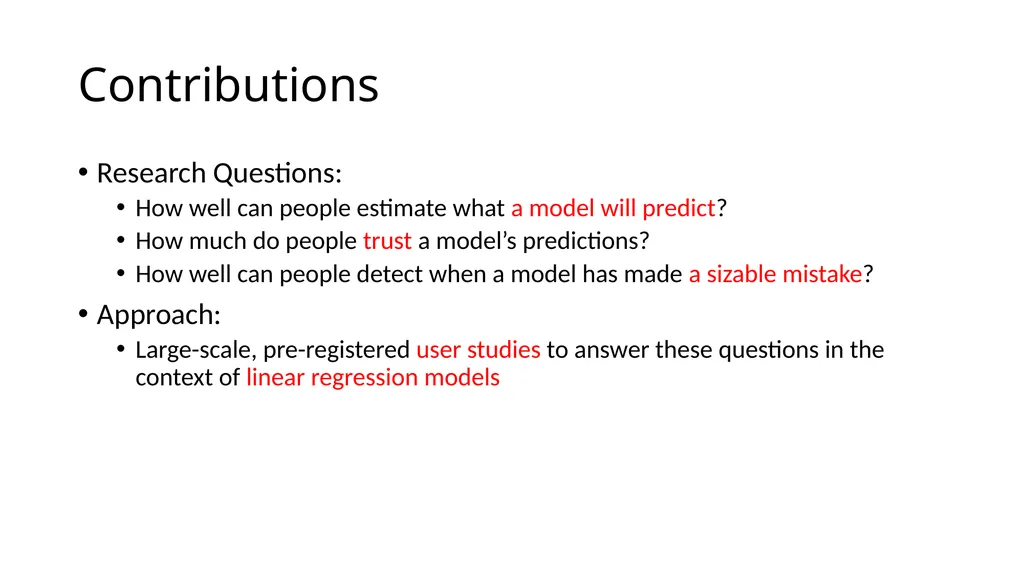
Contributions Research Questions:
How well can people estimate what a model will predict?
How much do people trust a model’s predictions?
How well can people detect when a model has made a sizable mistake?
Approach:
Large-scale, pre-registered user studies to answer these questions in the context of linear regression models<br>
28
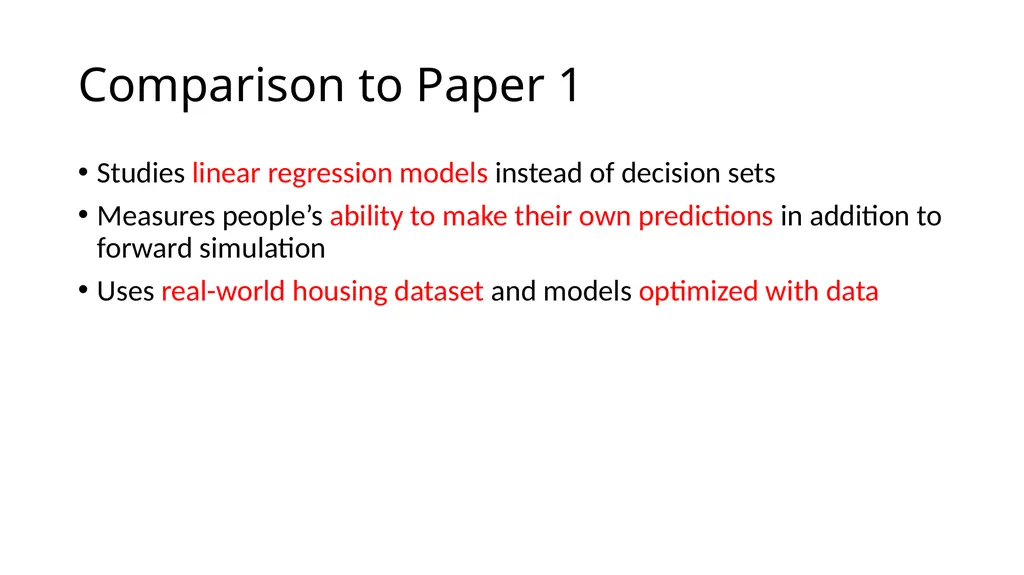
Comparison to Paper 1 Studies linear regression models instead of decision sets
Measures people’s ability to make their own predictions in addition to forward simulation
Uses real-world housing dataset and models optimized with data<br>
29
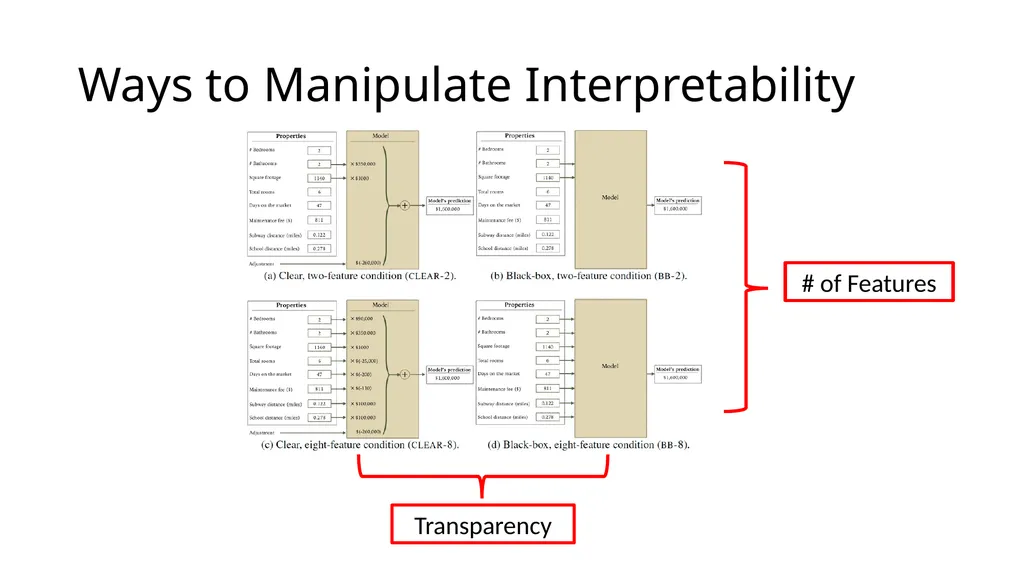
Ways to Manipulate Interpretability # of Features Transparency<br>
30
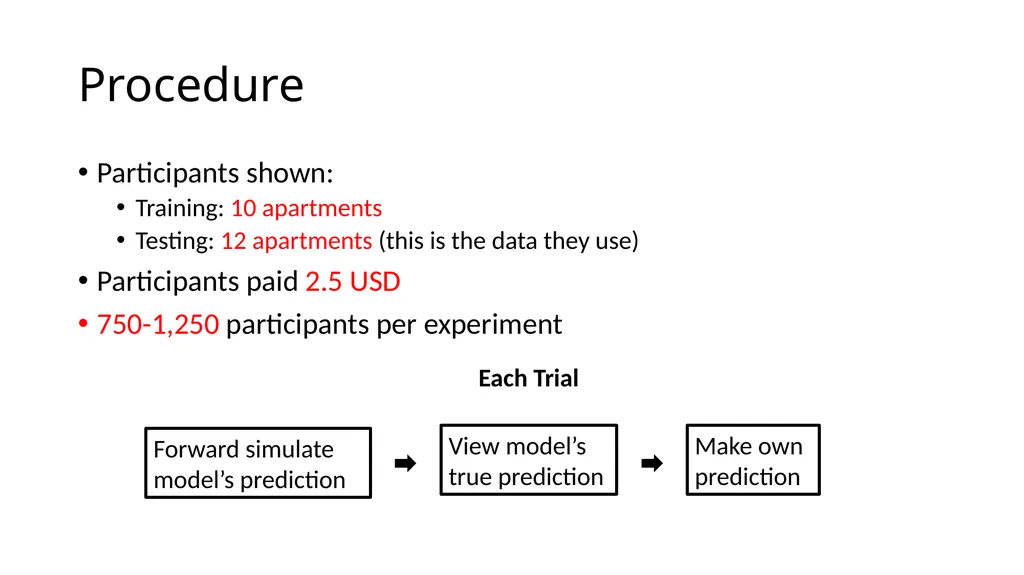
Procedure Participants shown:
Training: 10 apartments
Testing: 12 apartments (this is the data they use)
Participants paid 2.5 USD
750-1,250 participants per experiment Forward simulate model’s prediction View model’s true prediction Make own prediction Each Trial<br>
31
Statistical Analysis: Participant Specific Effects A repeated measures experimental design
Each participant makes many predictions
Use a mixed-effects model to control for correlations between a participant’s responses
Assumes a random, participant-specific effect<br>
32
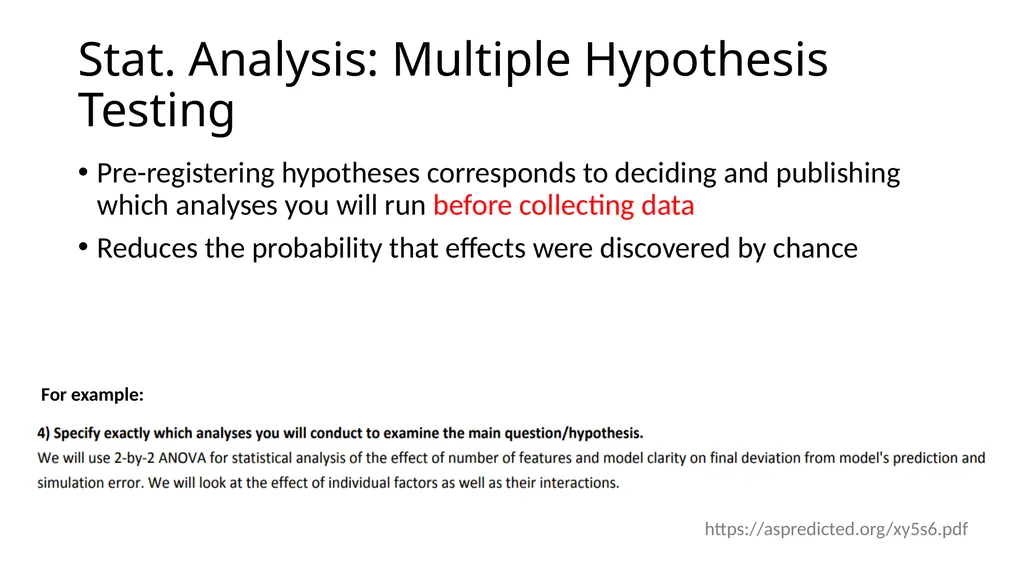
Stat. Analysis: Multiple Hypothesis Testing Pre-registering hypotheses corresponds to deciding and publishing which analyses you will run before collecting data
Reduces the probability that effects were discovered by chance For example: https://aspredicted.org/xy5s6.pdf<br>
33
Design choices Randomized the order of the first 10 (normal) apartments and fixed the order of the last 2 (unusual)
All participants are shown an identical set of apartments
Each participant completed a single condition (between subjects design)<br>
34
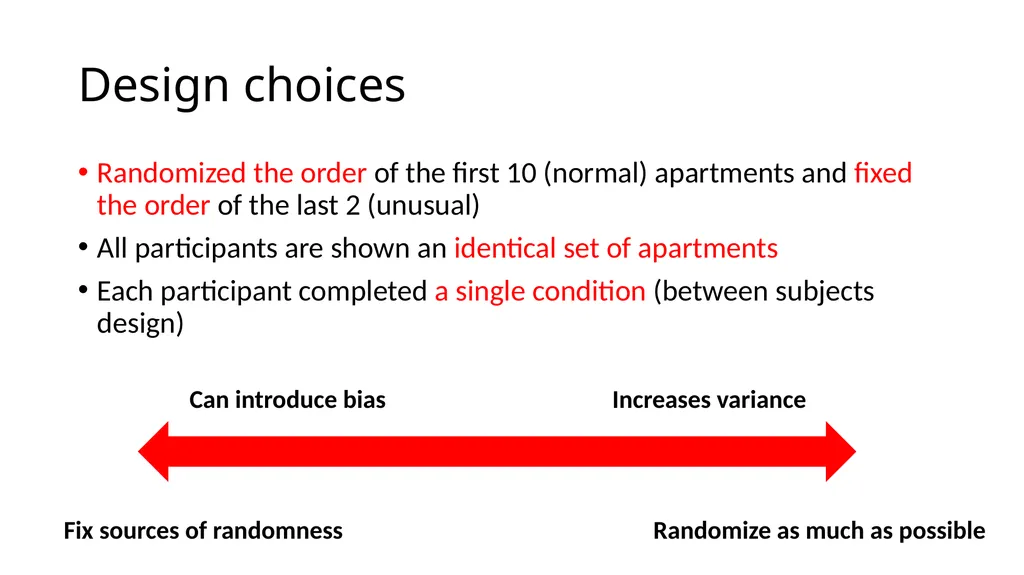
Design choices Randomized the order of the first 10 (normal) apartments and fixed the order of the last 2 (unusual)
All participants are shown an identical set of apartments
Each participant completed a single condition (between subjects design) Fix sources of randomness Randomize as much as possible Can introduce bias Increases variance<br>
35
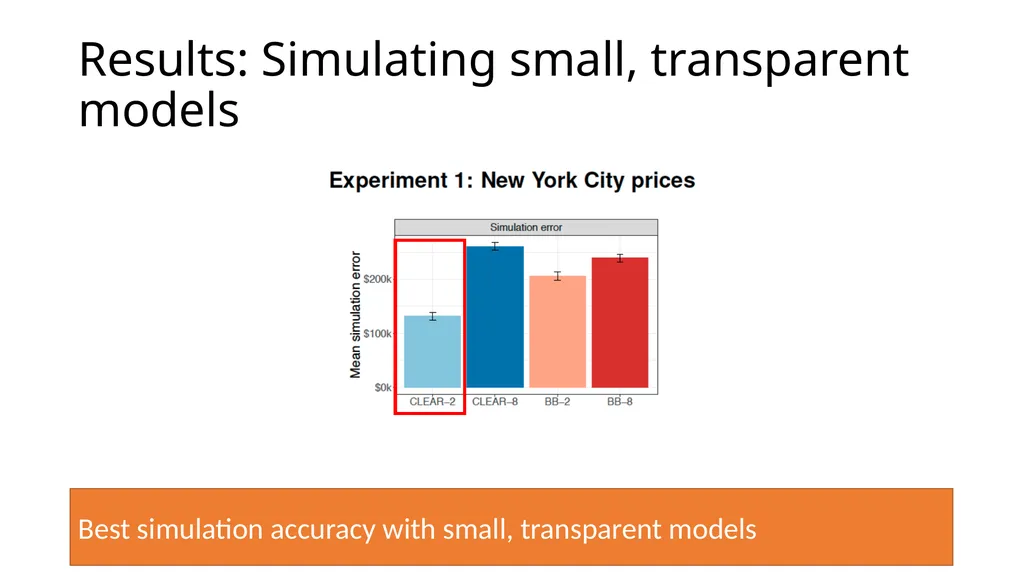
Results: Simulating small, transparent models Best simulation accuracy with small, transparent models<br>
36
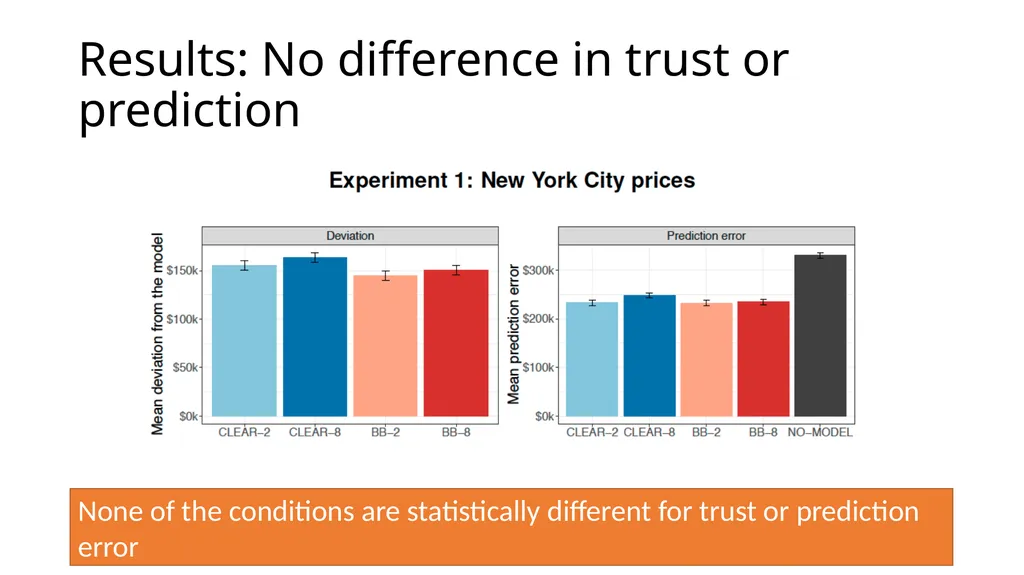
Results: No difference in trust or prediction None of the conditions are statistically different for trust or prediction error<br>
37
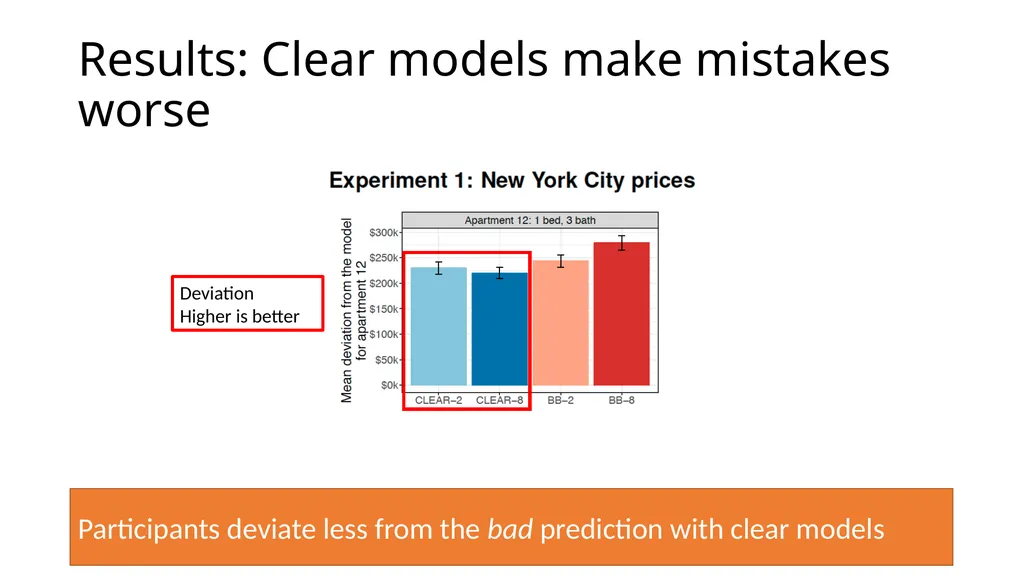
Results: Clear models make mistakes worse Deviation
Higher is better Participants deviate less from the bad prediction with clear models<br>
38
Additional Experiments Scaled down prices to better reflect national average
Same results<br>
39
Additional Experiments Scaled down prices to better reflect national average
Better trust metrics
No significant different in trust between models<br>
40
Additional Experiments Scaled down prices to better reflect national average
Better trust metrics
Attention check for unusual features
People catch more errors<br>
41
Discussion Highlighting weird inputs helps catch errors
Having people predict before seeing the model helped catch errors
Transparency actually makes people worse at catching errors<br>