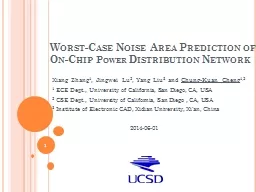
Power Distribution Network Xiang Zhang 1 Jingwei Lu 2 Yang Liu 3 and Chung Kuan Cheng 12 1 ECE Dept University of California San Diego CA USA 2 CSE Dept University of California San ID: 781652
Download The PPT/PDF document "Worst-Case Noise Area Prediction of On-C..." is the property of its rightful owner. Permission is granted to download and print the materials on this web site for personal, non-commercial use only, and to display it on your personal computer provided you do not modify the materials and that you retain all copyright notices contained in the materials. By downloading content from our website, you accept the terms of this agreement.
Slide1
Worst-Case Noise Area Prediction of On-Chip Power Distribution Network
Xiang Zhang1, Jingwei Lu2, Yang Liu3 and Chung-Kuan Cheng1,21 ECE Dept., University of California, San Diego, CA, USA2 CSE Dept., University of California, San Diego , CA, USA3 Institute of Electronic CAD, Xidian University, Xi’an, China 2014-06-01
1
Slide2Executive Summary
Problem: Previous works focus on the worst-peak droop to sign off PDN.Worst-peak noise ≠ Worst timing (delay)Our goal: To predict a PDN noise for better timing sign off.Observation: The noise area of PDN => Behavior of circuit delayCase study: Design the worst-case PDN noise areaProvide analytical solution for a lumped PDN modelDesign an algorithm for general PDN casesResults: Worst-area noise introduces 1.8% additional propagation delay compared to worst-peak noise from our empirical validation under a complete PDN path.2
Slide3Power Distribution Network (PDN)
Power supply noiseResistive IR dropInductive Ldi/dt noisePDN model
3
Slide4MotivationPerformance sensitivity on PDN voltage drop
Increased signal delay [Saint-Laurent’04] [Jiang’99]Clock jitter [Pialis’03]Delay vs supply voltage(courtesy of [Saint-Laurent’04])
4
Slide5PDN Noise Area vs Delay
Delay is measured under a modified C432 of ISCAS85 circuit in 130nm node5
Slide6Problem Formulation
PDN CharacterizationImpulse Response h(t)Voltage Noise:
Input to PDN systemTransient load current demand i
(t)
Assumption:
All on-die loads lumped into a single load
Total current is bounded
6
Slide7Problem Formulation
Worst-case peak noise [Hu et al @ SLIP2009]
where the worst-current :
Voltage Noise Area
Integral within sliding window
Window size T corresponds to
one clock cycle
Defined as
, a function of
input current
Worst-case optimization
Design of current
and voltage drop
Achieve maximum noise area Aw and interval
Can be solved by polynomial-time method
when
when
7
Slide8Problem
SimplificationBinary-valued worst currentCan be proved that
only switches between 0 and 1Current decomposition equals the superposition
of
a series
of
step
inputs
Single step input & response
Step response
Integrate
into ramp response
Noise area function
8
Slide9Simplified Problem Formulation
A linear-constrained linear optimization problemInputA power network system with impulse response h(t)Given window size TOutputWindow location Phase delay of step inputs,
ObjectiveMaximum noise area Aw within
Constraints
, t is
9
Slide10Case Study: RLC Tank
ModelImpedance Profile: , whereAssume Q>0.5, system is underdampedStep Response :where
Ramp Response :where
10
Slide11Worst Noise Area Prediction for RLC Tank
Given a window size T, worst-area noise is is set to a relatively large value when
. is
is the time
when local
peaks/valleys of
occur.
Solved by setting
since
is piecewise-defined
func
.
Case 1 (
):
is the solution of ,
i.e.
Case 2 (
):
where
.
11
Slide12Case Study:
Worst Noise Area Prediction for General PDN CasesReal PDN structure is complicatedConsists of multiple frequency componentsDevelop algorithm Algorithm design for general casesGiven window size T and arbitrary impulse response
Determine the phase delay of each step input
Constructs
by superposing
Maximum noise
is achieved
12
Slide13Intuition
Align all together to generate
Select one point from
to determine the phase delay
Maximize (+)
by choosing peak points
Minimize
(-)
by choosing valley points
Determine
as the last peak of
.
= sum of all peaks- sum of all valleys
13
Slide14Algorithm Design
Given & Impulse response and window sizeGenerate
, and
Step responses and its transformation
Extract all peaks and valleys of
Linear scanning on
Calculate each peak-to-valley distance
Determine phase delay
accordingly
Determine
(t) by
and its sign (±)
Construct
adding up all
together
14
Slide15Complexity AnalysisOur algorithm consists of finite operations
Step response transformationLinear scan for peaks & valleys extractionWorst-case current constructionOverall complexity is O(n)Finite amount of operationsEach operation consumes no larger than linear runtime15
Slide16Experimental Design and Results
Setup:Matlab R2013aHSPICE D-2013.03-SP1Cadence Allegro Sigrity Power SI 16.6Ansoft Q3D 12.0ISCAS85 circuit under 0.13um cell libIntel i7 Qual-Core 3.4GHz w/16GB PCDDR3PDN test casesSingle RLC tankCascaded RLC tanksA complete PDN path extracted from industrial design16
Slide17Worst-Peak and Worst-Area Noise of a Single RLC Tank Case
Nominal Vdd= 1V, T=17nsBoth load current activities stop at
17
Slide18Worst-Area and Worst-Peak Noise of Multi-Stage Cascaded RLC Tanks
Circuit ModelThree Cases
Case I can be approximated to three single RLC tanks:
18
Slide19Worst-Area and Worst-Peak Noises of Multi-Stage Cascaded RLC Tanks
Compare the worst-case noise predcition from the analytical solution approximations from RLC tank decomposition vs solution of Algorithm 1 for Prediction Error (on average) :7.75% for the worst-peak noise12.3% for the worst-area noise
19
Slide20Worst-Peak and Worst-Area Noise of a Complete PDN PathImpedance Profile:
20
Slide21Worst-Peak and Worst-Area Noise of a Complete PDN Path
Worst-peak and worst-area noise solved by Alg. 1,
21
Slide22Delay Measurement of
a Complete PDN PathSend input pulse every 100ps and record delay of the datapath at the output port of C432 (ISCAS85) caseCompare the delay under worst-peak and worst-area noiseResults:
22
Slide23Conclusions
Problem: Previous works focus on the worst-peak droop to sign off PDN.Worst-peak noise ≠ Worst timing (delay)Our goal: To predict a PDN noise for better timing sign off.Observation: The noise area of PDN => Behavior of circuit delayCase study: Design the worst-case PDN noise areaProvide analytical solution for a lumped PDN modelDesign an algorithm for general PDN casesResults: Worst-area noise introduces 1.8% additional propagation delay compared to worst-peak noise from our empirical validation under a complete PDN path.23
Slide24Q & A
Thank You!24
Slide25Backup Slides
25
Slide26Delay Measurement of Single RLC Tank Case
Send input pulse every 100ps and record delay of the datapath at the output port of C432 (ISCAS85) case26