PPT-Figure S2.
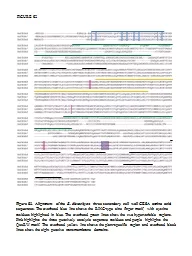
Alignment of the B distachyon three secondary cell wall CESA amino acid sequences The overhead blue line shows the RINGtype zinc finger motif with cystine residues
Download Presentation
"Figure S2." is the property of its rightful owner. Permission is granted to download and print materials on this website for personal, non-commercial use only, provided you retain all copyright notices. By downloading content from our website, you accept the terms of this agreement.
Presentation Transcript
Transcript not available.