/
Natural environments and health and wellbeing: Natural environments and health and wellbeing:

Natural environments and health and wellbeing: - PowerPoint Presentation

conterc
conterc . @conterc
Follow
345 views
Uploaded On 2020-06-17

Natural environments and health and wellbeing: - PPT Presentation

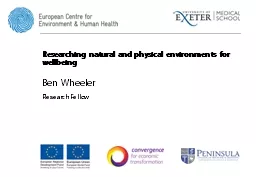
Evidence and connections with localnationalinternational health and environmental policy Ben Wheeler Senior Lecturer SMaSH Seminar December 2018 Outline Pathways from nature health and wellbeing ID: 779733

amp health wheeler urban health amp urban wheeler evidence natural wellbeing mental nature white environments coast green depledge public

Share:

Link:

Embed:

Download Presentation from below link

Download The PPT/PDF document "Natural environments and health and well..." is the property of its rightful owner. Permission is granted to download and print the materials on this web site for personal, non-commercial use only, and to display it on your personal computer provided you do not modify the materials and that you retain all copyright notices contained in the materials. By downloading content from our website, you accept the terms of this agreement.


Presentation Transcript

Slide1

Natural environments and health and wellbeing:

Evidence and connections with local/national/internationalhealth and environmental policy

Ben Wheeler, Senior Lecturer

SMaSH

Seminar

December 2018

Slide2

OutlinePathways

from nature  health and wellbeingSome recent evidence

Green space & Blue space

Links with health inequalities

W

hat’s it worth?

Valuing

nature for health

Linking evidence,

policy and practice

Slide3

Nature – Health & Wellbeing Pathways

Wheeler et al 2015

. Beyond greenspace: an ecological study of population general health and indicators of natural environment type and quality.

Int

J Health

Geogr

14, 17

. Adapted from Hartig et al 2014 Nature & Health. Ann Rev PH

Slide4

Nature – Health & Wellbeing Pathways

Individual Agency

Societal Structures

Cultural Norms

Nature Connectedness

Wheeler et al 2015

. Beyond greenspace: an ecological study of population general health and indicators of natural environment type and quality.

Int

J Health

Geogr

14, 17

. Adapted from Hartig et al 2014 Nature & Health. Ann Rev PH

Slide5

Geographic/Proximity Studies

Qualitative interview/ focus groups

Lab/VR Studies

Field Experiments

Systematic review & evidence synth

Visit Surveys

Geo- narrative

How do we understand this complexity?

Slide6

Selected evidence

Slide7

Green space, mental health & wellbeing

Slide8

British Household Panel Survey (1991-2008)

Urban

Greenspace

& Mental Health in England

Each year 5,000 households (n > 10,000) surveyed

Focused on 84% of households in “urban” areas

Mental Ill-health

: General Health Questionnaire (GHQ-12) “Compared to

usual how have you been feeling in the last few weeks”

e.g. “able to cope”, “stressed”. The higher the score, the

higher the mental distress.

Subjective well-being

: Life Satisfaction (LS): “How dissatisfied or satisfied

are you with your life overall?” with responses ranging

from 1 (Not satisfied at all) to 7 (Completely satisfied).

r

(GHQ/LS)

= -.50

Slide9

British Household Panel Survey (1991-2008)

Urban Green space & Mental Health in England

We know which small area participants live in, and self reported mental health/wellbeing at each wave

Geographically link with environment data

Do people report better mental health in years when they live in greener urban areas?

Slide10

Error bars = 95% confidence intervals

Controlling for:

Individual Level - age, income, education, health, employment status, marital status, children, commute, house type, house

size. Area

Level: Income, Employment, Education, Crime,

White, Alcock, Wheeler &

Depledge

(2013

). Would you be happier living in a greener urban area?

Psychological Science

.24, 920-928.

Do people report better mental health in years when they live in greener urban areas

?

YES

Slide11

Mental well-being (Inverse GHQ: 1-12)

(N = 12,818;

Obs

= 87,573)

British Household Panel Survey (1991-2008; 27,284 Urban LSOA)

Life Satisfaction (1-7)

(N = 10,168; Obs = 56,574)

Modelling the impact of moving from an LSOA 1SD < M Green cover (48%) to one 1SD >M green cover (81%)

BHPS & Mental Health

Controlling for:

Individual Level - age, income, education, health, employment status, marital status, children, commute, house type, house

size. Area

Level: Income, Employment, Education, Crime,

White, Alcock, Wheeler &

Depledge

(2013

). Would you be happier living in a greener urban area?

Psychological Science

.24, 920-928.

Slide12

What about ‘blue space’?

Evidence on coastal environments

Slide13

The coast in Europe

a

Depledge

, M.H., Wheeler, B.W. & White, M.P. (2014). Seas, society, health and well-being. The Marine Biologist, 3,

25-27.

b

Blue Growth Strategy:

http://ec.europa.eu/maritimeaffairs/policy/blue_growth

/

;

European Coast: ≈ 89,000km

a

It’s a place where people: live ≈ 200 million

inhabitants

a

work ≈ 5.5 million

jobs

b

generate growth ≈ €500 billion

pa

b

[Mostly urban]

And yet “

many people have little understanding of the importance of our seas and oceans in their daily lives [and] the impact they have on human health and wellbeing

” (Draft Rome Declaration, 2014)

Slide14

England’s population healthCensus general health questionn ~48m across ~30,000 small areas

Slide15

Slide16

Health of coastal populationsDepledge, M., Lovell, R., Wheeler, B., Morrissey, K., White, M., Fleming, L., 2017. Future of the Sea: Health and Wellbeing of Coastal Communities

. London: Gov Office for Science

Slide17

Health at the coast – after adjustmentAdjusted for population age, sex, Indices of Deprivation, greenspace

Wheeler, B.W., White, M., Stahl-Timmins, W., Depledge, M.H. (2012). Does living by the coast improve health and wellbeing?

Health & Place 18 (5): 1198-1201

>50km 20-50km 5-20km 1-5km <1km

Slide18

InequalitiesDo good quality environments have the potential to mitigate adverse health impacts of poverty/low socio-economic status?Equigenic – equality promoting - environments? (Mitchell et

al, 2015) Mitchell, R.J., Richardson, E.A., Shortt, N.K., Pearce, J.R., 2015. Neighborhood Environments and Socioeconomic Inequalities in Mental Well-Being. American Journal of Preventive Medicine 49, 80-84.

Slide19

Health at the coast & equigenesis

OLS regression coefficients; all models adjust for age, sex, 5 deprivation domains, and greenspace

We find the strongest link in the poorest urban areas; in wealthier areas there’s almost no evidence of a connection.

Wheeler, B.W., White, M., Stahl-Timmins, W., Depledge, M.H. (2012). Does living by the coast improve health and wellbeing?

Health & Place

18 (5

): 1198-1201

Slide20

What about actual visits to nature?

Slide21

Natural England/TNS (2013) MENE Infographic Report

http://www.naturalengland.org.uk/ourwork/evidence/mene.aspx

Monitor of Engagement with the Natural Environment

Slide22

MENE visit locations

MENE

Subset

asked about

experiences

Stress reduction

: To what extent did they feel ‘x’ after the visit:

1)

Relaxed?

2)

Calm?

3)

Refreshed?

4)

Revitalised?

Controlled for Who (Age, gender, SES) & What (activities, duration, who with, distance travelled etc.)

Slide23

Stress reduction in different natural environments

White, Pahl,

Ashbullby

, Herbert &

Depledge

(

2013

).

Journal of Environmental Psychology,

35

, 40-51

Error bars: 95% CI

Slide24

Physical activity

“In the past week, on how many days have you done a total of 30 minutes or more physical activity which was enough to raise your breathing rate? This may include sport, exercise, and brisk walking or cycling for recreation or to get to and from places, but should not include housework or physical activity that may be part of your job”

Slide25

Do people who live near the coast exercise more?

N = 183,755, controlling for area green space, & deprivation (IMD) + individual age, gender, SES, marital status, employment status, children, ethnicity, disability, car ownership, dog ownership, year and season.

ref

White MP, Wheeler BW, Herbert S, Alcock I,

Depledge

MH (2014) Coastal proximity and physical activity: Is the coast an under-appreciated public health resource? Preventive Medicine 69:135-140.

Slide26

What do people do at the coast?

MENE Coastal activities n = 1,290

2%

3%

17%

70%

Most

coastal

activity doesn’t involve getting

wet

Walking is important

Slide27

Dog walking & greenspacePotentially a key effect modifier (in England at least)We find an association between neighbourhood greenspace and PA – but only for dog owners

White, M.P., Elliott, L.R., Wheeler, B.W., Fleming, L.E., 2018. Neighbourhood greenspace is related to physical activity in England, but only for dog owners. Landscape and Urban Planning 174, 18-23.

Slide28

Who doesn’t visit nature (including urban)?Survey data (n~60,000)a quarter of the population reported visiting natural environments < once a month (‘infrequent’ visitors

)Infrequent visitors more likely to be:FemaleOlderIn poor healthLower socioeconomic statusBlack & Minority Ethnic GroupsLive in relatively deprived areas

Reside in areas with less neighbourhood greenspaceBoyd et al

2018. Who doesn’t visit natural environments for recreation and why: A population representative analysis of spatial, individual and temporal factors among adults in England. Landscape and Urban Planning 175, 102-113.

Slide29

And Why?Main reason for not visiting nature

Slide30

Potential Environmental Risks

Nature won’t be beneficial for everyone – and could be harmful, e.g.Pollen – allergiesTicks and other disease vectorsChemical and biological exposuresWeather (heat, cold, UV)Accidents – injuries, drowning

Context: wider climate change impacts

Slide31

Risk of increasing inequalities?

Universal public health interventions risk widening inequalitiesRisk of gentrification with ‘greening’ of urban areas?

http://www.bcnuej.org/green-inequalities-blog/

Slide32

Informing policy & practiceAction going on at all levels in environment & health sectors

Local/city authoritiesNationalInternationalA lot of enthusiasmBut money talks…

Slide33

So, what’s it worth?If natural environments support and promote PA, what’s the health economic value?PA

 better health  £$€¥?

Slide34

White, M.P., Elliott, L.R., Taylor, T., Wheeler, B.W., Spencer, A., Bone, A., Depledge, M.H., Fleming, L.E., 2016. Recreational physical activity in natural environments and implications for health: A population based cross-sectional study in England. Preventive Medicine 91, 383-388.

Using MENE data on PA in natural environments and the UK social value of a QALY.

NICE – pay £20k-

£30k for a treatment that produces 1 additional

QALY

Slide35

What about all the other evidence?

Slide36

Recent systematic reviewsEvidence for benefits for a range of health outcomesBut limited e.g. by:Lack of causal evidence

Heterogenity of exposure/outcome measuresLimited assessment of environmental qualityLimited control for SES, other covariates

e.g. Gascon et al 2015

. Mental health benefits of long-term exposure to residential green and blue spaces: a systematic review

.

International Journal of Environmental Research and Public Health 12,

4354-4379

Lovell

et al 2015

Understanding how environmental enhancement and conservation activities may benefit health and wellbeing: a systematic review. BMC Public Health 15 (1):1-18

.

Twohig-Bennett & Jones 2018

. The health benefits of the great outdoors: A systematic review and meta-analysis of greenspace exposure and health outcomes. Environmental Research 166, 628-637.

Slide37

Slide38

Slide39

National Policy

Marine & Coastal Access Act 2009

“aims

to improve public access to, and enjoyment of, the English coastline by creating clear and consistent public rights along the English coast for open-air recreation on foot

.”

http://

publications.naturalengland.org.uk/publication/5327964912746496

Slide40

National Policy

Underpins health in the UK government’s 25 year plan for the natural environment

https://beyondgreenspace.net/2018/09/07/defra_health_review

/

Slide41

Evidence-based management of

public open space to support both biodiversity and human health and wellbeing

Supporting Cornwall’s Open Space Strategy

Biodiversity, Health and Wellbeing in Cornwall’s Public Open Space

https://beyondgreenspace.net

/

Slide42

Sustainable Development GoalsSDG 11.7By 2030, provide universal access to safe, inclusive and accessible, green and public spaces

, in particular for women and children, older persons and persons with disabilities 

Slide43

WHO Action Brief

Slide44

[Amongst

a large number of other suggestions]

http://www.euro.who.int/en/health-topics/environment-and-health/urban-health/publications/2017/urban-green-spaces-a-brief-for-action-2017

Why 300m?

it

seems

‘reasonable’ based on the evidence (WHO advisory group)

Maybe:

Grahn

&

Stigsdotter

2003. Landscape planning and stress. Urban Forestry & Urban

Greening

Slide45

So…There’s a rapidly growing evidence base

We could be better at considering complexity – of the environment, our interactions with it, mechanisms and health impactsIncreasing accessibility/engagement is not without riskEnvironmental risksNegative impacts of gentrification and widening inequalitiesBut there seems to be potential to act to promote

and protect both the natural environment and human health

Slide46

Beyond Greenspace blog

Thanks to colleagues

Mike

Depledge

Lora Fleming

Mat White

Becca Lovell

Sarah Bell

& the rest of the team

b.w.wheeler@exeter.ac.uk

@benedictwheeler

http://beyondgreenspace.net