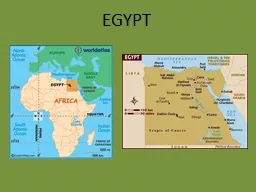
/
Projecting the Potential Evapotranspiration of Egypt using a high resolution regional Projecting the Potential Evapotranspiration of Egypt using a high resolution regional

Projecting the Potential Evapotranspiration of Egypt using a high resolution regional - PowerPoint Presentation

eddey
eddey . @eddey
Follow
65 views
Uploaded On 2023-10-30

Projecting the Potential Evapotranspiration of Egypt using a high resolution regional - PPT Presentation

1 Motivation Calculating potential Evapotranspiration PET is important especially for long term of water management on a regional scale PenmanMonteith PM is the best method to calculate PET as recommended by Food and Agriculture Association FAO However it requires a large number of meteo ID: 1026844

pet period evapotranspiration cru period pet cru evapotranspiration potential model regcm4 2005 day method domain historical temperature climate egypt

Share:

Link:

Embed:

Download Presentation from below link

Download Presentation The PPT/PDF document "Projecting the Potential Evapotranspirat..." is the property of its rightful owner. Permission is granted to download and print the materials on this web site for personal, non-commercial use only, and to display it on your personal computer provided you do not modify the materials and that you retain all copyright notices contained in the materials. By downloading content from our website, you accept the terms of this agreement.


Presentation Transcript

1. Projecting the Potential Evapotranspiration of Egypt using a high resolution regional climate model (RegCM4)1

2. MotivationCalculating potential Evapotranspiration (PET) is important especially for long term of water management on a regional scale.Penman-Monteith (PM) is the best method to calculate PET as recommended by Food and Agriculture Association (FAO). However it requires a large number of meteorological input (not available for a long time), also uncertainty of the meteorological input can amplify the error of the calculated PET.So there an urgent need for the PET to be calculated using a simple empirical method. Hargreaves-Samani (HS) was selected because it is recommended by the FAO as the best alternative method after the PM and it only requires global incident solar radiation and mean air temperature (available from the regional climate model; RegCM4).2

3. Target of study3Examine the capability of the RegCM4 model to calculate PET using the HS method in comparison with the CRU product in the historical period 1981-2005. Correct the projected PET under the two future scenarios using the LRM approach (Shiri et al. 2014) between the RegCM4 and CRU of the historical period.

4. Penman-Monteith Equation4

5. Hargreaves-Samani Equation5Rs is in units of water evaporation, in mm day-1, and T in ºC.

6. Experiment design: 1 – Domain configurationA – MENA Domain6

7. 7B – Egypt Domain

8. Experiment Design : 2 – Physical configuration8Domain Dimension Coarse domain (50 km with 235 grid points in the zonal direction and 121 grid points in the meridional direction, clat = 19.5, clon = 24.5); Nested domain (20 km with 121 in zonal and meridional direction, clat = 25.5, clon = 30.5)Model ProjectionLambert-conformalLateral Boundary condition and SSTMax Planck Institute (MPI) with resolution 1.8 x 1.8 degrees Historical : 1981-2005RCP45 and 85 : 2006-2100 Convection schemeGrell over land and Emanuel over oceanRadiation schemeCCM3Land surface schemeBiosphere Atmosphere Transfer System (BATS)

9. Climate Research Unit (CRU)The gridded Climatic Research Unit (CRU) Time-series (TS) data version 4.05 data are month-by-month variations in climate, provided on high-resolution (0.5x0.5 degree) grids, produced by CRU at the University of East Anglia.The CRU TS4.05 variables are cloud cover, diurnal temperature range, frost day frequency, potential evapotranspiration (PET), precipitation, daily mean temperature, monthly average daily maximum and minimum temperature, and vapour pressure for the period January 1901 - December 2020.Despite of uncertainty associated with the CRU product due to biases in and availability of the meteorological input data and due to simplifications in the equation - it is considered as one of the best available global reference PET dataset (Mitchell and Jones 2005; Droogers and Allen 2002; IPCC 2007).9

10. 10Average evapotranspiration (mm / day) over Egypt during 1986-2005 (RF) (a) and potential change during the period 2021-2040 (b), the period 2041-2060 (c), the period 2061-2080 (d), period 2081-2100 (e) according to the RCP4.5 scenario

11. 11Average evapotranspiration (mm / day) over Egypt during 1986-2005 (RF) (a) and potential change during the period 2021-2040 (b), the period 2041-2060 (c), the period 2061-2080 (d), period 2081-2100 (e) according to the RCP8.5 scenario

12. 12Monthly times series of Potential Evapotranspiration (PET; in mm/day) of by the RegCM4 in the historical period (1981-2005) of the twelve locations in comparison with the CRU product (in red), before applying the linear regression model (RegCM; in blue) and after applying the linear regression model (RegCMnew; in green)

13. 13Future corrected PET changes (in %) under the two future scenarios (RCP45; in blue) and (RCP85; in red) for the twelve locations

14. 14Thank you, any questions???