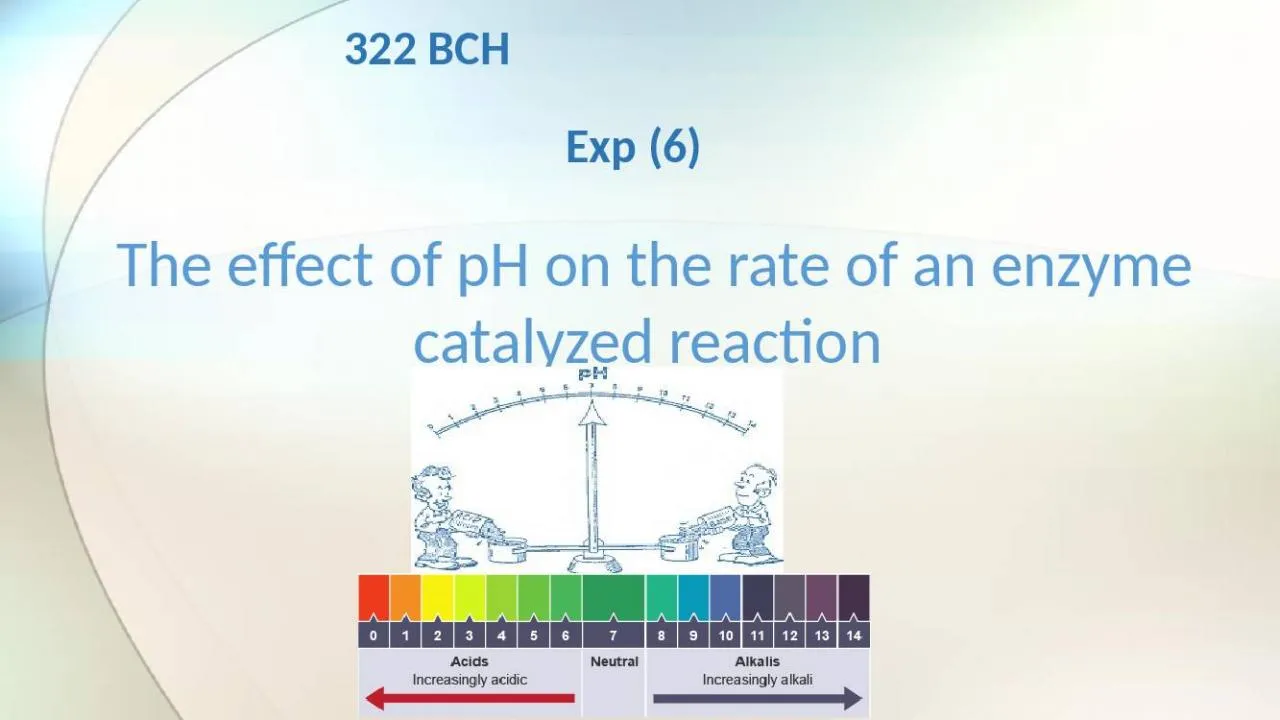
322 BCH Exp 6 In this experiment we will continue to study acid phosphatase kinetics Objectives To establish the relationship between pH and the rate of an enzyme catalyzed reaction ID: 907996
Download Presentation The PPT/PDF document "The effect of pH on the rate of an enz..." is the property of its rightful owner. Permission is granted to download and print the materials on this web site for personal, non-commercial use only, and to display it on your personal computer provided you do not modify the materials and that you retain all copyright notices contained in the materials. By downloading content from our website, you accept the terms of this agreement.
Slide1
The effect of pH on the rate of an enzyme catalyzed reaction
322 BCH Exp (6)
Slide2In this experiment, we will continue to study
acid phosphatase kinetics.
Slide3ObjectivesTo establish the relationship between pH and the rate of an enzyme catalyzed reaction.
To determine the optimum pH for such a reaction.
Slide4The effect of pH on enzyme activity
The rate of enzymatic reaction depends on pH of the medium.Each enzyme have the a pH where the enzyme is most active – which is known as the optimum pH.
For most enzymes, the optimum pH lies in the range from pH 5 to pH 9.
The optimum pH for an enzyme depends on where it normally works.
Extremely high or low pH values generally result in complete loss of activity for most enzymes.
Slide5The effect of pH on enzyme activity
Changes in pH alter an enzyme’s shape. This is because changes in pH can make and break intra- and intermolecular bonds, changing the shape of the enzyme and, therefore, its effectiveness. pH can have an effect of the state of ionization of the ionization states of the amino acid residues involved in the catalytic activity of the enzyme(active site)
Slide6Changing pH will affect amino acid charges in active sites
Low pHNeutral pH
High pH
Slide7The shape of pH activity curve
For the majority of enzymes, the relationship between the rate of an enzymatic reaction and pH takes form of a bell-shape.
Slide8The shape of pH activity curve is determined by the following factors:
Enzyme denaturation at extremely high or low pH:With some exceptions, pepsin’s optimum pH is extremely acidic. And arginase’s optimum pH is extremely basic.Effects on the charged state of the substrate or enzyme:
Most enzymatic reactions require both the substrate and the amino acid residues in the active site of the enzyme to have a specific charge state. Changes in pH change this charge state and hence affect the rate of the reaction.
The shape of pH activity curve
Slide9Under acid conditions, the enzyme catalyzes the hydrolysis of p-nitrophenyl
phosphate (pNPP) to inorganic phosphate (Pi) and p-nitrophenol. If base (KOH) is added to the mixture after the completion of the reaction, the p-nitrophenol is converted to a yellow colored form which absorbs lights at 405 nm. Principle
Slide10Method
In order to detect the effect of pH you must fix all the component except the 1 M sodium acetate buffer of different pH.
Time ( 5 minutes )
constant
Enzyme concentration
constant
Substrate concentration (0.05M)
constant
Temperature (37˚C )
constant
pH
Variable
(pH 3
,
4
,
4.5
,
5
,
5.5
,
6
,
7
,
8)
Slide11Prepare 16 tubes labeled as follows
(note: there is a blank for each pH) Blank: (B3, B4, B4.5, B5, B5.5, B6, B7, B8, B9 ) Test
: (T3, T
4
,
T
4.5
,
T
5, T5.5, T
6
,
T
7
,
T
8,
T
9
)
To each of these tubes add
Place the
tubes
in a test tube rack situated in 37
o
C water bath and let stand for 5
min.
Chemical
Volume (ml)
Corresponding pH sodium acetate buffer
0.5
0.1M MgCl
2
0.5
p-
nitrophenyl
phosphate (
pNPP
)
0.5
Water
5
Slide12Start the reaction
by adding 0.5 ml enzyme and stop it by adding 0.5 ml KOH as in the following table:
Notes
:
In
blank tube add KOH first then the enzyme, to prevent the reaction from happening
.
Tube
Start the
reaction
Stop the
reaction
all Blanks
0 min
0 min
T
3
0 min
5 min
T
4
2 min
7 min
T
4.5
4 min
9min
T
5
6 min
11 min
T
5.5
8 min
13 min
T
6
10 min
15 min
T
7
12 min
17 min
T
8
14 min
19 min
T
9
16 min
21 min
Slide13Velocity
(µmole of PNP/min) Absorbance 405 nm
pH
3
4
4.5
5
5.5
6
7
8
9
Results
Plot a graph illustrating the effect of different
pHs
on the rate of the reaction.
Slide14Calculations:
Velocity (V) = (A x 106) /(E x time)= µmole of PNP/min A= absorbanceE= extension coefficient=18.8 x 10³
Time = 5 min
Slide15The Effect of pH on the Rate of an Enzyme Catalyzed Reaction.
pH
Velocity
(µmole of PNP/min)
Optimum pH
Bell- shape curve
Slide16An introductory statement (In this experiment, we studied the effect of different pH on the rate of acid phosphatase catalyzed reaction.)
Principle From the curve, explain and discuss the relationship between the activity of acid phosphatase and pH.Define the optimum pH and determine which buffer is the best from the curve.Discussion