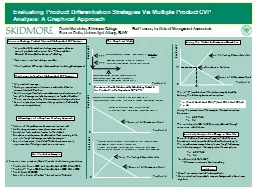
Breakeven Achieved by Selling Only Product Y Fixed Cost CM Y A One Unit Reduction in Sales of Product Y ID: 388665
Download Presentation The PPT/PDF document "Evaluating Product Differentiation Strat..." is the property of its rightful owner. Permission is granted to download and print the materials on this web site for personal, non-commercial use only, and to display it on your personal computer provided you do not modify the materials and that you retain all copyright notices contained in the materials. By downloading content from our website, you accept the terms of this agreement.
Slide1
Evaluating Product Differentiation Strategies Via Multiple Product CVP Analysis: A Graphical Approach
Breakeven Achieved by Selling Only Product Y =
Fixed Cost
CMY
.
A One Unit Reduction in Sales of Product Y
Causes Total Contribution Margin to Fall by $250
The Lost Contribution Margin, and Breakeven Can
Be Restored by Selling Two Units of Product X
Each of Which Has a Contribution Margin of $125
.
Product X
Product Y
Breakeven Can Be Maintained by Substituting Product X
for Product Y in the Proportions 2X – to – 1Y
0
The Graphical Model
The Set of Breakeven Points All Lie on a Line With Slope (– 1/2 )
(The Rate of Product Substitution = The Ratio of The Unit Contribution Margins)
Locus of All Breakeven Points
Product X
Product Y
The Sales Mix Can Be Added to the Model As a Ray From the Origin.
The Slope of the Ray Reflects the Sales Mix
If 2 Units of Y Are Sold to Each Unit of X, the Ray Will Have Slope = 2
The Ray Has the Equation Y = kX, Where k = the Sales Mix Proportions
Line Reflecting Chosen Sales Mix
Locus of All Breakeven Points
Product Y
Product X
Solving the Model for Breakeven Quantities
Product X
Product Y
0
Line Reflecting Chosen Sales Mix
Locus of All Breakeven Points
Breakeven Solution
X*
Y*
The (X*,Y*) coordinates of the solution may be found by
Solving the following two equation system:
Y = (Fixed Cost ÷ Unit CM
Y
) – (Unit CM
X
÷ Unit CM
Y
) X
Y = kX
Using the parameters of the example, the equation system
becomes:
Y = 400 - 1/2X
Y = 2X
The solution (X = 160, Y = 320) is easily obtained through successive substitution..
Sensitivity Analysis to a Change in Sales Mix
Should the desired sales mix change to Y = 3X, the new
breakeven solution can be obtained without resorting to
the cumbersome computation of a new “weighted average
contribution margin.” We simply solve the new system:
Y = 400 - 1/2X
Y = 3X
To obtain (X = 115, Y=343)*
*difference in sales mix due to rounding
Product X: Price = $225; Unit Variable Cost = $100; CM
X
= $125
Product Y: Price = $550; Unit Variable Cost = $300; CM
Y
= $250 Fixed Cost = $100,000 Sales Mix: 2 units of Product Y to each unit of Product X
An Illustrative Example
A firm sells two products, X and Y, under the following conditions
Business Strategy, Product Mix, and Multiproduct CVP Analysis
Nature of the problem can be more easily visualized. Underlying economic concepts are more evident. Analytical tools used are familiar to the student. Breakeven solutions can be obtained without resorting to the use of a “weighted average contribution margin.” Sensitivity analysis is facilitated –students can more easily experiment with strategic variations in sales mix.
Advantages of a Graphical Teaching Approach
0
0
A product differentiation strategy may require a diverse mix of products and services. See: “Tiffany and Co.”, Edward D. Hess, Darden Business Publishing. Sales mix is a critical strategic variable. Multiproduct CVP analysis becomes basic to strategy development
Challenges to Teaching Multiproduct CVP Analysis
Minimal text coverage. Strategic importance of sales mix is understated due to computational difficulties. Solution algorithms feature cumbersome constructions such as “weighted average contribution margin” or “product bundles.” These constructions offer little economic or strategic intuition. Sensitivity analysis to explore strategic options is hindered by laborious computations.
Limitations
Graphical analysis limited to two products. Generalization to n products requires background in basic linear algebra.
David Marcinko, Skidmore College Raef Lawson, Institute of Management AccountantsSaurav Dutta, University at Albany, SUNY
This Line of Breakeven Points has the Equation
Y = (Fixed Cost ÷ Unit CMY) – (Unit CMX ÷ Unit CMY) X